How to Write an Analysis Report Using AI in 2026

Introduction
In 2026, artificial intelligence has completely rewritten the rules of data analysis. You no longer need to be a data scientist or a coding expert to build professional, data-driven documents. AI tools can now instantly read your datasets, answer your questions in plain English, and automatically design stunning visuals. If you want to save countless hours and impress your stakeholders, you are in the right place.
In this guide, we will reveal how to write an analysis report using AI, compare the leading platforms on the market, and show you the ultimate shortcut to effortless reporting.
What is an AI Analysis Report?
An AI analysis report is a comprehensive document generated with the assistance of artificial intelligence that takes raw, unstructured data and transforms it into actionable, easy-to-understand insights. Instead of relying on human analysts to manually build pivot tables, write formulas, and design graphs, AI algorithms handle the heavy lifting.
In 2026, an AI analysis report goes beyond simple summaries. These reports utilize advanced Natural Language Processing (NLP) and machine learning to identify hidden trends, forecast future outcomes, and automatically format the findings into a cohesive narrative. The result is a highly accurate, beautifully structured report that saves teams countless hours while eliminating the risk of human calculation errors.
Top AI Tools for Report Writing in 2026
The market is filled with intelligent solutions, but a few stand out from the crowd. Here is a look at the top five AI tools for report writing this year.
Powerdrill Bloom
Powerdrill Bloom is the ultimate conversational AI data analysis assistant. Designed for modern professionals, it bridges the gap between complex datasets and plain-English communication, allowing users to chat with their data effortlessly.
Key Features: Advanced natural language querying, instant chart generation, automated data cleaning, and one-click exportable insights.
Pros: Zero coding required; incredibly intuitive interface; exceptionally fast at turning raw Excel files into ready-to-present reports.
Cons: Requires an active internet connection for cloud-based AI processing.
Pricing: Freemium model available; $13.27/user/month.
Julius AI
Julius AI is a powerful, highly technical AI data analyst tailored for users who need to dive deep into statistical modeling and complex data science tasks.
Key Features: Python code execution, advanced predictive analytics, machine learning model integration, and dynamic visualizations.
Pros: Outstanding for complex mathematical analysis and handling massive, intricate datasets.
Cons: Has a steeper learning curve; the highly technical interface can be overwhelming for beginners.
Pricing: Freemium model available. $16/user/month.
Zoho Analytics
A legacy business intelligence platform that has fully embraced the AI revolution. Zoho Analytics integrates its smart AI assistant, Zia, to help enterprise teams build comprehensive dashboards.
Key Features: Drag-and-drop interface, cross-functional data blending, enterprise-grade security, and automated KPI tracking.
Pros: Excellent integration with the broader Zoho ecosystem; highly reliable for large-scale enterprise reporting.
Cons: The initial setup and data-mapping process can be time-consuming and cumbersome.
Pricing: $24/user/month.
Beautiful AI
While primarily a presentation tool, Beautiful AI utilizes artificial intelligence to turn basic analytical findings into visually stunning slide decks and visual reports.
Key Features: Auto-formatting slides, smart design templates, real-time collaboration, and basic data import.
Pros: Produces the most aesthetically pleasing visual reports; perfect for boardroom presentations.
Cons: Lacks deep data-crunching capabilities; you must analyze your data elsewhere before importing it.
Pricing: Try free for 14 days. Pro at $12/month.
Qlik Sense
An enterprise-grade analytics platform that leverages AI-driven associative engines to help users explore data freely across multiple cloud environments.
Key Features: Associative data modeling, automated machine learning (AutoML), governed self-service, and robust governance.
Pros: Incredible scalability for massive corporations; offers unparalleled deep-dive exploratory features.
Cons: Very expensive pricing tiers; requires dedicated training and IT support to master.
Pricing: Custom enterprise pricing.
Step by Step Guide: How to Use Powerdrill Bloom Write an Analysis Report
Writing a report doesn't require a degree in data science. Here is how you can go from raw data to a finished report using Powerdrill Bloom.
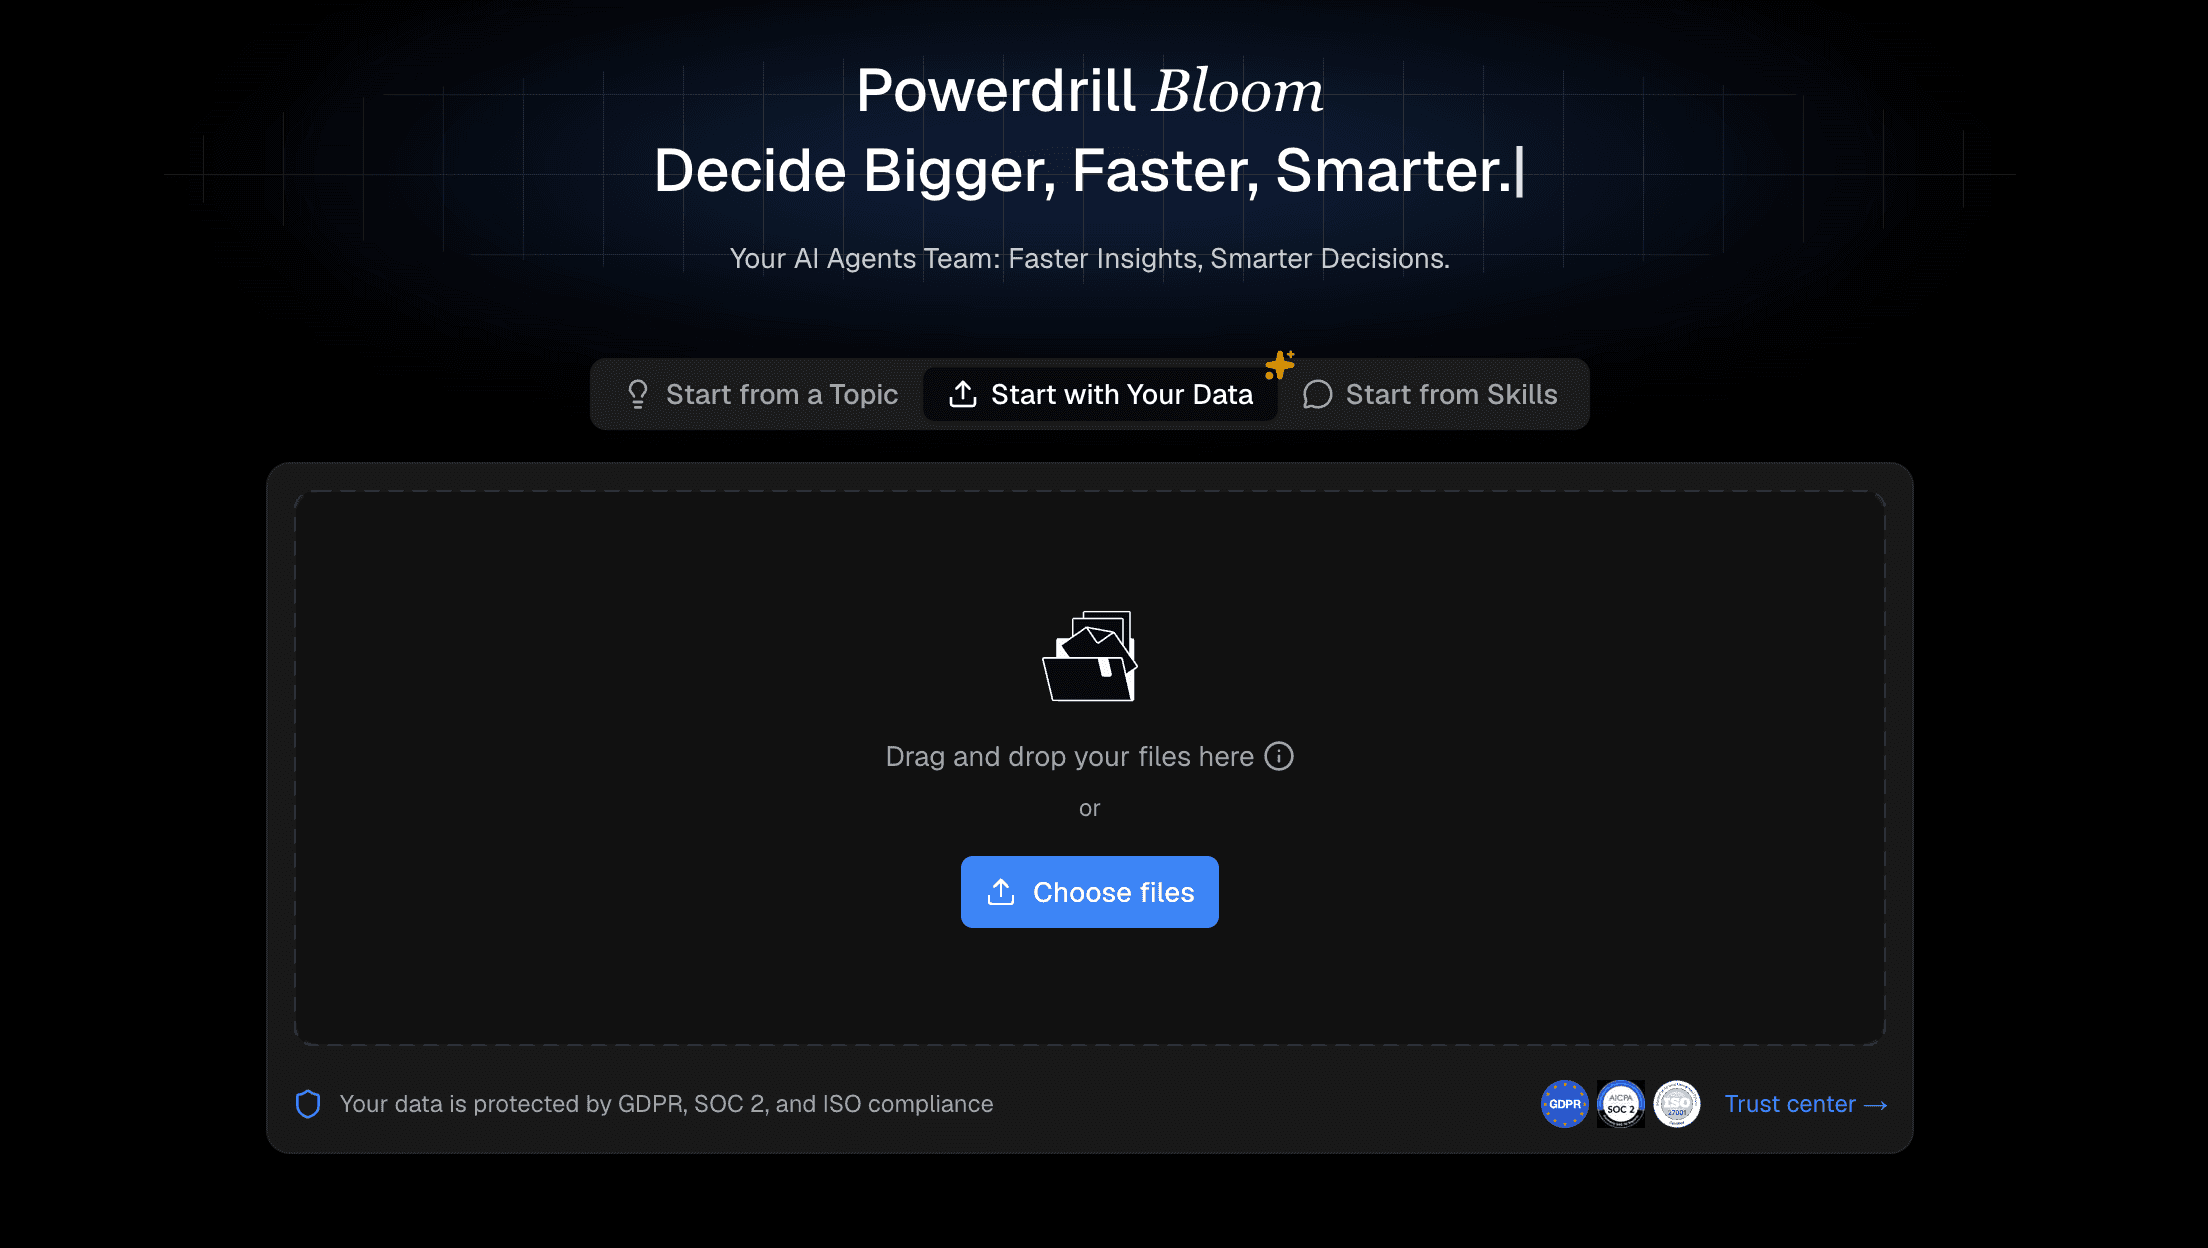
Step 1: Import Your Excel File
Begin by logging into your Powerdrill Bloom workspace. Take your raw data and simply drag and drop it into the interface. The AI engine instantly reads the file, categorizes your columns, and prepares the dataset for analysis securely in the cloud.
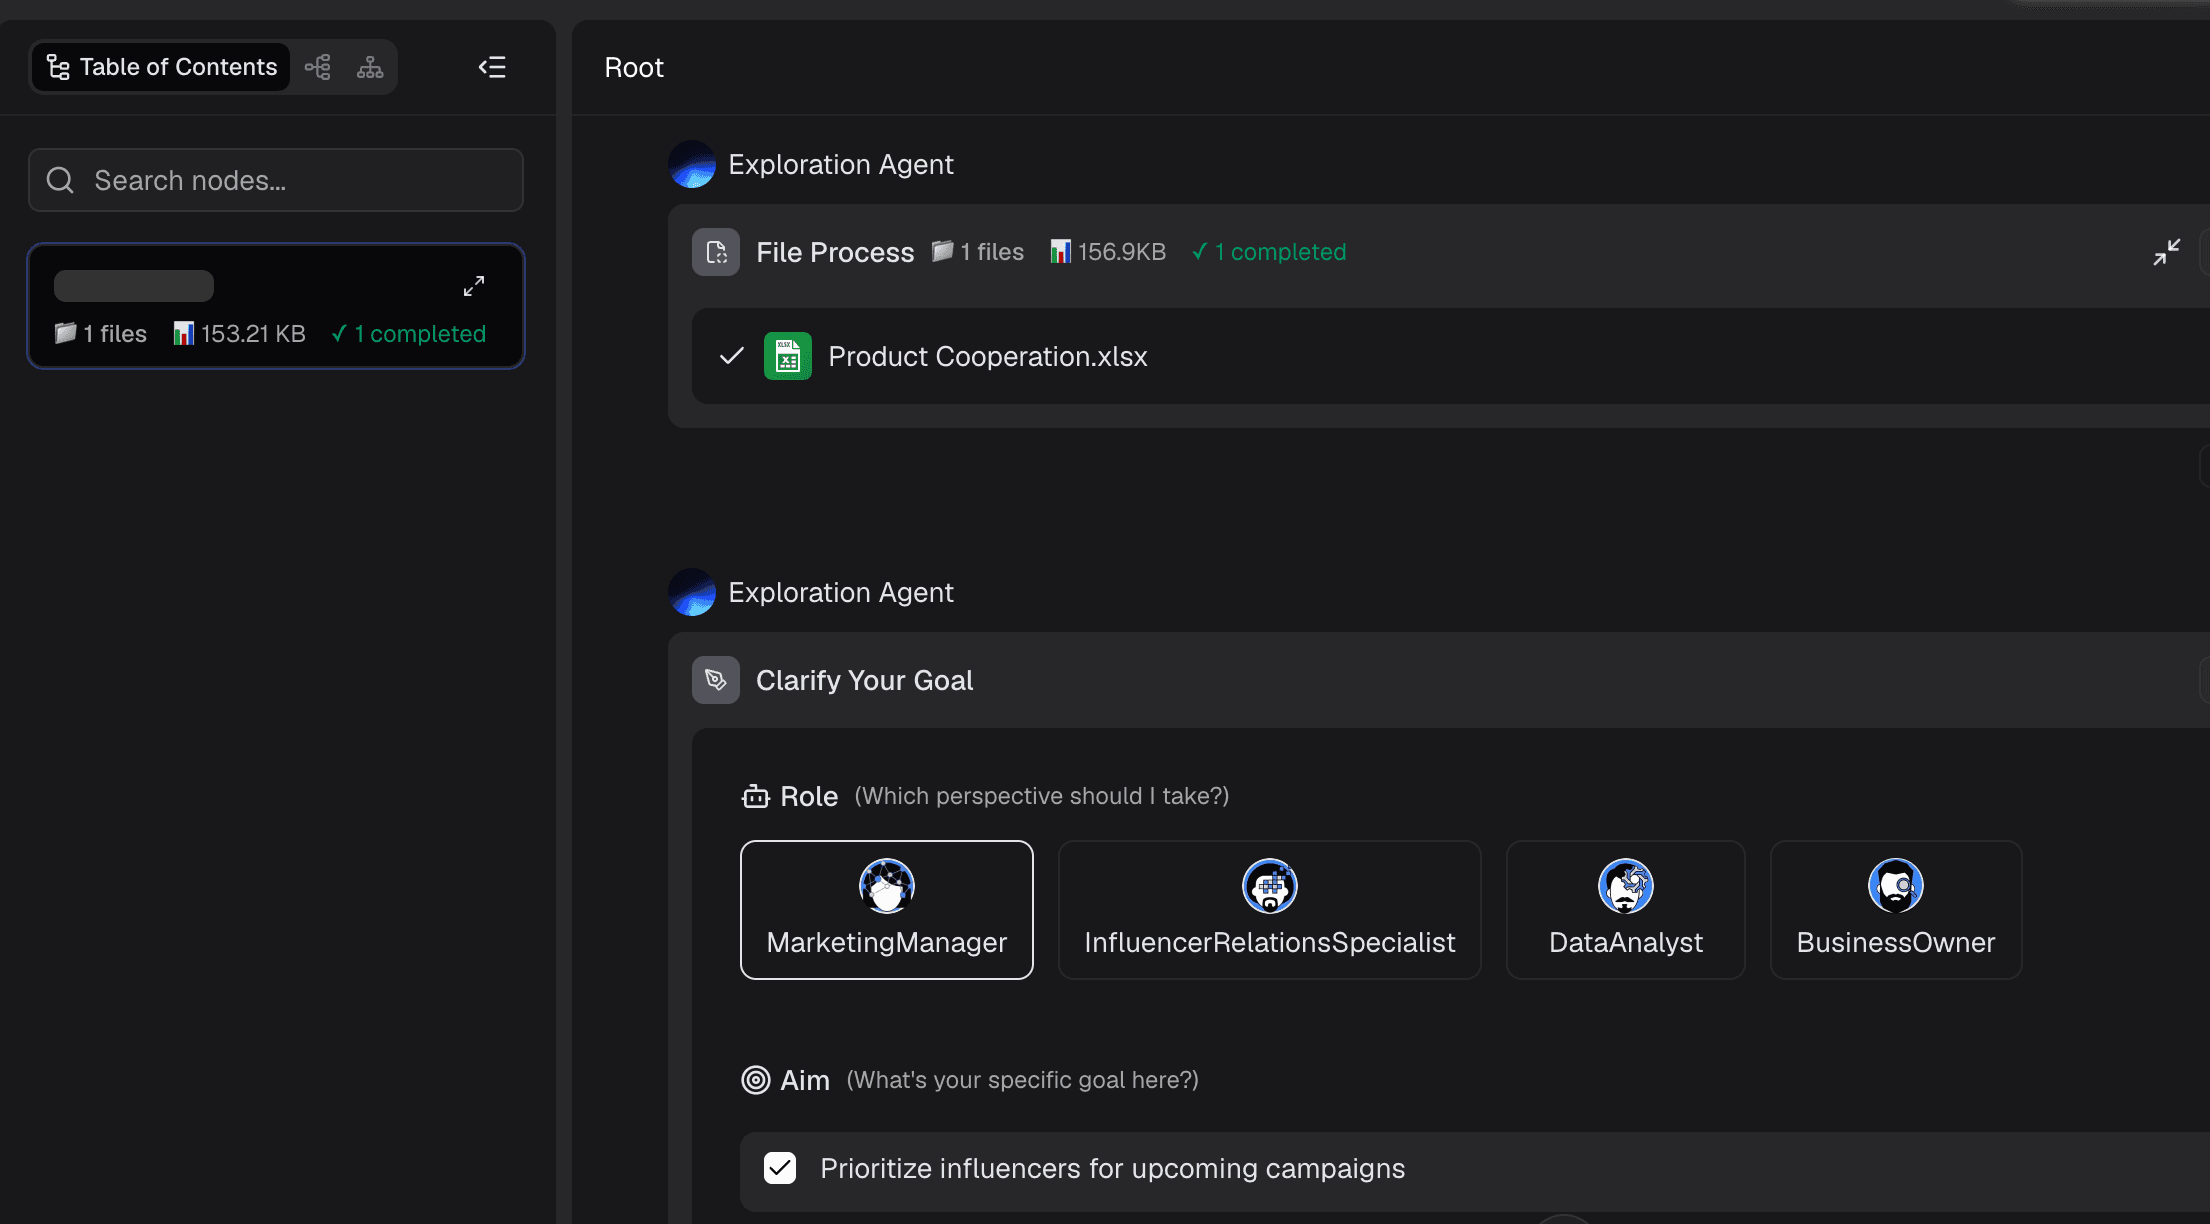
Step 2: Explore the Data
You do not need to figure out where to start. Once the data is uploaded, Powerdrill Bloom automatically scans the dataset and generates a preliminary data summary. It highlights key metrics, identifies missing values, and presents foundational statistics. This gives you an immediate bird's-eye view of your data's health and potential storylines.
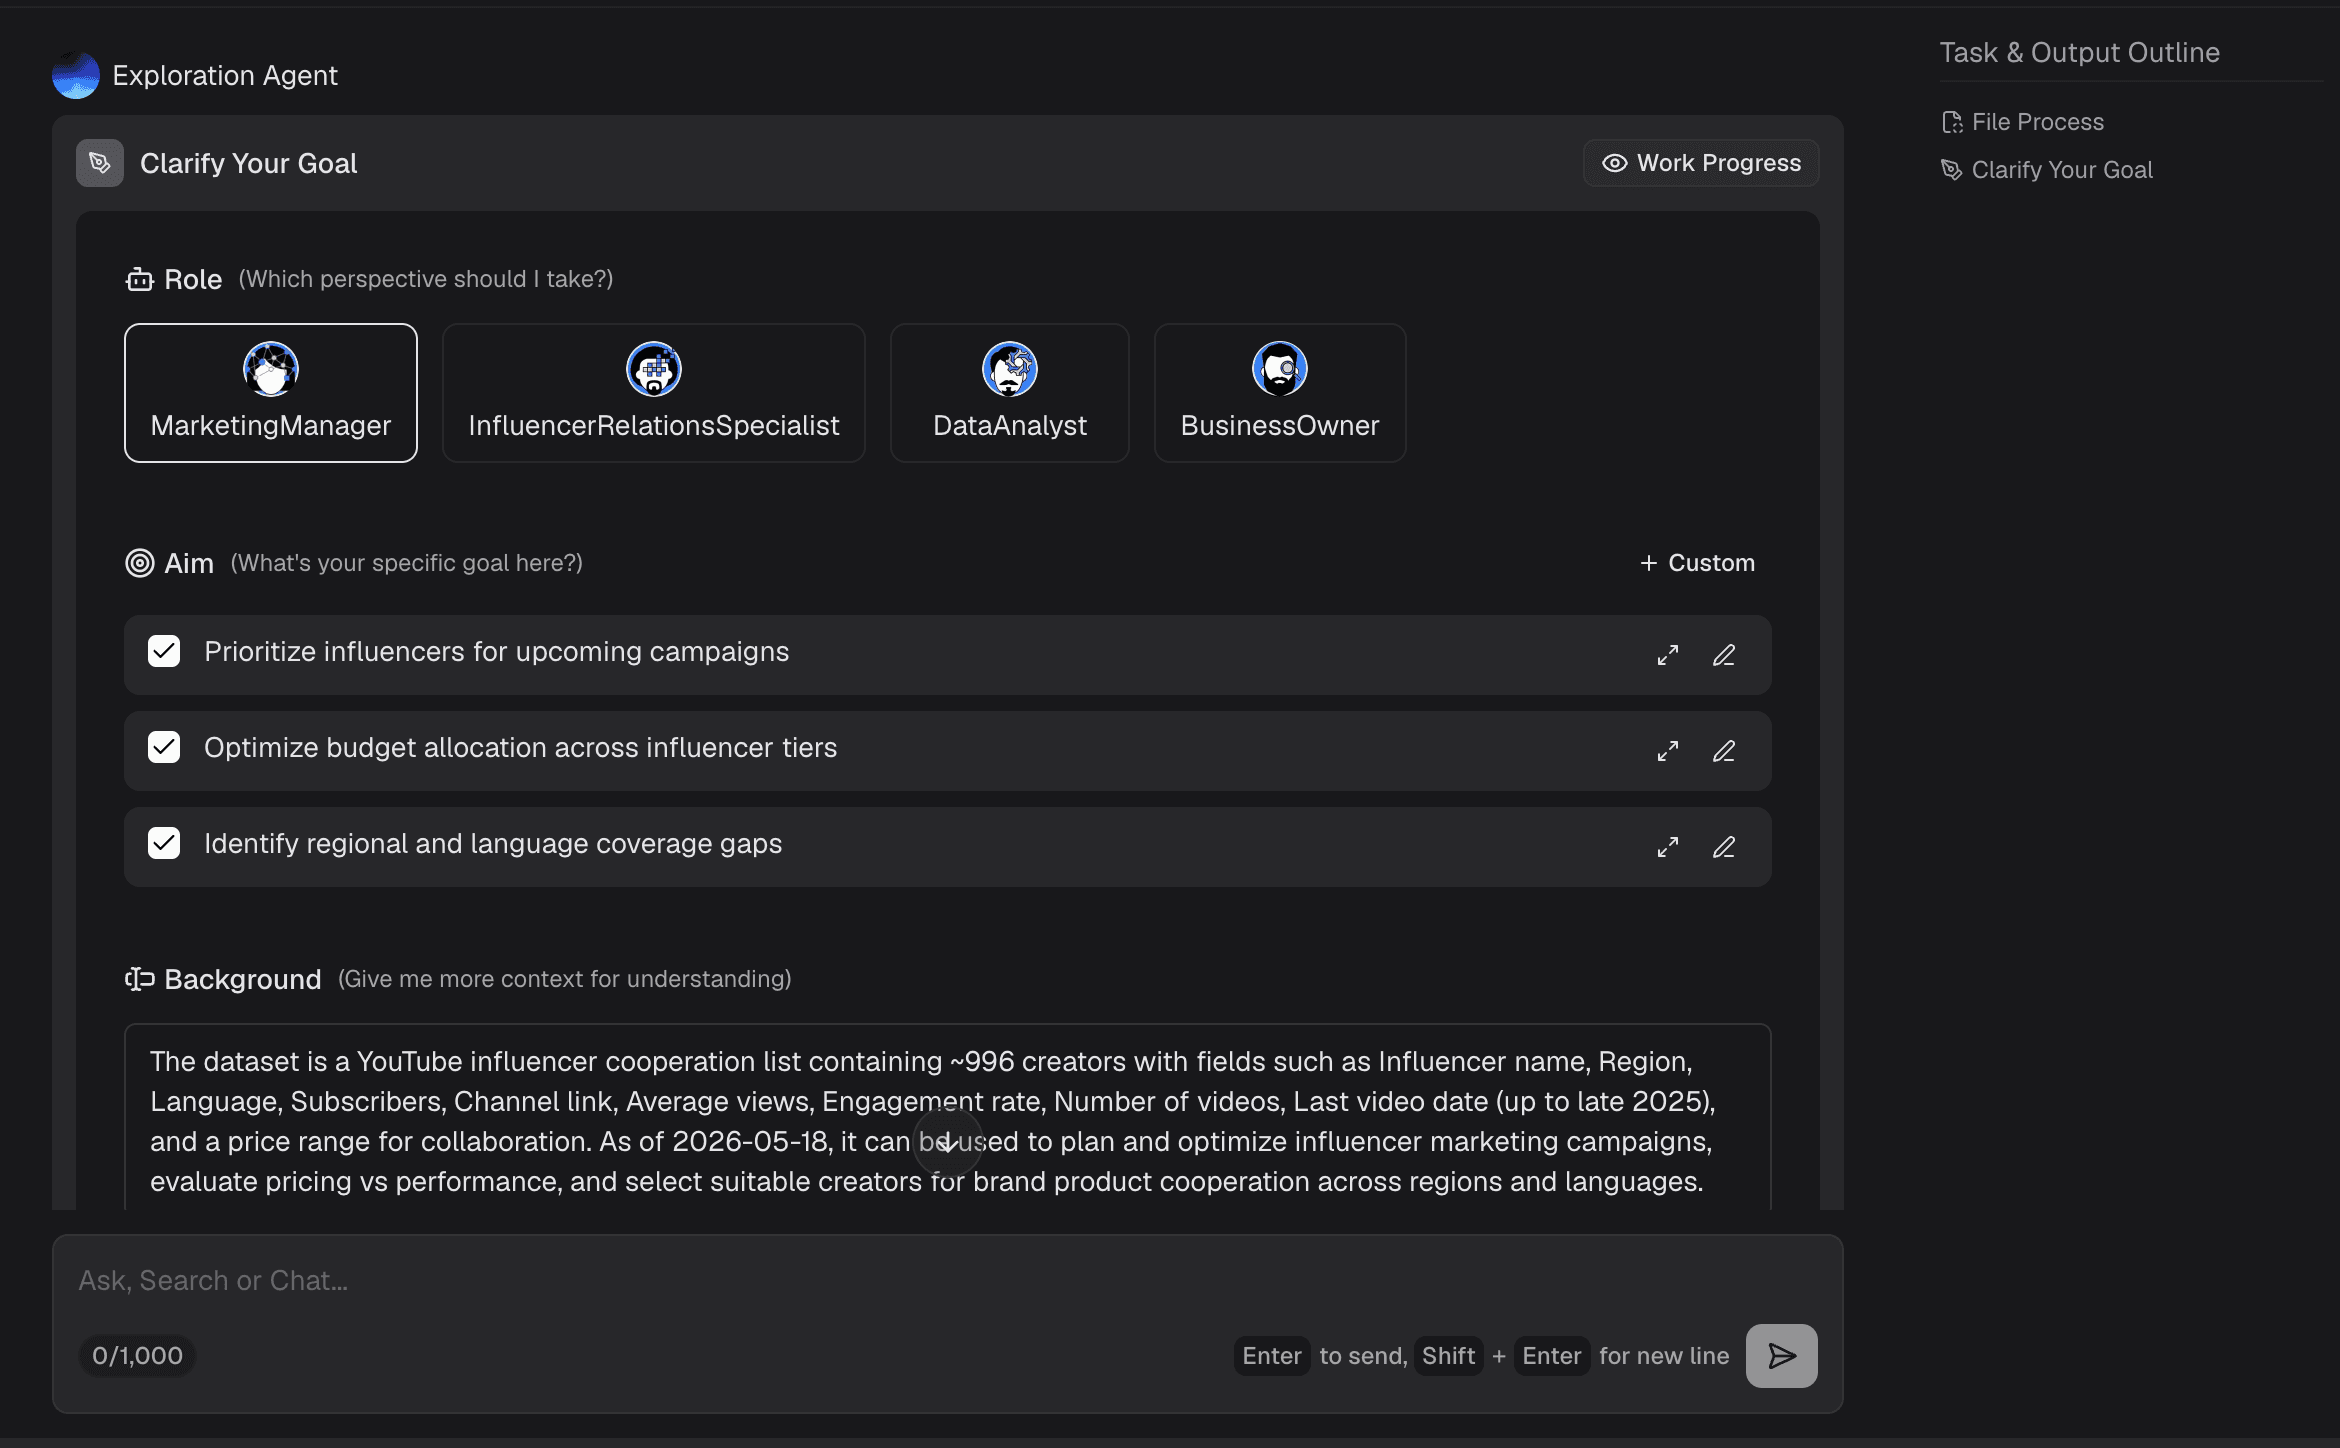
Step 3: Ask Questions Using Natural Language
This is where the magic happens. Instead of writing complex SQL queries or Excel formulas, just type your questions into the chatbox in plain language. For example, ask, "What were the top-selling product categories in Q3?" Powerdrill Bloom understands the context and processes the logical answer in seconds.
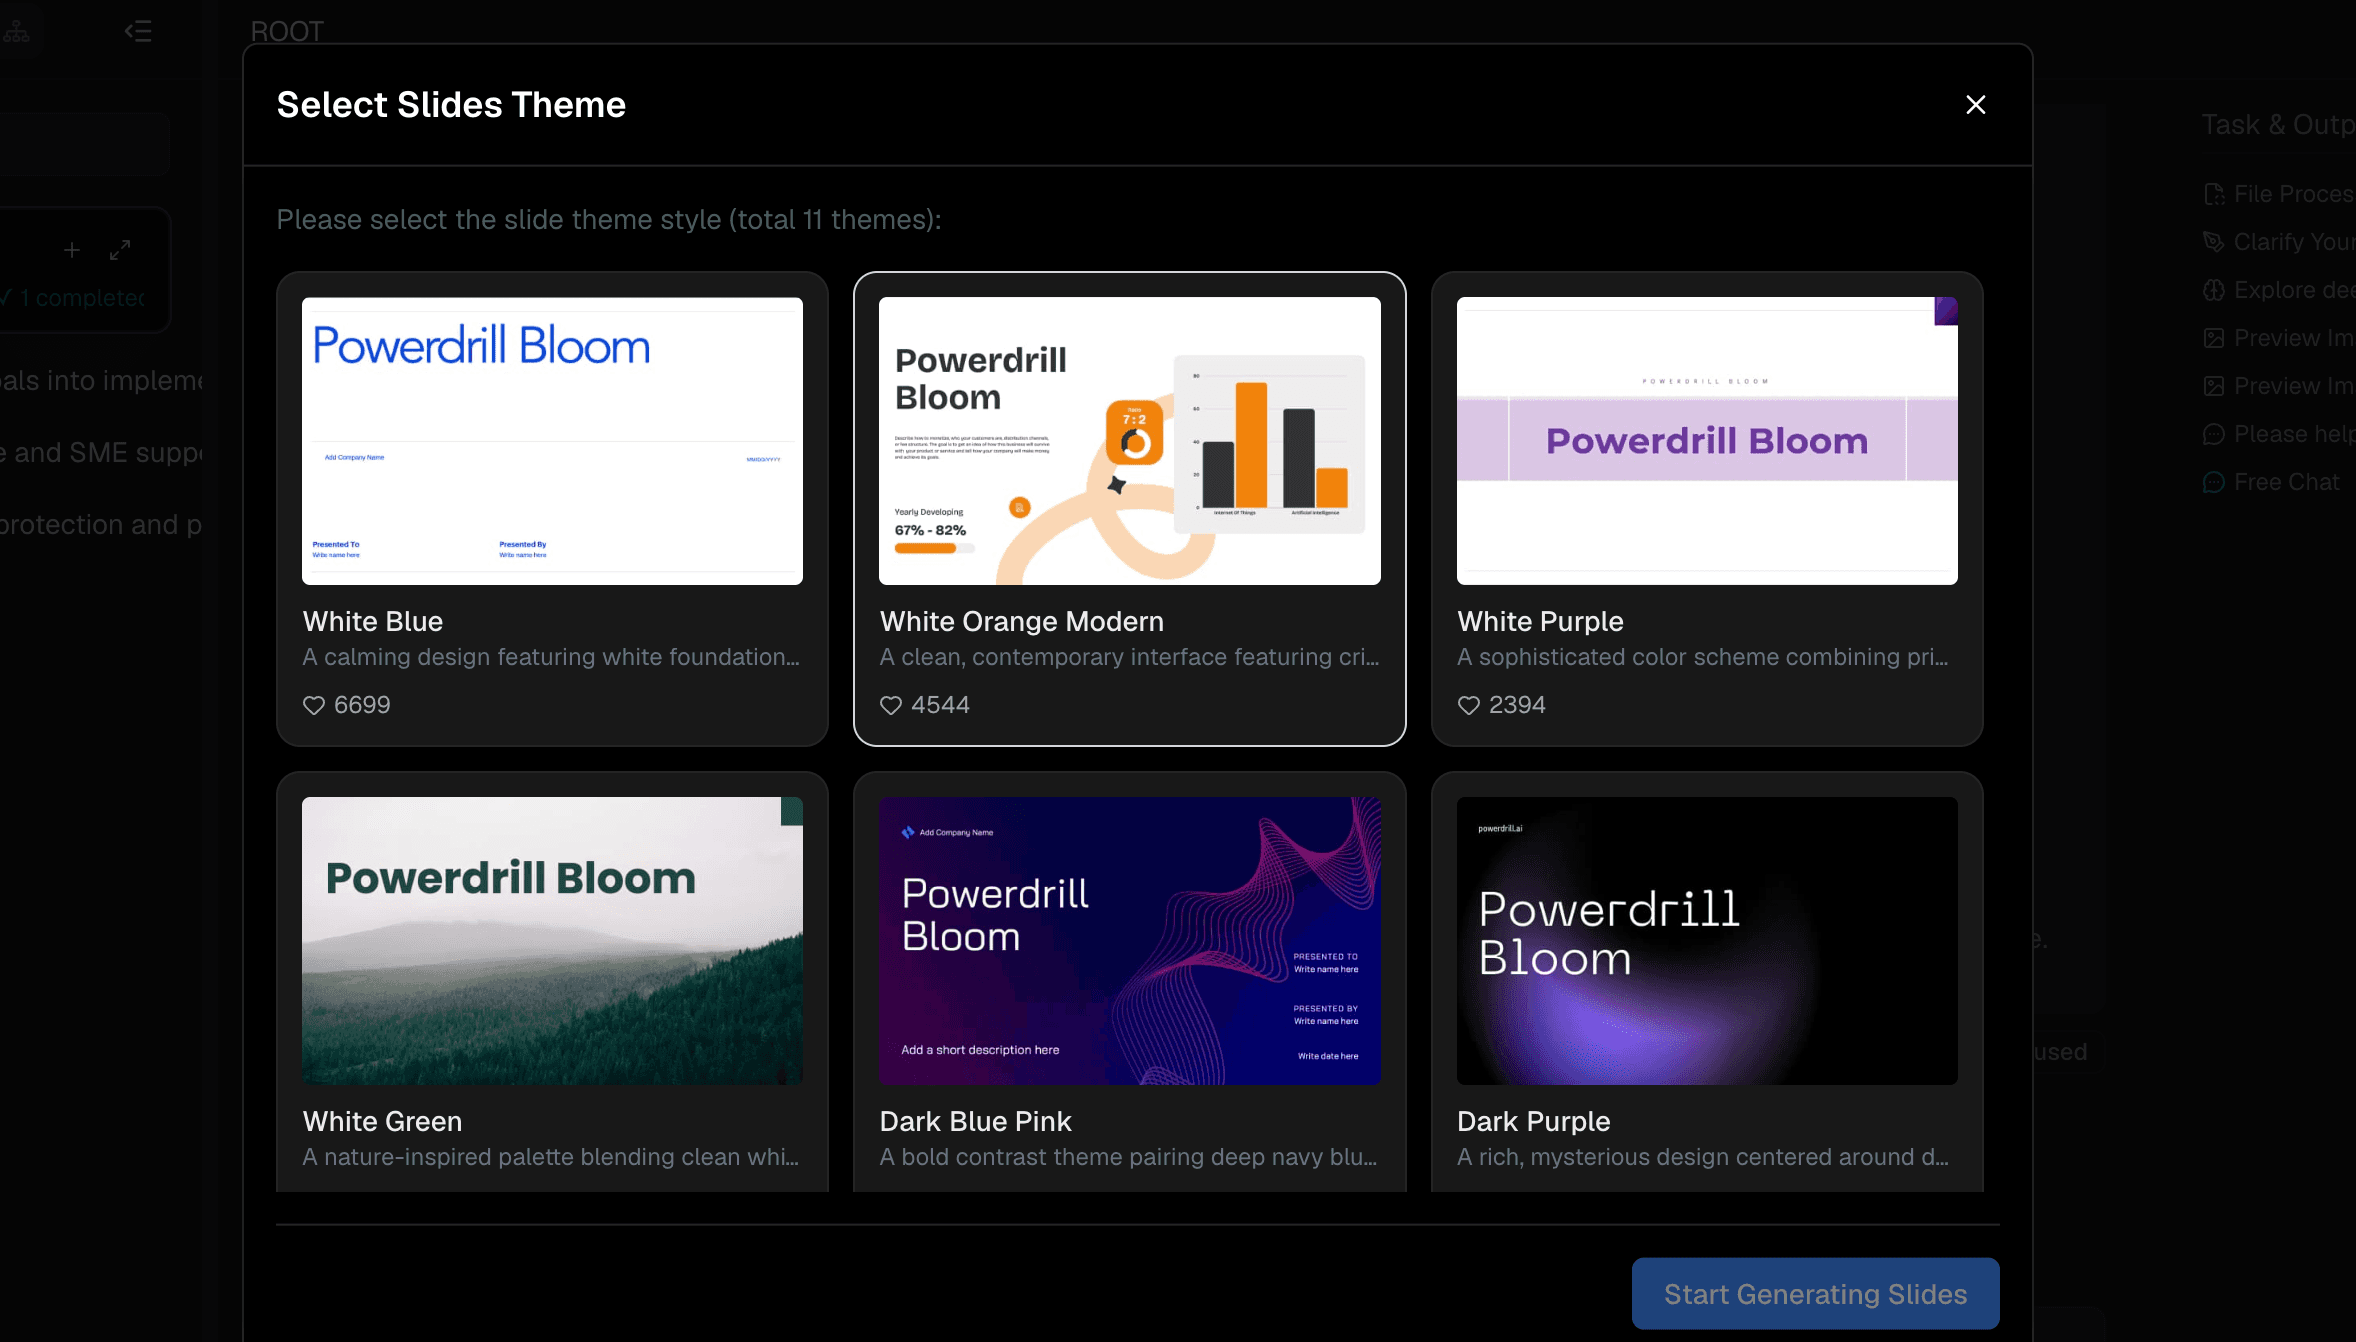
Step 4: Generate Charts and Insights
With your answers ready, instruct the AI to visualize them. Ask Bloom to "Create a bar chart for sales by region" or "Generate a pie chart for user demographics." The tool will instantly create stunning, accurate visuals alongside written analytical insights. Finally, compile these generated elements into a cohesive, exportable analysis report with just one click.
How to Choose the Best AI Analysis Report Tool
Selecting the right AI tool depends entirely on your specific needs, technical expertise, and budget. If you are a data scientist dealing with complex algorithms, a code-heavy platform like Julius AI might be ideal. For large corporations needing governed, multi-departmental dashboards, enterprise solutions like Qlik Sense or Zoho Analytics make sense. However, if you are a business professional, marketer, or manager looking for speed, accuracy, and an incredibly low barrier to entry, you should prioritize tools that focus on natural language processing and ease of use.
Conclusion
Writing an analysis report in 2026 is no longer a tedious chore. By leveraging artificial intelligence, you can unlock profound insights from your data in a fraction of the time it used to take. While there are many robust tools on the market, Powerdrill Bloom stands out as the absolute best choice for turning raw data into compelling stories without any coding. Don't let your data sit idle and try Powerdrill Bloom today and experience the future of effortless report writing!
FAQs
Is my data safe when using Powerdrill Bloom?
Yes, Powerdrill Bloom uses enterprise-grade encryption to ensure your uploaded data remains entirely private, secure, and confidential.
Do I need to know Python or SQL to use it?
Not at all. You simply type your questions in plain English, and the AI handles all the complex data processing.
Can Powerdrill Bloom handle large Excel files?
Absolutely. The platform is optimized to process millions of rows quickly, providing seamless, lag-free analysis for massive datasets.
Can I export the charts generated by Powerdrill Bloom?
Yes, all charts and written insights can be exported instantly as high-quality images or documents for your presentations.
Is Powerdrill Bloom suitable for complete beginners?
It is perfect for beginners. Its intuitive, chat-based interface makes professional data analysis accessible to absolutely anyone.