How to Turn a CSV File Into a Chart in 30 Seconds (2026 Guide)

Introduction
Staring at a CSV file full of endless rows and columns can be overwhelming. While data holds valuable insights, raw text files do very little to tell a compelling story. In the past, transforming this data into a visual format meant wrestling with complex Excel formulas, pivot tables, and clunky chart menus. Fortunately, nowadays, artificial intelligence has completely revolutionized data visualization.
Today, you can turn a tedious CSV file into a beautiful, insightful chart in under 30 seconds. In this guide, we will explore the best AI tools on the market and show you exactly how to visualize your data effortlessly.
Why Use AI to Turn CSV File into a Chart?
Using AI to convert your CSV files into charts comes with undeniable benefits. First is unprecedented speed; what used to take hours of formatting now takes seconds. Second, AI eliminates the learning curve. You no longer need to be a data scientist or a spreadsheet wizard to extract insights.
By utilizing Natural Language Processing (NLP), AI allows you to simply type what you want to see, like "show me sales by region", and it instantly does the heavy lifting. Finally, AI often catches trends and anomalies you might have missed, acting as an automated data analyst right at your fingertips.
What Are the Best AI Tools to Turn CSV File into a Chart?
1. Powerdrill Bloom
Powerdrill Bloom is a cutting-edge, AI-native data analysis platform designed to bridge the gap between raw data and actionable insights instantly.
Key Features: Chat-to-chart functionality, intelligent data cleaning, automated trend spotting, and one-click interactive dashboards.
Pros: Incredibly intuitive with zero learning curve. It processes data blazing fast and generates highly accurate, customizable charts using conversational language.
Cons: As a cloud-based web application, it requires an active internet connection to process files.
Pricing: Offers a generous free tier for everyday users, with premium plans start around $13.27/month.
2. Julius AI
Julius AI is a powerful computational AI that acts as a virtual data analyst, utilizing Python behind the scenes to analyze and visualize data.
Key Features: Code interpreter capabilities, advanced statistical modeling, and exportable Python code.
Pros: Excellent for users who need complex mathematical analysis and deep data manipulation.
Cons: The interface and output can feel a bit overly technical for average users who just want a quick chart.
Pricing: Free basic plan with limited messages; paid plans start around $16/month.
3. Beautiful AI
Beautiful AI is primarily an AI presentation maker that uses smart templates to automatically design slides and basic charts.
Key Features: Auto-formatting, stunning visual templates, and seamless slide integration.
Pros: Creates incredibly visually appealing, presentation-ready charts with great design aesthetics.
Cons: It lacks deep data analytics capabilities. It is not designed to process massive, complex CSV datasets.
Pricing: Premium plans start at $12/month.
4. SheetAI
SheetAI is a convenient add-on that brings AI language models directly into your Google Sheets workspace.
Key Features: Custom AI spreadsheet formulas, automated text generation, and basic data formatting.
Pros: Highly convenient because you don't have to leave your existing Google Sheets environment.
Cons: Chart generation is quite basic and remains limited by Google Sheets' native charting capabilities.
Pricing: Free basic tier; premium plans start at $20/month.
5. Dataiku
Dataiku is an enterprise-level platform built for everyday AI, machine learning, and advanced data pipelines.
Key Features: Predictive analytics, collaborative data workflows, and big data processing.
Pros: Incredibly powerful, highly scalable, and perfect for massive enterprise datasets.
Cons: It has a very steep learning curve and is completely overkill if you just want to turn a CSV into a chart quickly.
Pricing: Starts at $15/user month.
How to Turn CSV File into a Chart Using AI: Step-by-Step Guide (Using Powerdrill Bloom as an Example)
Generating a chart shouldn't be a headache. Here is how you can do it in under 30 seconds using Powerdrill Bloom:
1. Upload Excel/CSV File
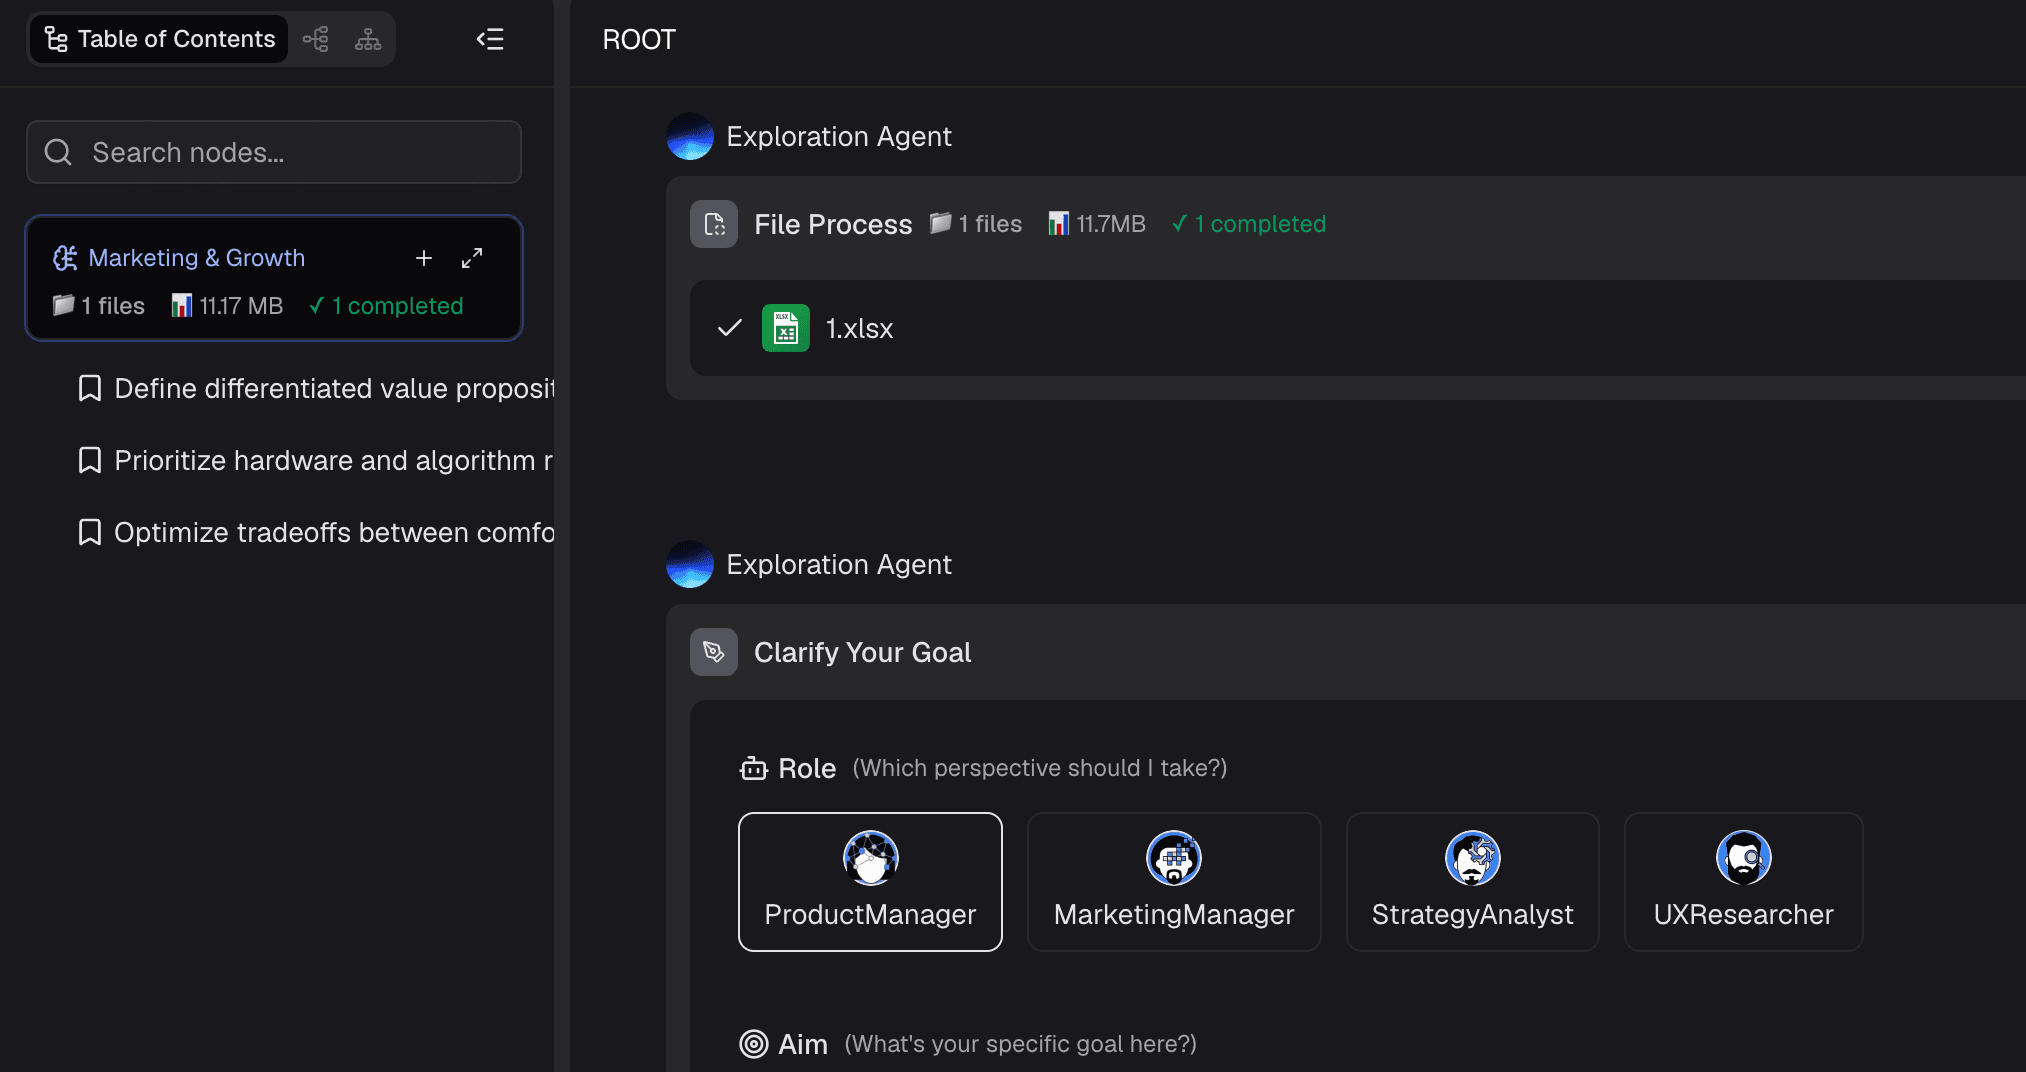
Simply log into your Powerdrill Bloom workspace and drag-and-drop your CSV file into the upload box. The AI will instantly read, parse, and structure your data, no matter how many rows you have.

2. Prompt the AI for Insights
Once uploaded, Powerdrill Bloom will scan the data and automatically suggest several potential insights and chart ideas. You can click on these smart suggestions to instantly see the visual breakdown of your CSV.
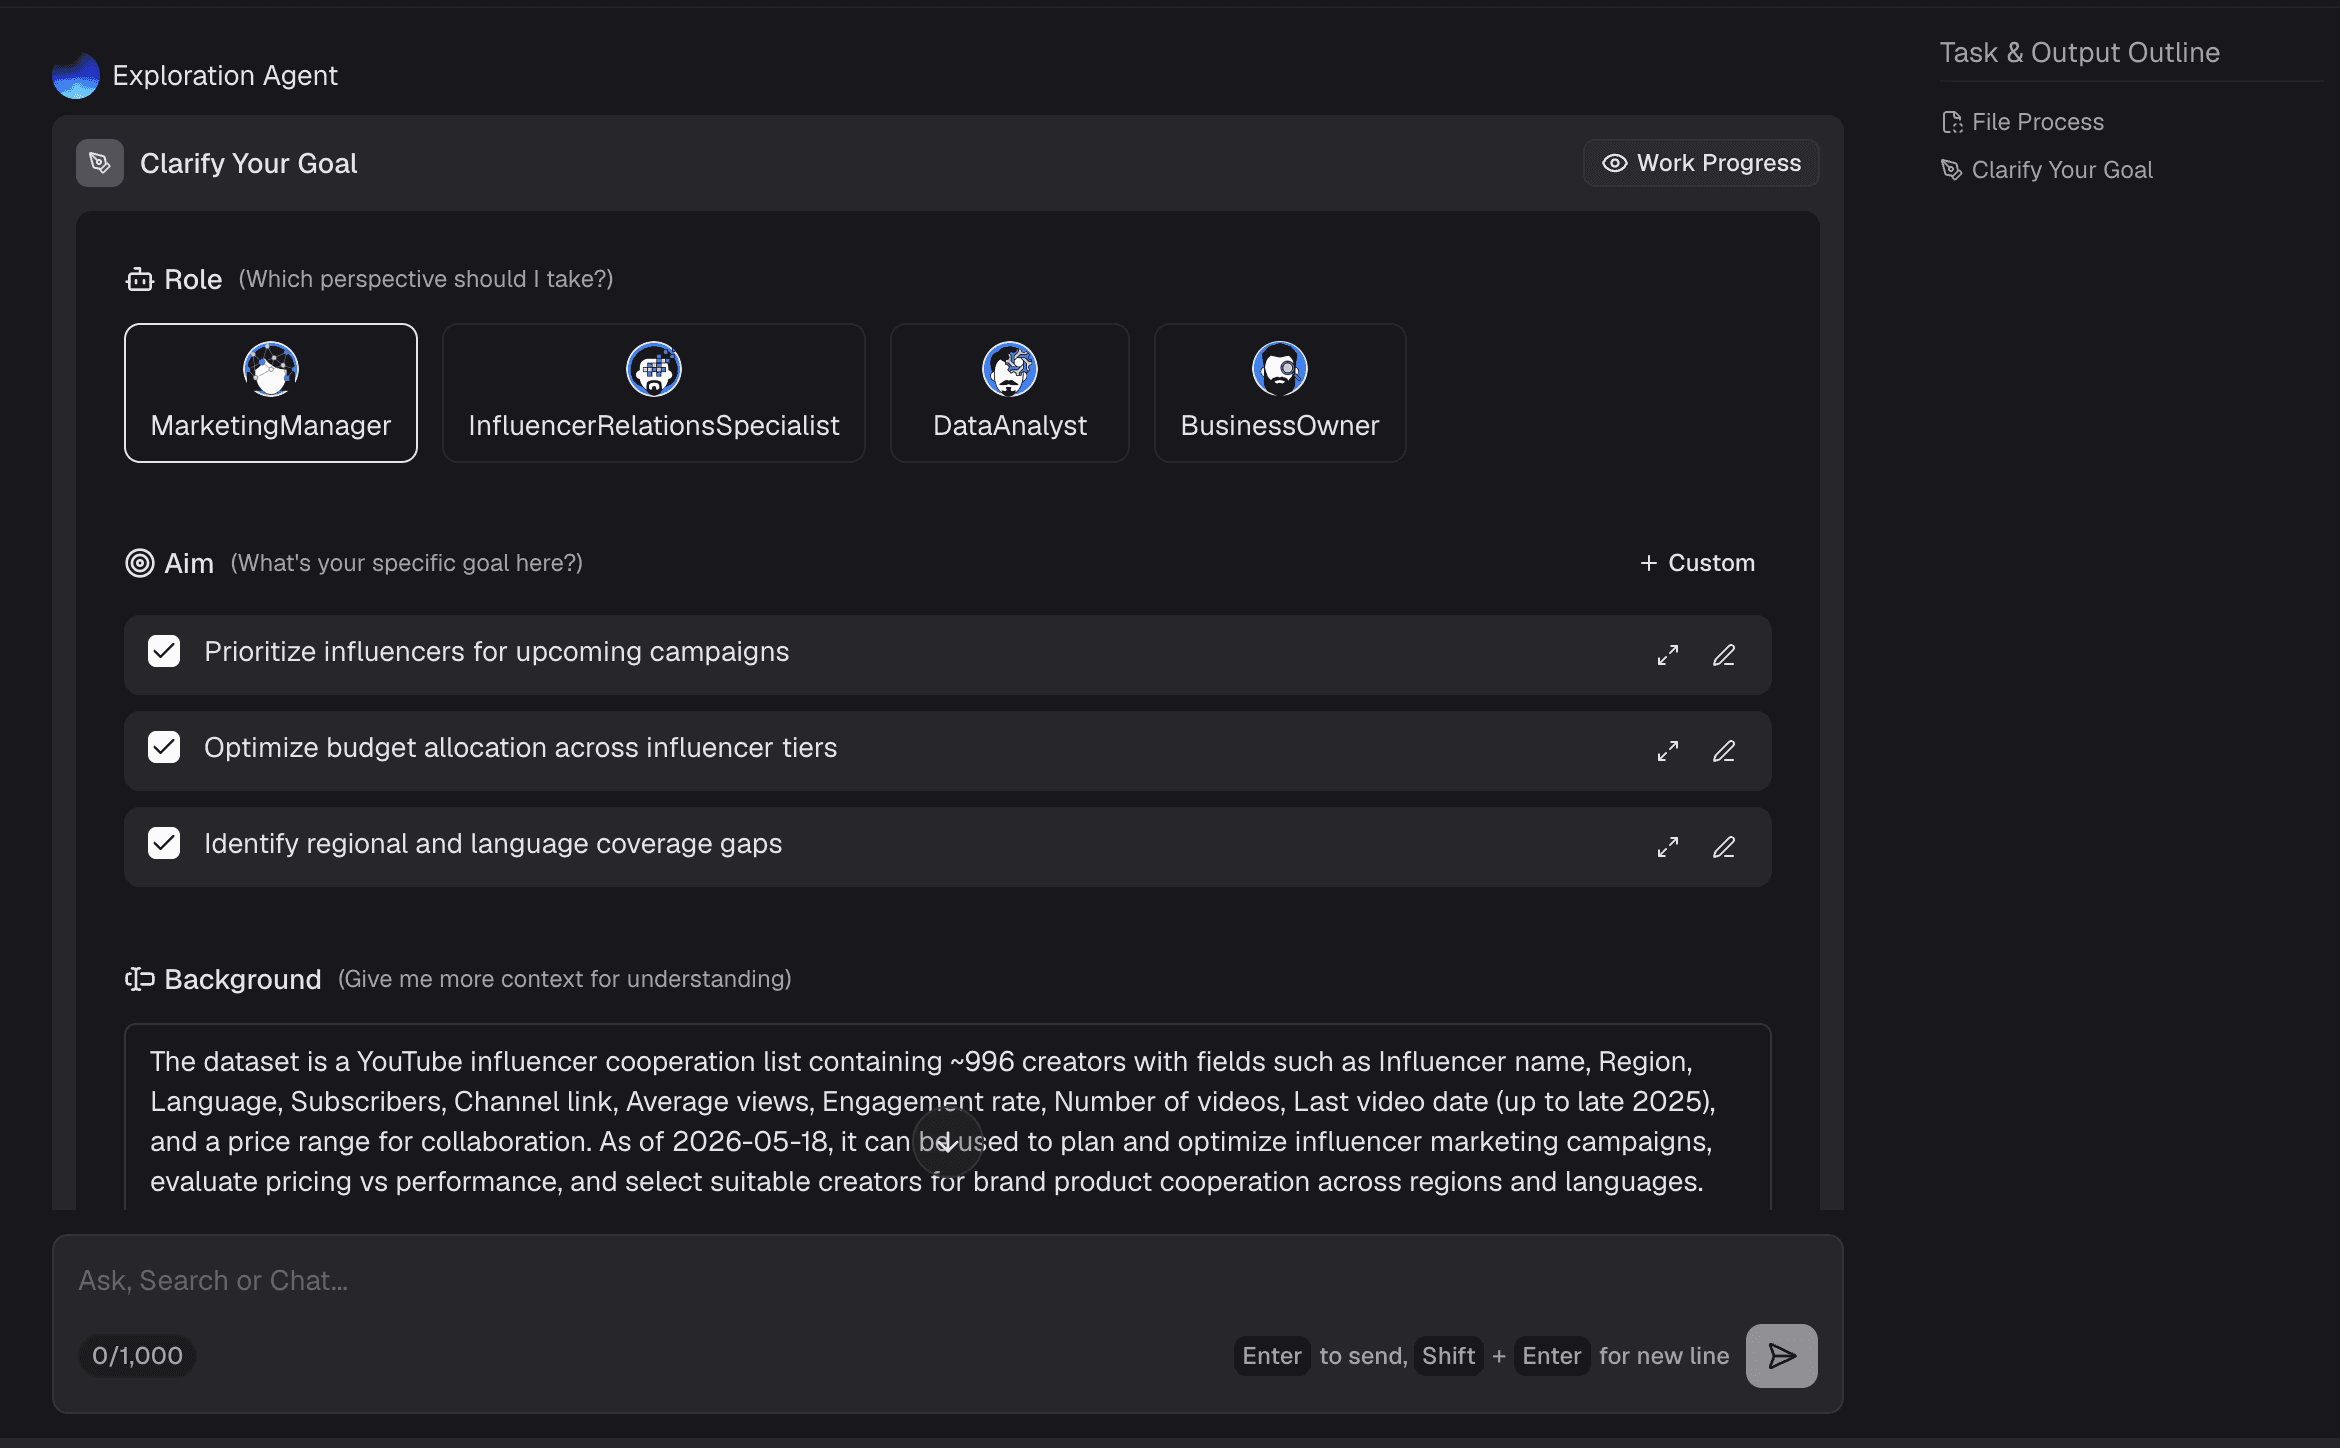
3. Ask Questions in Natural Language
Want something specific? Just ask! Type a prompt like, "Create a bar chart showing our global market growth in 2026." The AI understands natural human language and will instantly generate the exact visualization you requested.
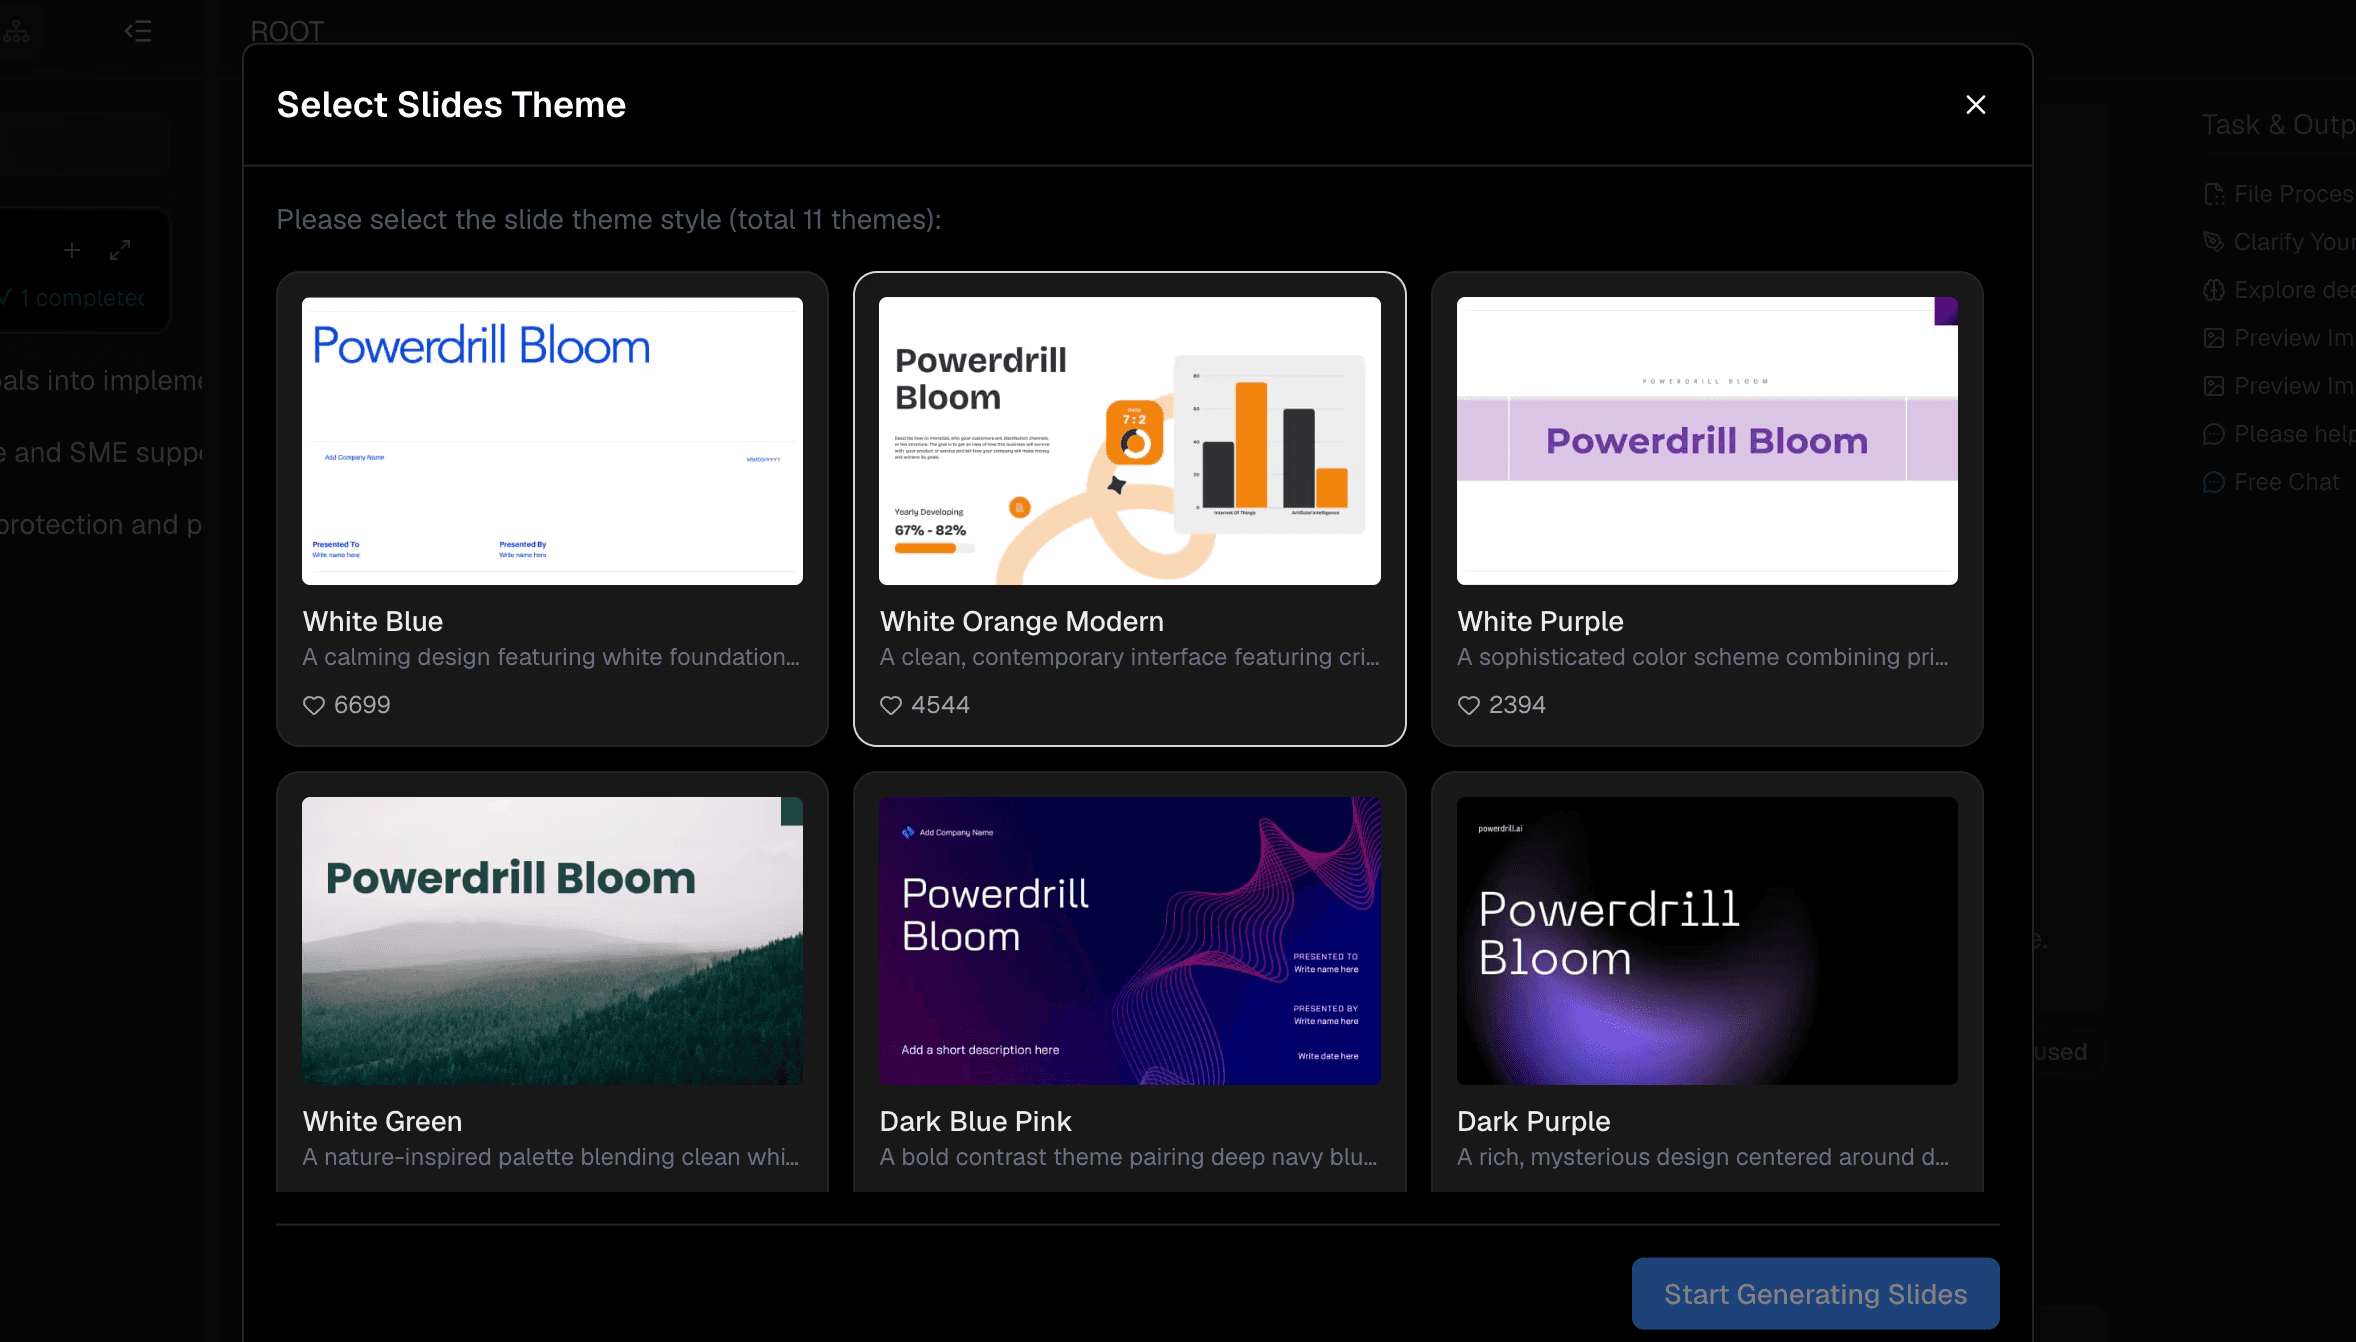
4. Generate and Export in One-click
Once your chart appears, you can customize colors or labels. When you are happy with the result, simply click the export button to download your chart as an image or embed it directly into your next report.
How to Choose the Best AI Tool for Turning a CSV File Into a Chart
Choosing the right tool depends entirely on your specific needs. If you are building a slide deck and need aesthetic templates, Beautiful AI is a solid choice. If you are a data scientist running advanced Python models, you might prefer Julius AI. For massive, corporate-level machine learning pipelines, Dataiku is the standard.
However, if you are looking for the absolute best all-rounder that balances speed, accuracy, and ease of use, Powerdrill Bloom stands out from the crowd. It strips away the complexity of data science, allowing anyone to upload a CSV and get professional-grade charts in seconds using plain English.
Conclusion
Turning a messy CSV file into a beautiful, easy-to-read chart is no longer a tedious chore. Thanks to AI, anyone can become a data visualization expert in 2026. Stop wasting hours wrestling with spreadsheet formulas. Experience the future of instant data visualization and let the AI do the heavy lifting for you. Ready to transform your data in 30 seconds? Try Powerdrill Bloom today and watch your raw data bloom into actionable insights.
FAQs
How fast can Powerdrill Bloom process my CSV file?
Powerdrill Bloom processes your CSV files almost instantly, allowing you to generate stunning charts in under 30 seconds.
Do I need coding skills to use Powerdrill Bloom?
No coding is required! Powerdrill Bloom uses natural language processing, so you simply ask questions to create your charts.
Can Powerdrill Bloom handle large datasets effectively?
Absolutely. Powerdrill Bloom is built to effortlessly parse and visualize extensive CSV files without lagging or compromising accuracy.
How secure is my data on Powerdrill Bloom?
Powerdrill Bloom prioritizes your privacy with enterprise-grade encryption, ensuring your uploaded CSV files remain strictly confidential and secure.
Can I export charts created in Powerdrill Bloom?
Yes! Powerdrill Bloom allows you to instantly export your generated charts with one click for your presentations or reports.