How to Create Stunning Infographics From PDF Data in 2026

Introduction
In 2026, we are swimming in a sea of digital information, yet we still find our most valuable data trapped inside flat, uninspiring PDF documents. Whether you are decoding a 50-page market analysis or a dense financial whitepaper, extracting numbers manually is a thing of the past.
Today's audiences demand visual storytelling. They want rapid, easily digestible insights, making the ability to create stunning infographics from PDF data the ultimate way to capture their attention. But bridging the gap between a static document and a beautiful visualization used to require a team of analysts and graphic designers. That is where Powerdrill Bloom comes in. As the leading AI-driven data storytelling platform of the year, it is completely redefining how we interact with files.
In this blog, we will show you exactly why legacy tools are holding you back and how you can effortlessly turn raw PDF data into breathtaking infographics using Powerdrill Bloom.
Why Traditional PDF Data Extraction Still Fails
Even in 2026, many organizations struggle with legacy tools that promise seamless PDF data extraction but ultimately fail to deliver. Here is exactly why the old ways of doing things are holding your data storytelling back.
The Menace of Unstructured Data
PDFs are notoriously rigid documents because they were originally designed for print formatting, not for dynamic data extraction. Traditional copy-pasting or basic OCR (Optical Character Recognition) tools often scramble unstructured data, turning neat tables into a chaotic mess of overlapping text. Analysts end up spending hours manually cleaning and reformatting data rather than actually analyzing it. This glaring inefficiency kills workplace productivity and delays critical reporting timelines.
Lack of Contextual Understanding
Legacy software treats text as just a random string of characters. It completely fails to understand the logical relationship between the raw numbers in a financial chart and the explanatory paragraph located right beneath it. When you rely on outdated extraction tools, you lose the vital context needed to create accurate, meaningful infographics. Without intelligent AI to connect the conceptual dots, your data visualizations run a high risk of being misleading, disjointed, or fundamentally incomplete.
Tedious App-Switching Workflows
In the past, converting a standard PDF into a beautiful infographic required a clunky, multi-app workflow. You needed a dedicated reader to open the PDF file, a separate scraping tool to pull the numbers, a spreadsheet application to organize the messy data, and finally a complex design software to build the infographic. This highly fragmented process is not only incredibly time-consuming but also creates multiple friction points where costly human errors can easily be introduced into your final design.
Powerdrill Bloom: The Future of AI-Driven Data Storytelling
To overcome the crippling limitations of the past, modern professionals need sophisticated, modern solutions. Powerdrill Bloom represents the bleeding edge of AI-driven data storytelling, fundamentally transforming how we interact with static documents today.
Seamless AI Integration for Deep Extraction
Powerdrill Bloom doesn’t just blindly read your uploaded PDF; it genuinely comprehends it. Powered by advanced large language models uniquely optimized for 2026, the platform easily parses through dense corporate reports, complex financial tables, and messy unstructured text to find exactly what you need. It intuitively extracts the most important key statistics and insights, completely eliminating the manual copy-paste nightmare that data analysts used to dread every single week.
Automated Contextual Data Visualization
What truly sets Powerdrill Bloom apart from the competition is its unparalleled ability to understand the actual narrative behind your data. Once the target data is extracted, the AI proactively suggests the most impactful way to present it. Whether your specific dataset calls for a dynamic pie chart, a complex scatter plot, or a sequential timeline infographic, Powerdrill Bloom’s visualization engine maps the extracted data to the perfect visual format completely automatically.
An All-In-One Creative Ecosystem
Say goodbye to juggling five different expensive software subscriptions just to get your point across. Powerdrill Bloom seamlessly consolidates the entire creation pipeline into one incredibly intuitive dashboard. From the exact moment you upload your static PDF to the final download of your beautiful, shareable infographic, absolutely everything happens in one centralized place. It drastically streamlines your workflow, saving you countless hours and significantly boosting your daily creative output.
Step by Step Guide: Transforming Raw PDFs into Stunning Infographics
Creating visually striking infographics from dense PDF data is easier and faster than ever before. Follow these four simple steps to turn your standard reports into compelling visual art.
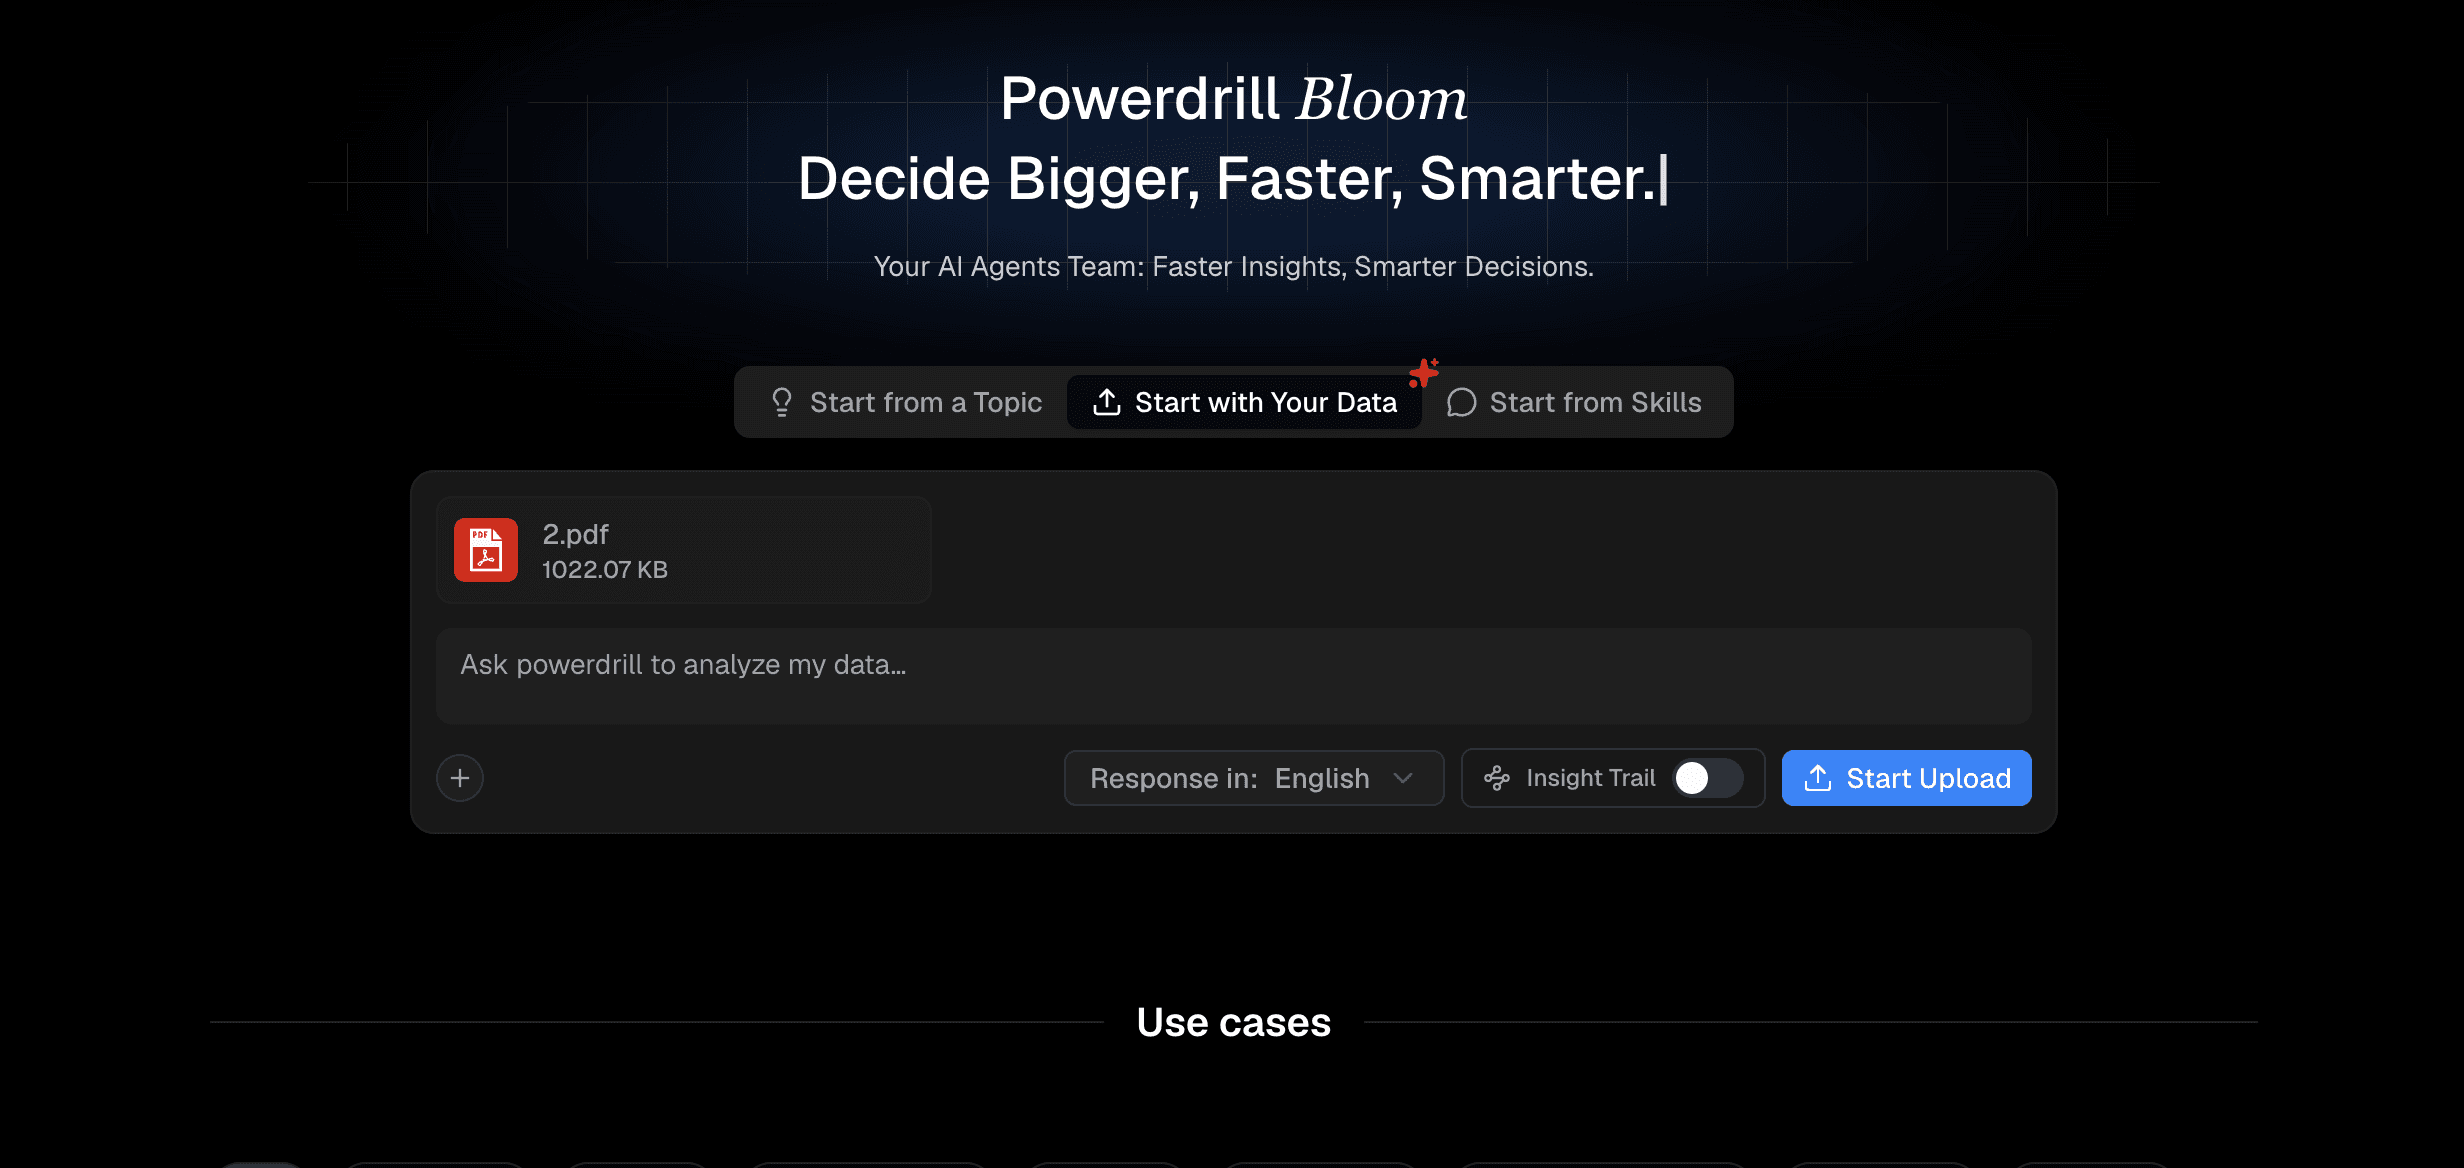
Step 1: Upload Files
Start your creative journey by logging into your secure Powerdrill Bloom dashboard. Simply drag and drop your target PDFs directly into the upload area. The robust system effortlessly handles large files and massive multi-page documents with incredible speed, preparing them for deep AI analysis almost instantly.
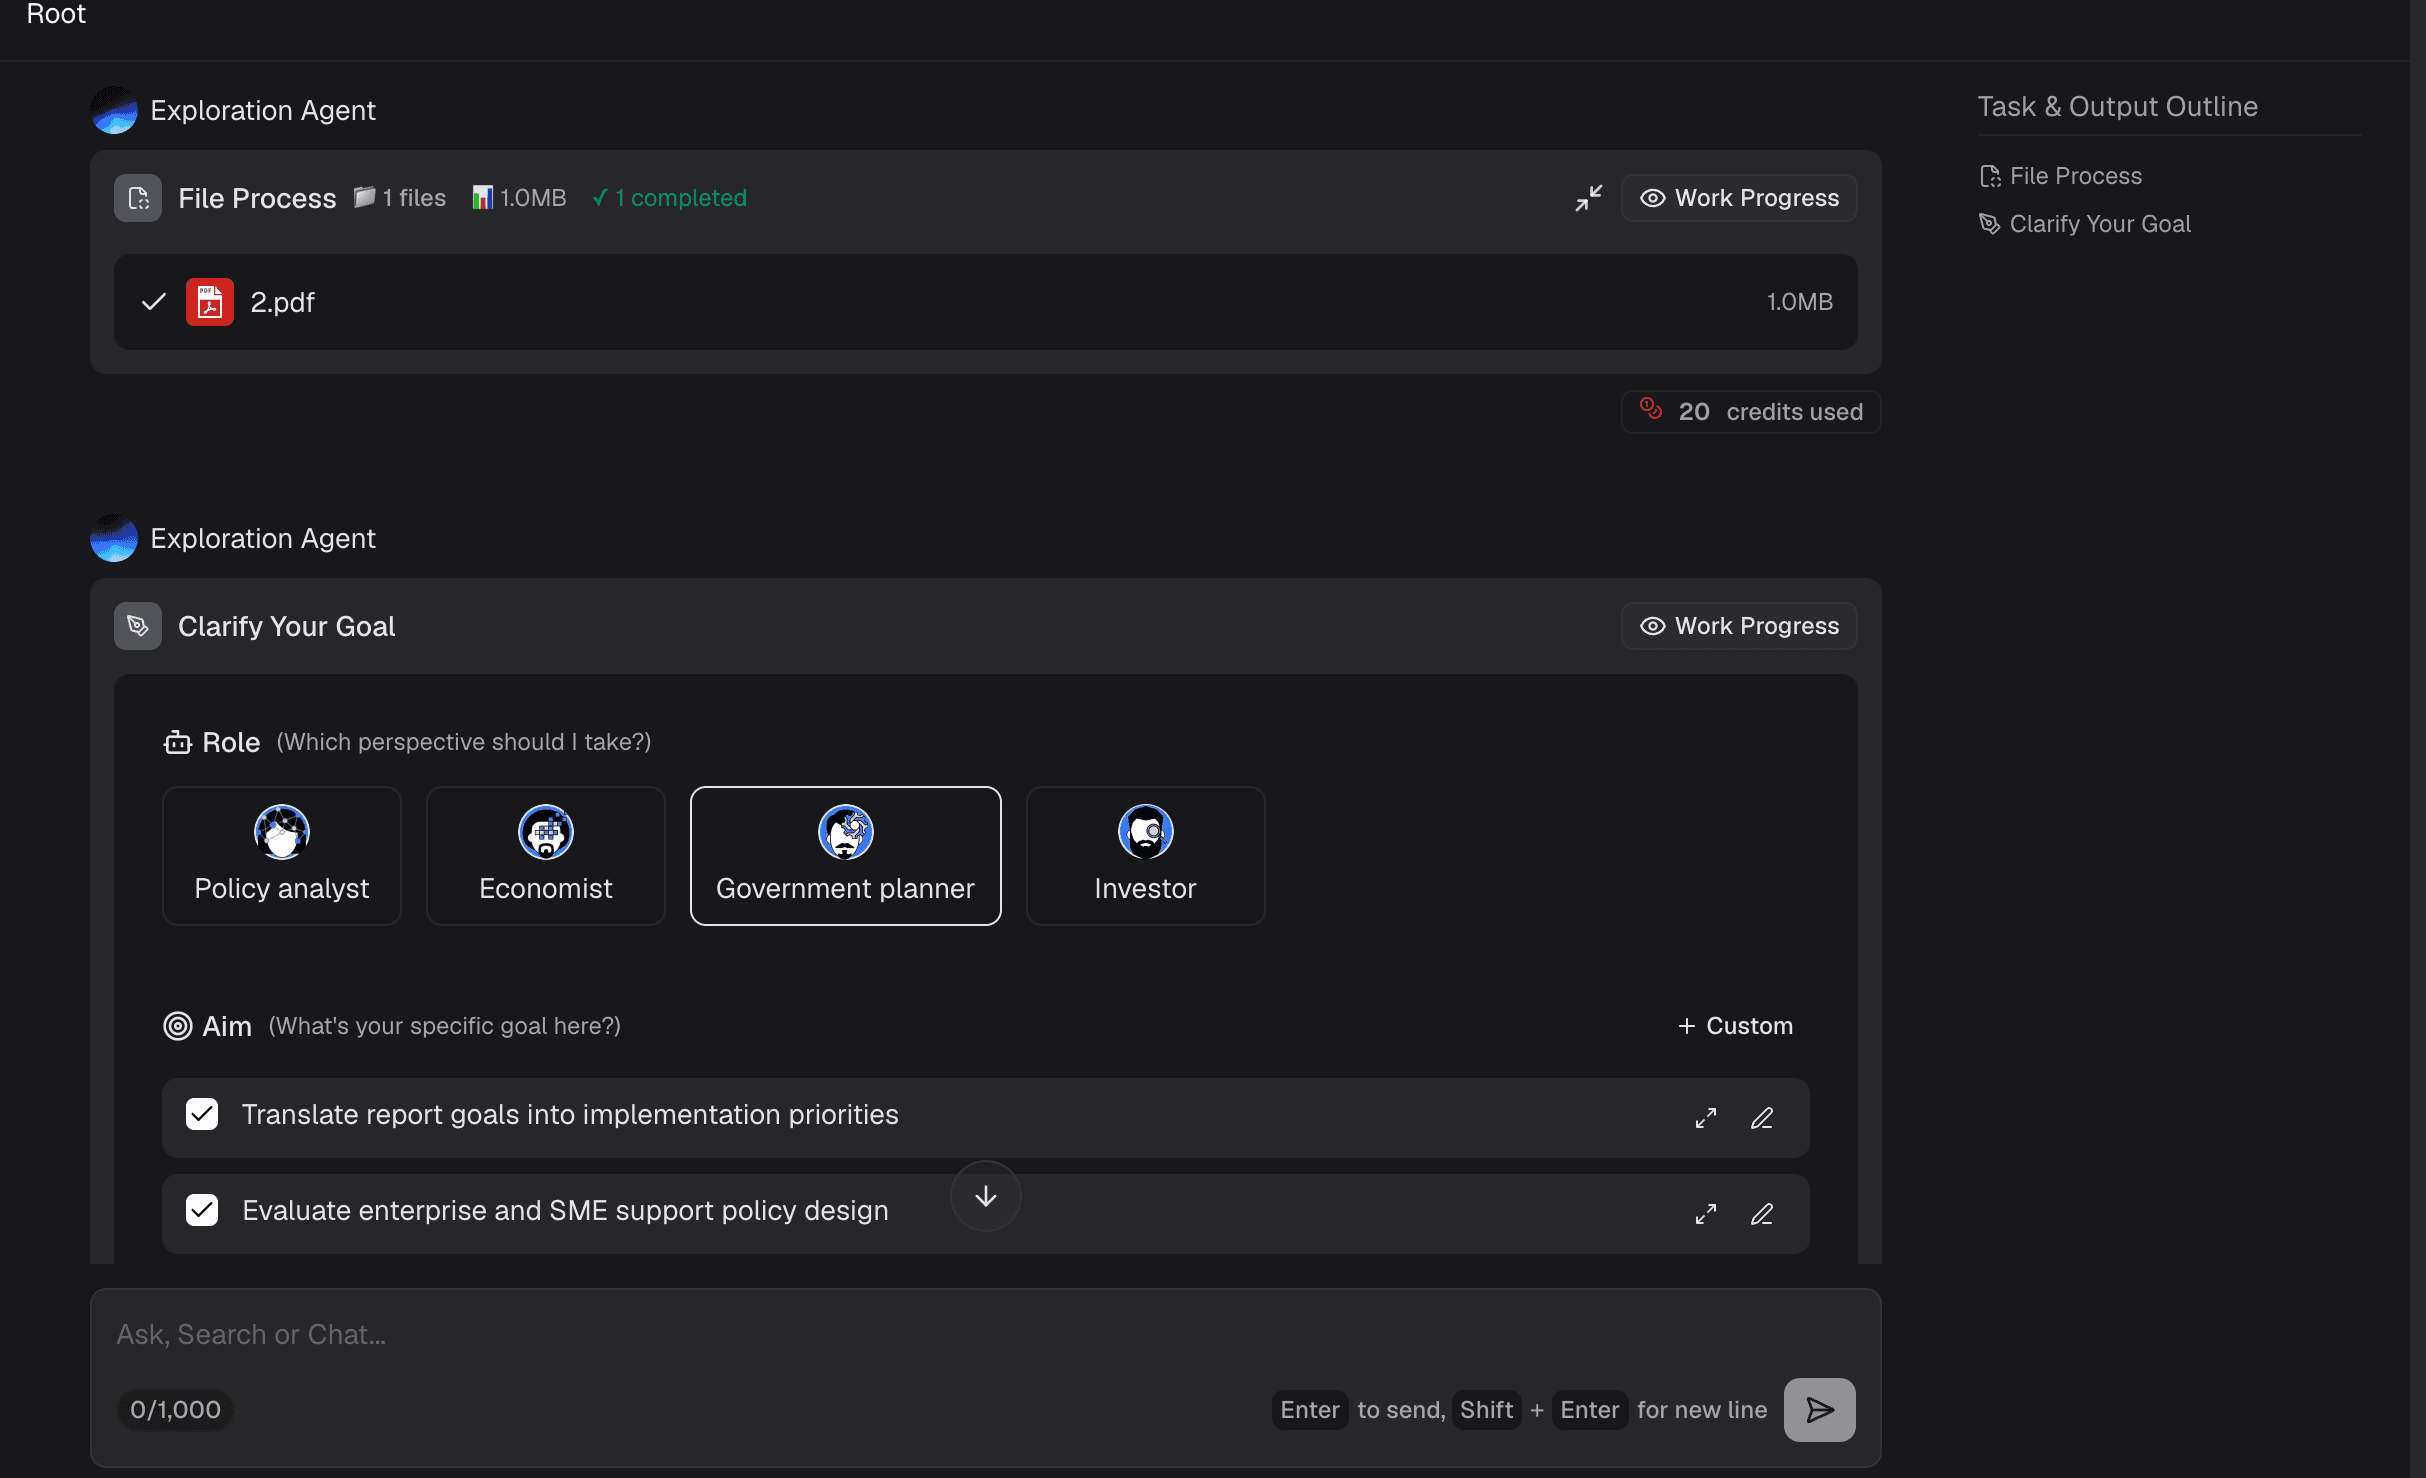
Step 2: Prompt the AI for Insights
Once your file is uploaded, you can interact with the AI just as you would with a highly trained human analyst. Use the conversational chat interface to ask specific questions like, "Extract the Q3 revenue growth by region" or "Summarize the key demographic shifts in this report." Powerdrill Bloom will intelligently scan the PDF and pull out the precise data points you requested in seconds.
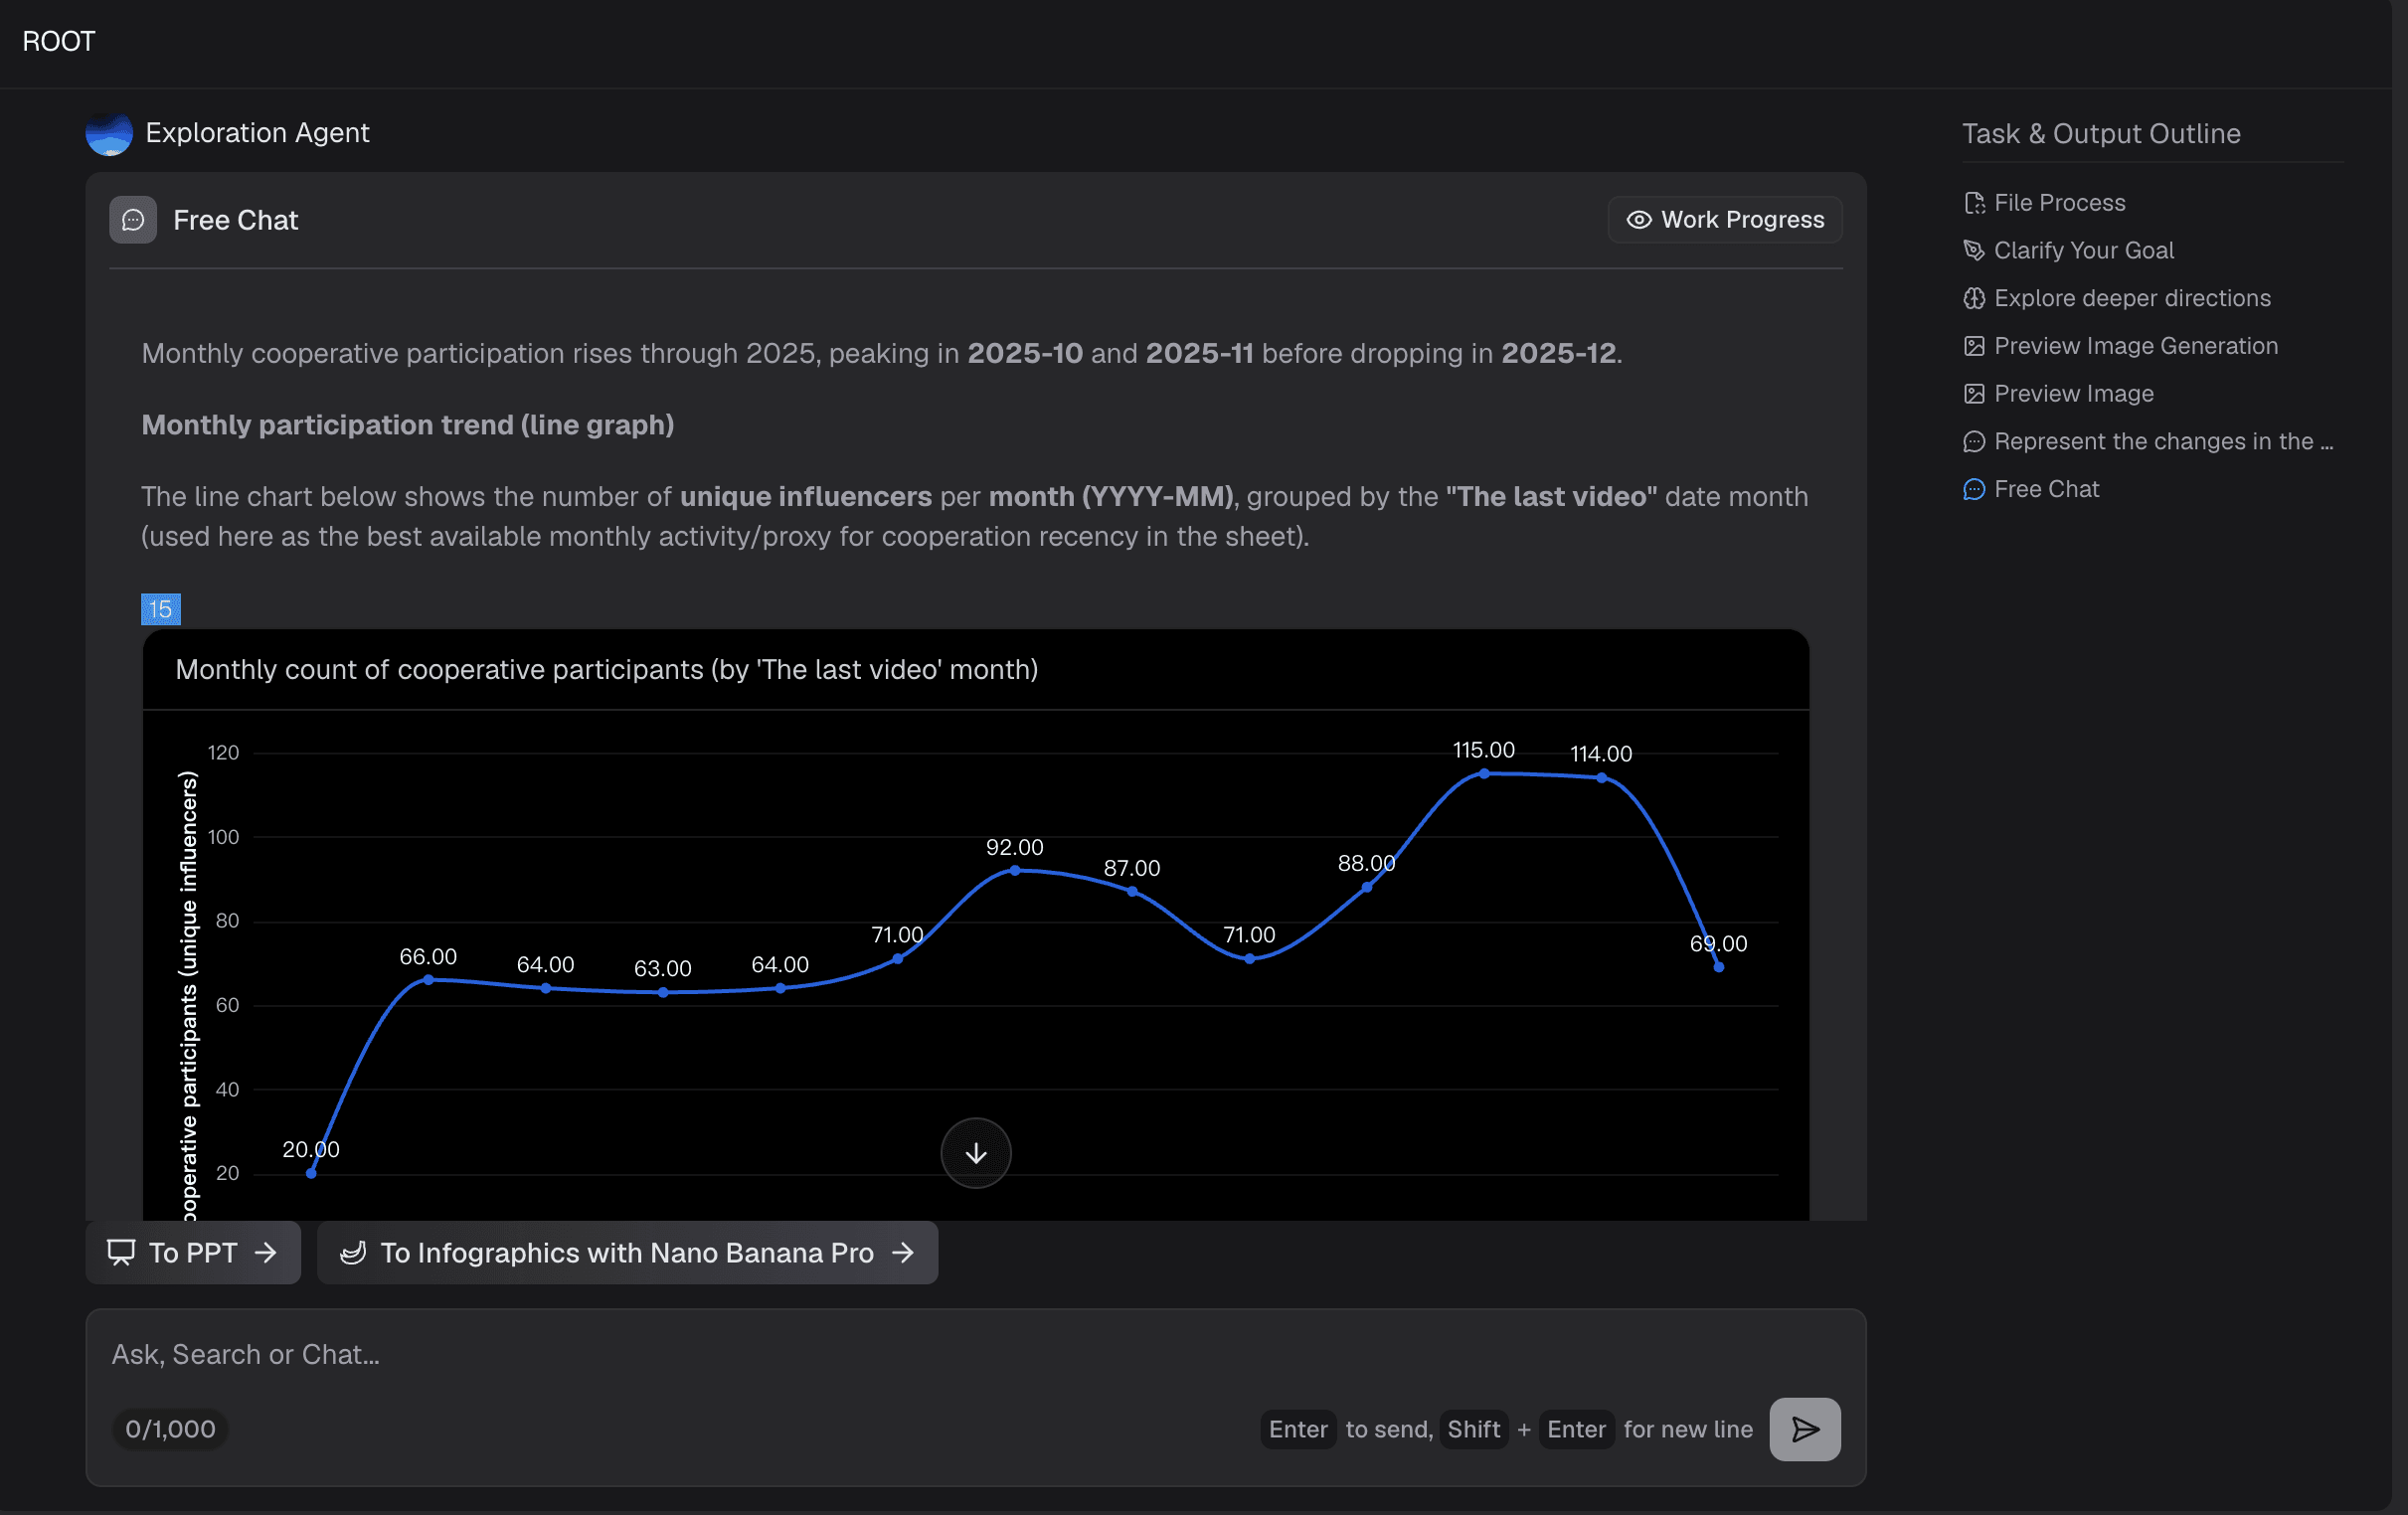
Step 3: Graph Generation
With your brilliant insights successfully extracted, simply tell the AI to visualize it for you. You can type a prompt like, "Turn this regional growth data into a modern, corporate bar chart infographic." Powerdrill Bloom will immediately generate a high-quality, fully customizable graph. You can easily tweak the colors, layout, and fonts to match your brand's unique identity right inside the platform.
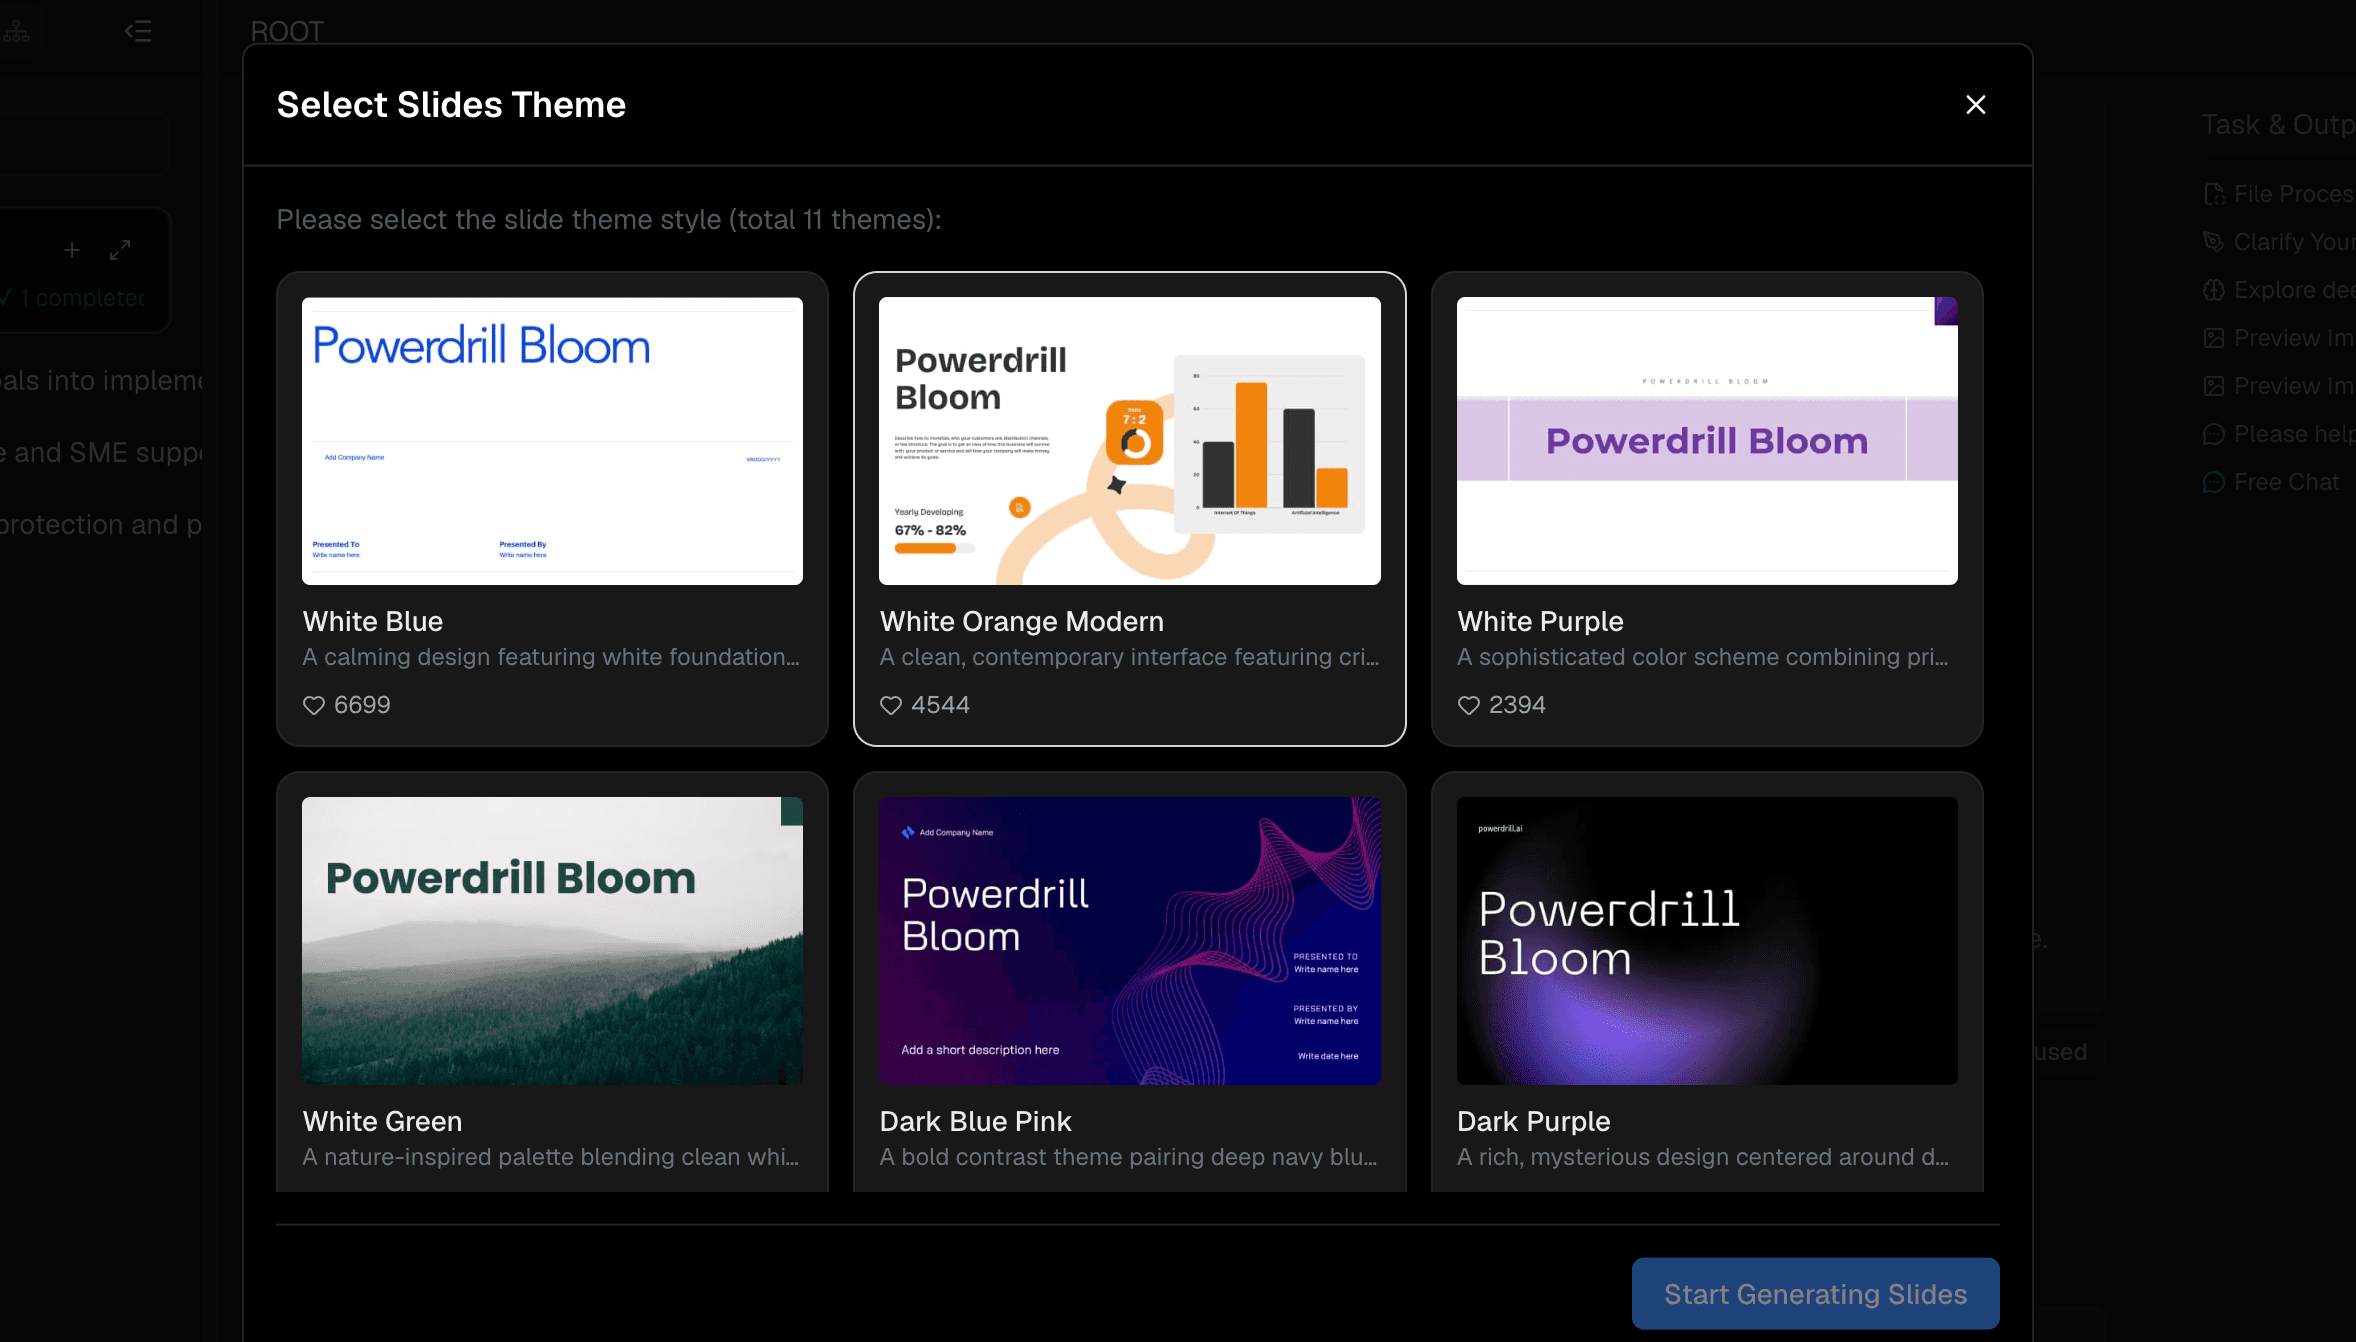
Step 4: Export and Share
Once your infographic looks absolutely perfect, you are ready to show it off to the world. You can then effortlessly share it with key stakeholders, embed it in crucial presentations, or post it directly to your social media channels for maximum engagement.
Who Should Use Powerdrill Bloom?
Powerdrill Bloom is specifically built for absolutely anyone who needs to make complex data highly digestible and visually beautiful. The primary beneficiaries include:
Data Analysts & Researchers: Stop wasting precious time cleaning data arrays and start spending more time interpreting and presenting vital insights effectively to high-level decision-makers.
Marketing Professionals: Quickly turn dry industry whitepapers and lengthy case studies into highly engaging, instantly shareable infographics that drive web traffic and boost lead generation.
Educators & Students: Seamlessly transform dense academic research papers and boring textbook chapters into clear, highly visual study aids and dynamic classroom presentation materials.
Business Executives: Instantly summarize lengthy quarterly financial reports and dense competitor analyses into quick-glance visual dashboards perfect for fast-paced boardroom meetings.
Journalists: Effortlessly extract hidden statistics from complex government reports and public PDFs to create highly compelling, accurate data journalism pieces for your readers.
Conclusion
In 2026, there is absolutely no excuse for boring presentations or countless hours lost to tedious manual data entry. Creating stunning infographics from PDF data should be a remarkably smooth, inspiring process, not a frustrating chore. Powerdrill Bloom is proudly leading the global revolution in AI-driven data storytelling, effortlessly bridging the massive gap between raw, static documents and gorgeous visual narratives. Don’t let your valuable data remain forever trapped inside rigid, unreadable files. Experience the ultimate future of data visualization today. Start using Powerdrill Bloom right now to easily transform your complex PDFs into stunning infographics!
FAQs
What is Powerdrill Bloom?
Powerdrill Bloom is an AI-powered platform that extracts data from complex PDFs and automatically generates stunning, customizable infographics.
Do I need design skills to use Powerdrill Bloom?
Not at all. The AI handles both data extraction and graphic generation, making it incredibly easy for non-designers.
Is my PDF data secure with Powerdrill Bloom?
Yes. Powerdrill Bloom uses enterprise-grade encryption to ensure your uploaded documents and extracted data remain completely private and secure.
Can Powerdrill Bloom handle multi-page PDF reports?
Absolutely. The AI is designed to instantly scan, comprehend, and extract accurate insights from lengthy, multi-page PDF documents.