Best Way to Convert Excel or CSV to Charts with AI (Complete 2026 Guide)

Introduction
If you are reading this in 2026, you are likely exhausted from staring at endless rows of spreadsheet data. As a marketer or business leader, you need Data-Driven Decisions, but you don't have the time to learn SQL, Python, or wait days for a specialized data team. After testing dozens of tools using sample business datasets, the verdict is clear: manually dragging and dropping elements in legacy spreadsheet software is officially dead.
Tools like Powerdrill Bloom leverage AI to transform raw data at speeds that were unimaginable just a few years ago. As I detailed in my previous tutorial on how to Turn Excel Sheets into Stunning Graphs Instantly, modern Automated Workflows are the key to unlocking hidden business value. Below is the ultimate 2026 guide on how you can use Powerdrill Bloom to convert your Excel or CSV data into clear, actionable Visual Storytelling in seconds.
What you'll need before starting
Before we dive into the automation magic, let’s ensure you have everything set up. It only takes four simple components:
1. What is Powerdrill Bloom?: This is your dedicated AI-powered data analysis and visualization agent. It acts as your personal data scientist, capable of deep-diving into raw data, cleaning it, and predicting trends via simple natural language commands.
2. Your Data: Have your raw files ready. Whether it’s a .xlsx or a .csv file exported from your CRM or ad platform, ensure it's accessible.
3. A Powerdrill Bloom Account: Powerdrill Bloom offers a highly generous Freemium tier to get you started immediately. For power users needing advanced predictive features and massive slide generation, their highly competitive premium subscription starts at just $13.27/month.
4. Clear Goals: Know the business question you want to answer. Are you tracking quarterly revenue growth, or analyzing customer churn rates?
How to Convert Excel or CSV to Charts Using AI Tools Like Powerdrill Bloom: A Step-by-Step Guide
Stop wrestling with pivot tables. Here is the ultimate no-code, 4-step framework to achieve Automated Data Visualization:
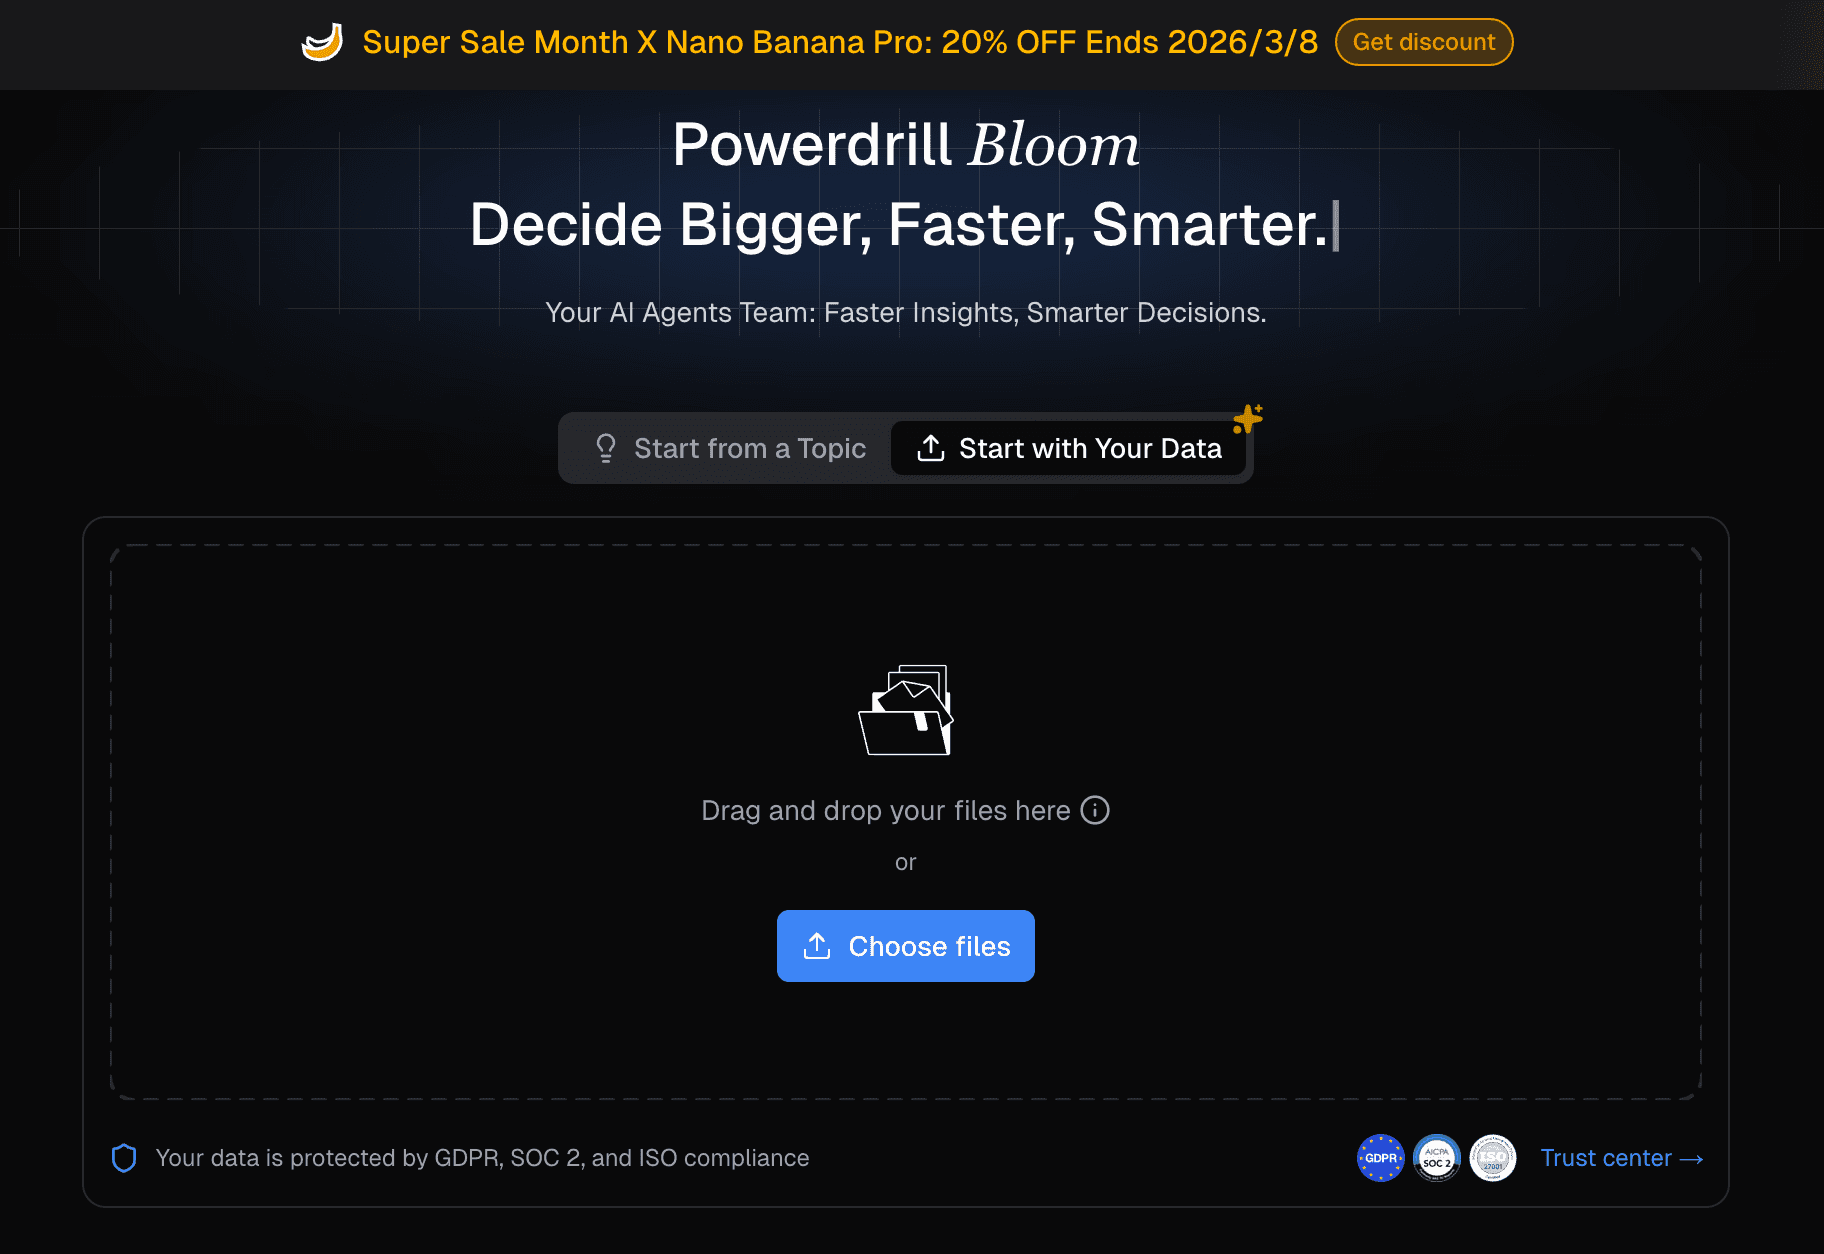
Step 1: Upload Your Data
Simply drag and drop your Excel or CSV file into the Powerdrill Bloom interface. The AI agent immediately goes to work, automatically cleaning formatting errors, handling missing values, and structuring your raw data for optimal analysis.
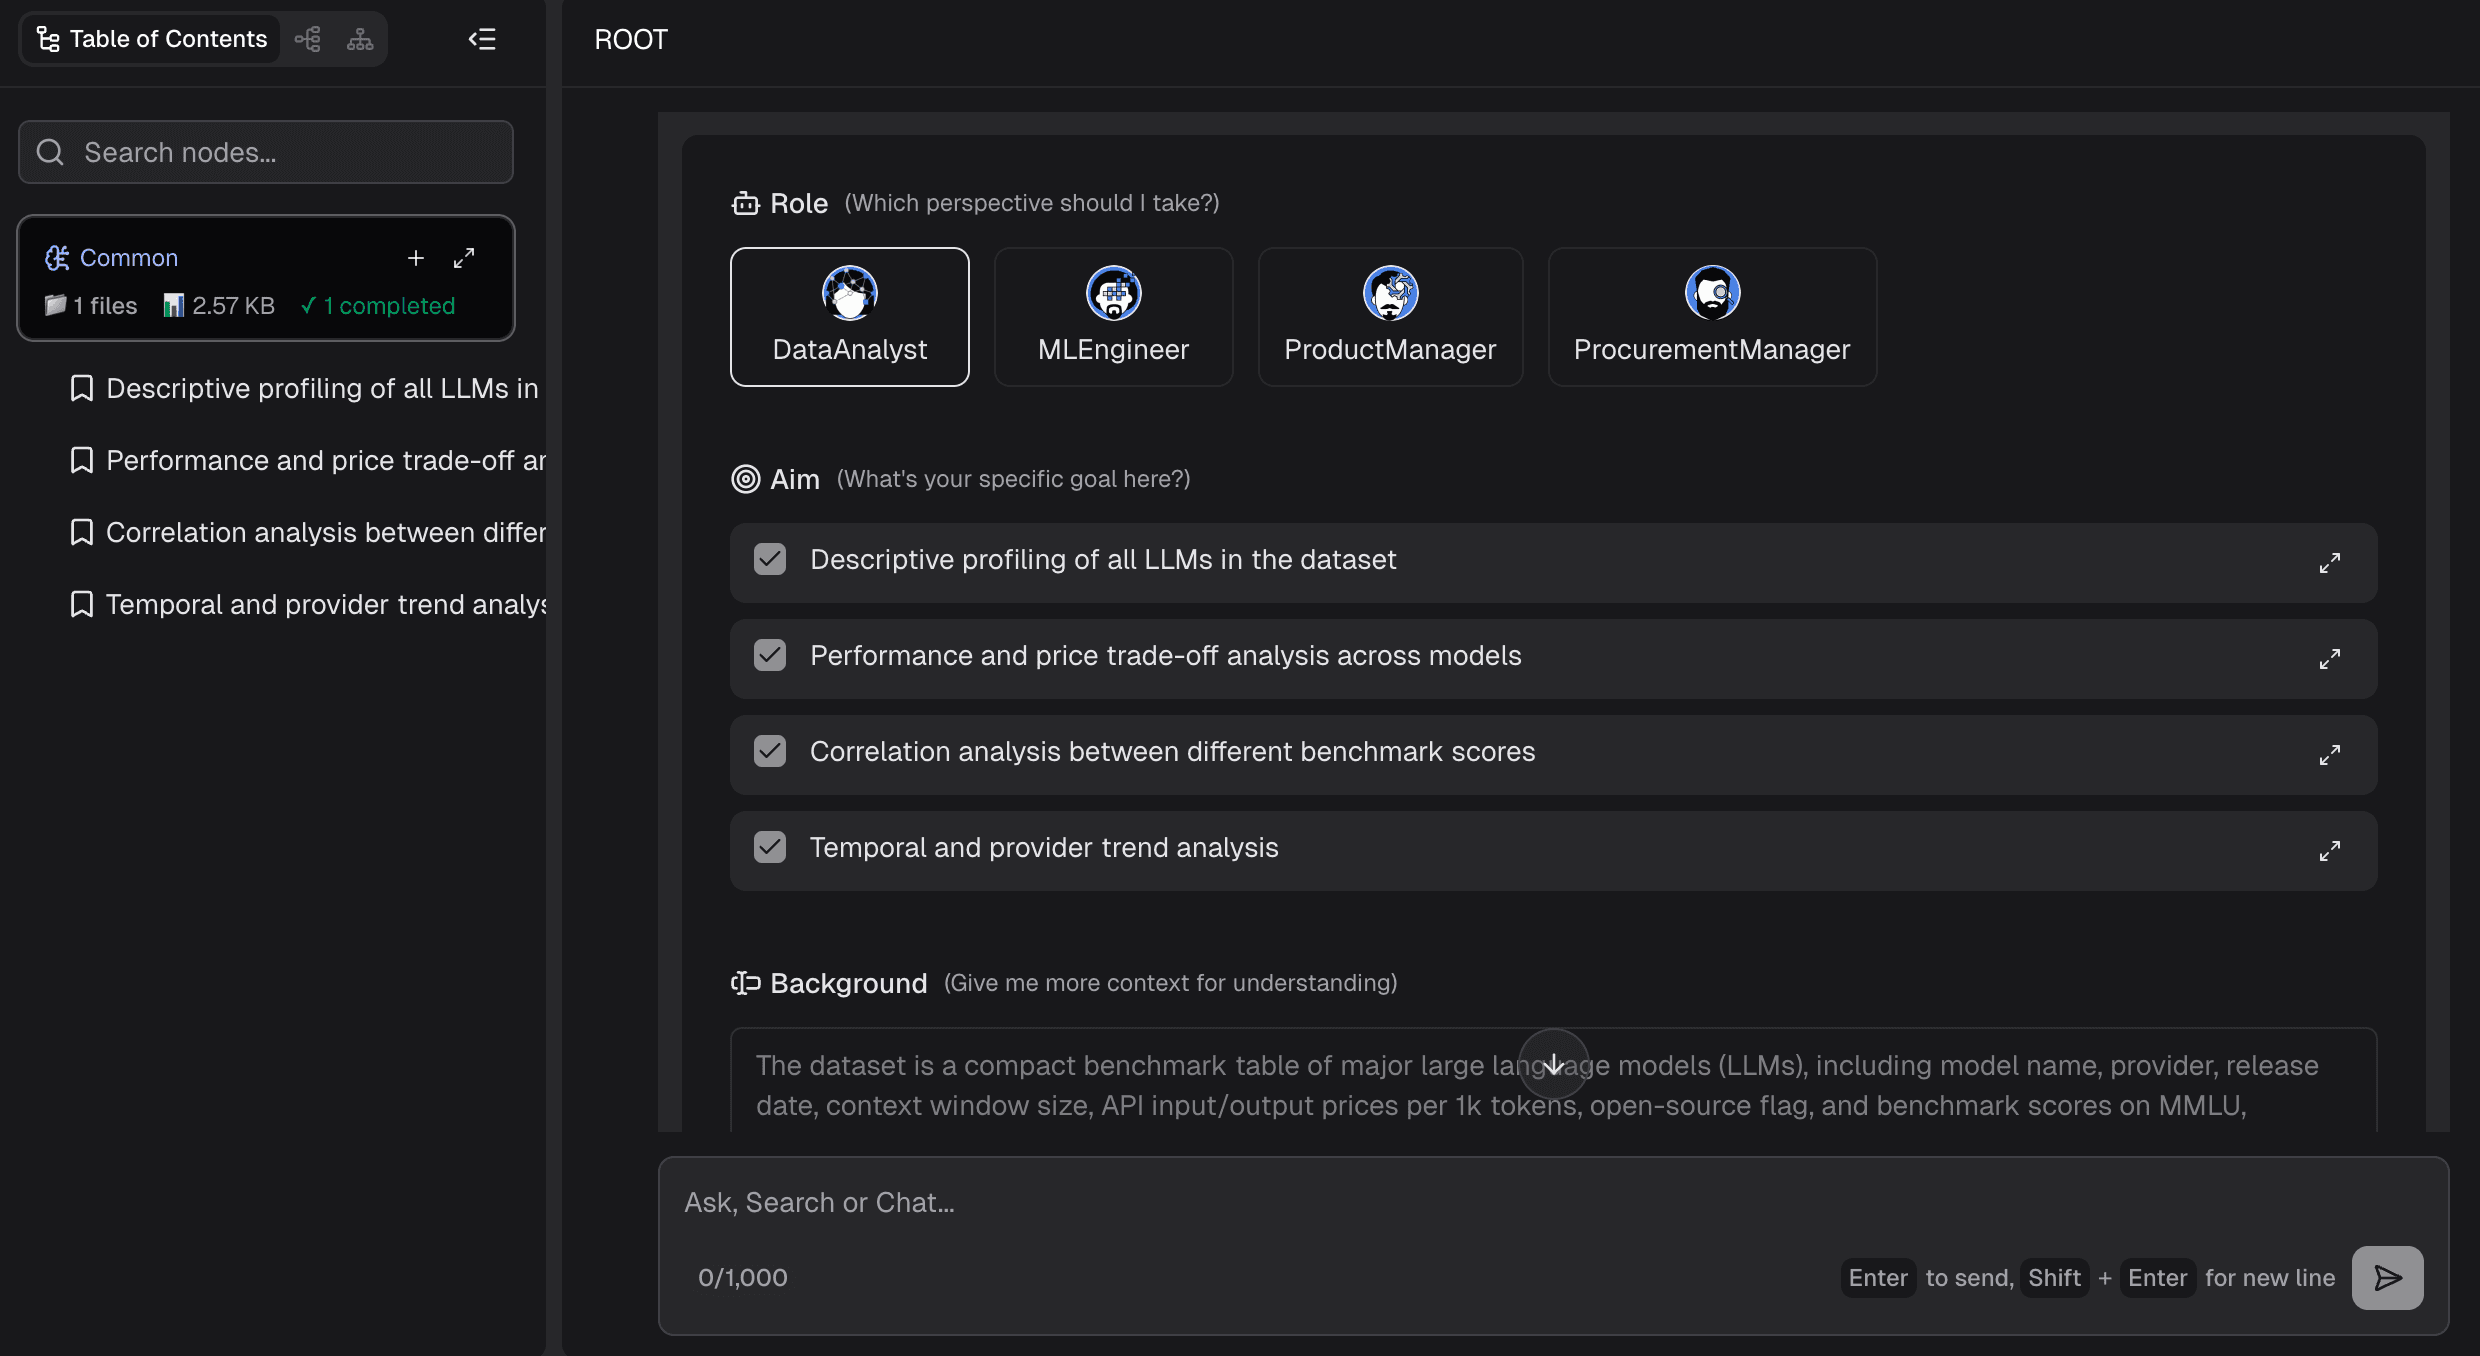
Step 2: Ask Your Questions in Natural Language
Forget complex formulas. Just type what you want to know. For example: "Show me the monthly sales growth for Q3 and compare it across regions." The AI will intuitively explore & analyze the complex data without requiring a single line of SQL.
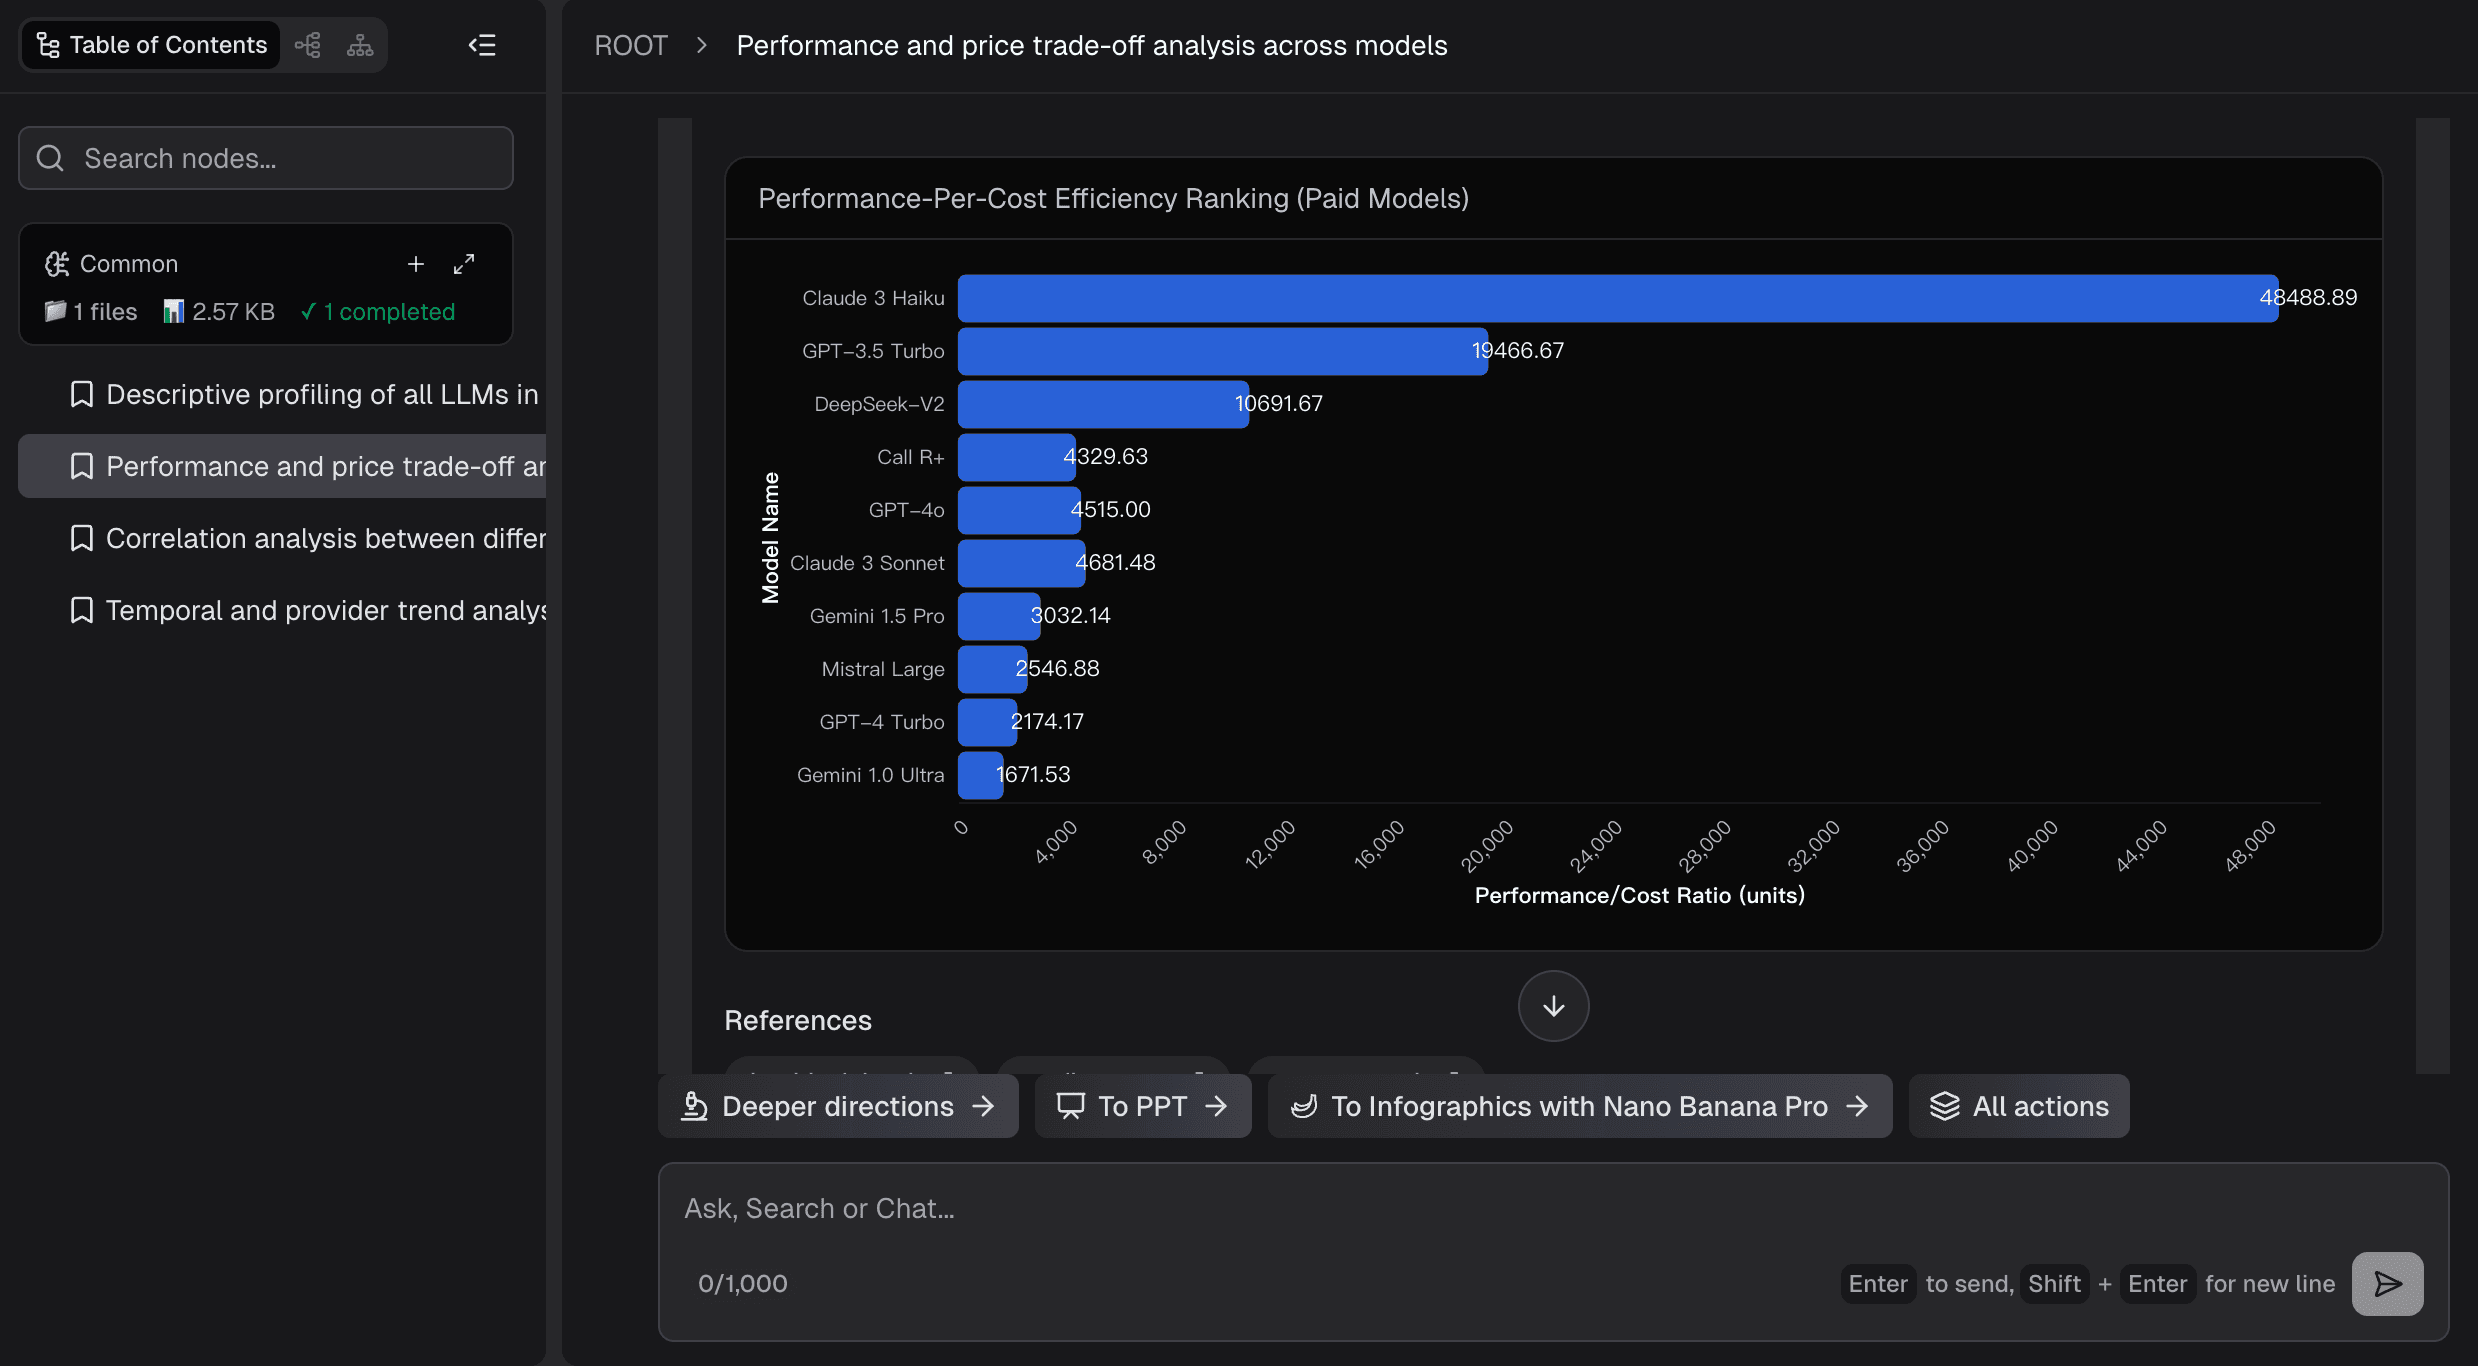
Step 3: Auto-Generate the Best Charts
Based on your query, the AI intelligently recommends and generates the optimal chart type (e.g., a clustered bar chart or a multi-line graph). It doesn't just output a picture; it provides profound, forward-looking Actionable Insights alongside the visualization.
Step 4: Export to PPT or Image
Once you are satisfied with the generated insights, a single click exports your beautiful, high-resolution charts as standalone images or integrates them directly into a presentation.
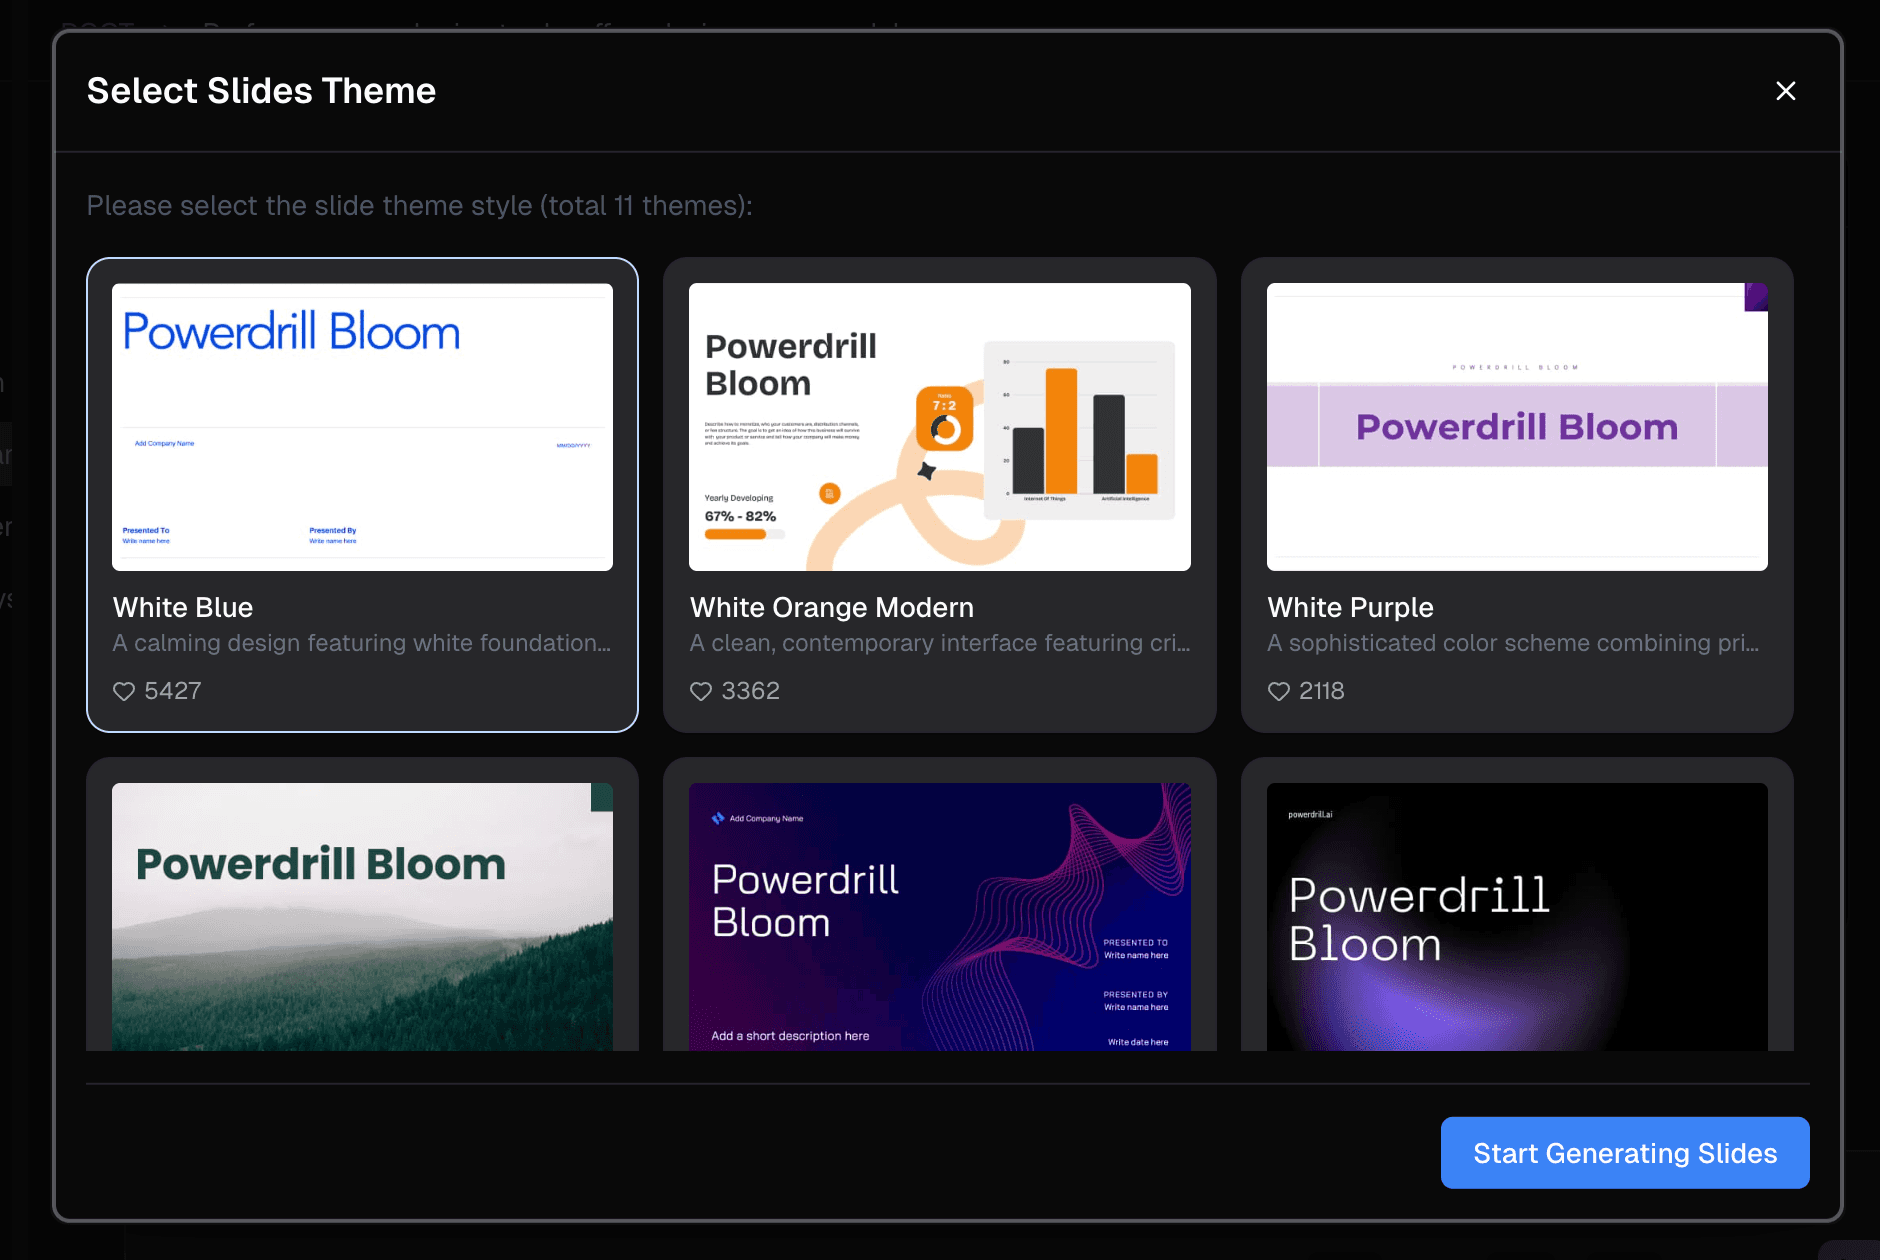
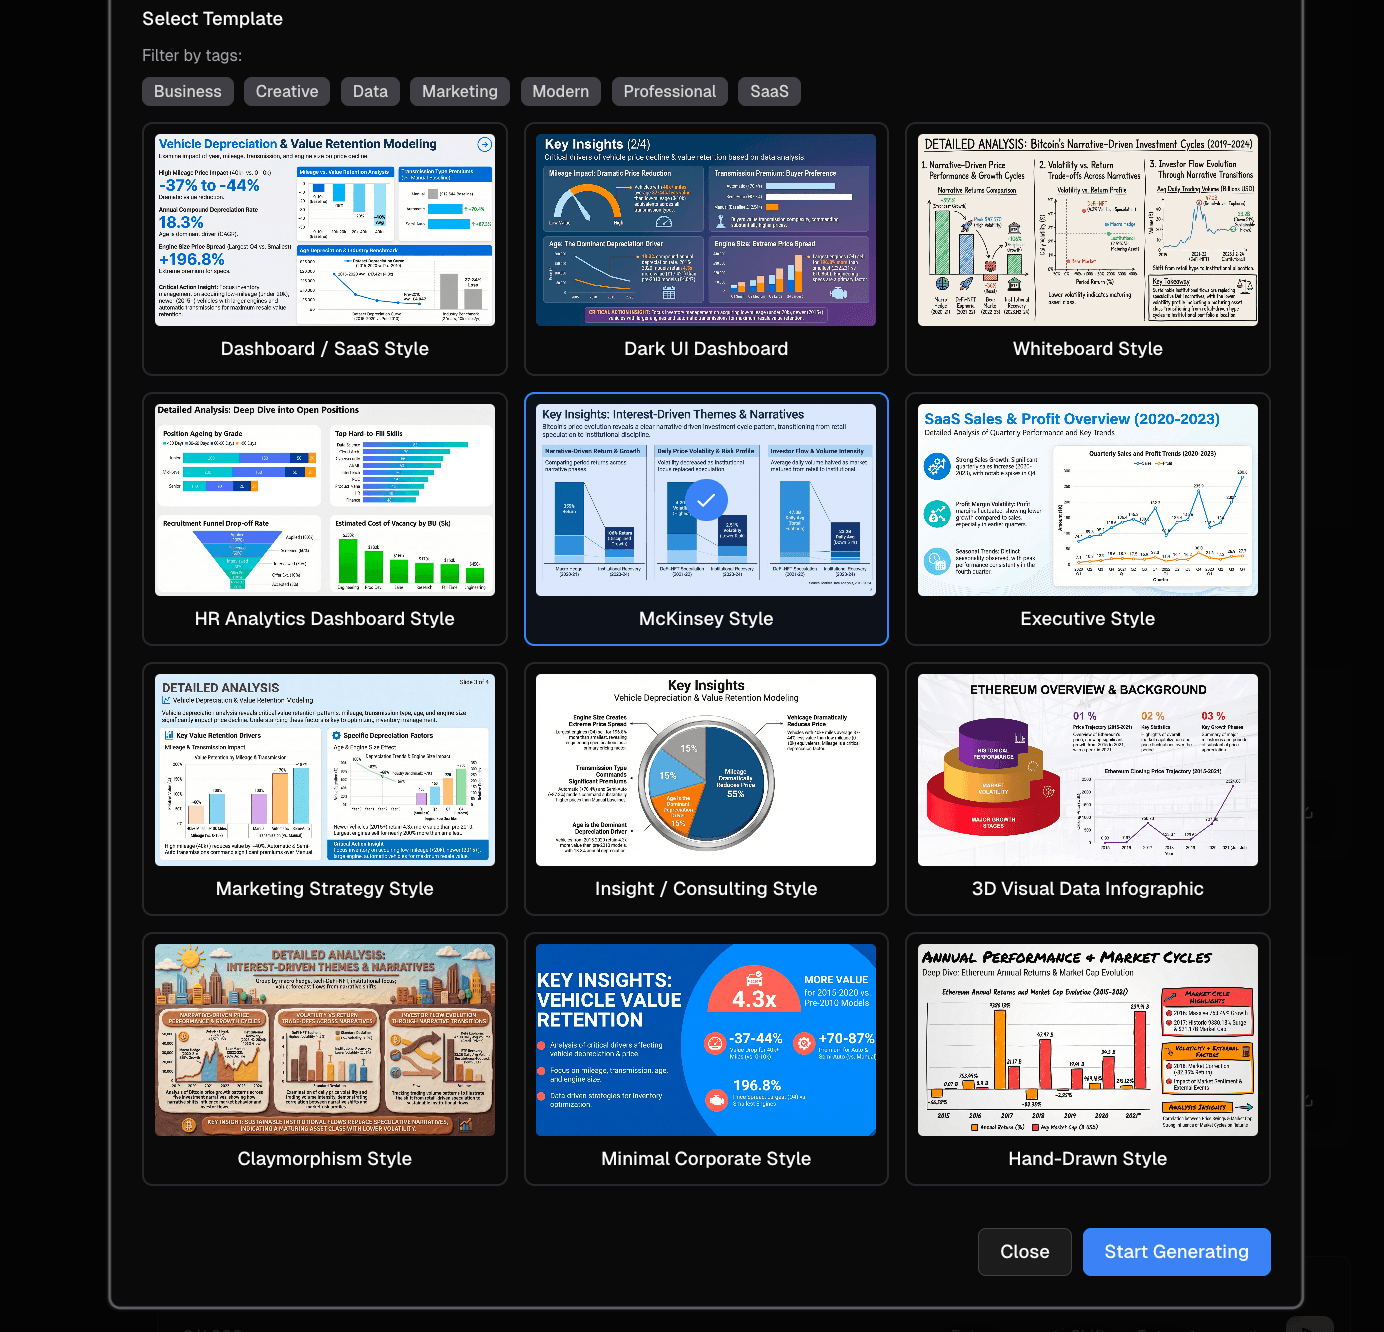
One-Click PPT Generation
Generating a single chart is helpful, but presenting a compelling narrative is what wins boardroom pitches. Powerdrill Bloom transcends basic chart generation with its One-Click PPT Generation feature. The AI automatically formats your insights and charts into a comprehensive, richly narrated presentation. Packed with a variety of stunning built-in templates, it builds the entire slide deck around your data story instantly.
Generate Graphs with Nano Banana Pro
At the heart of Powerdrill Bloom's breathtaking visual output is its integration with the powerful visual generation engine. You can effortlessly Generate Graphs with Nano Banana Pro, selecting from four distinct, highly optimized template styles:
Business
Stable, professional, and authoritative—perfect for C-level executive briefings.
Finance
Highly rigorous, emphasizing precise variance comparisons and financial accuracy.
Data Analysis
Designed for deep multi-dimensional data exploration and complex variable relationships.
SaaS Dashboard
Modern, fancy, and sleek. The absolute best choice for tracking dynamic product metrics and KPIs.
Common mistakes to avoid
Even with powerful AI, a few missteps can dilute your results. Here is how to avoid them (and how the AI helps):
Uploading Extremely Messy, Unformatted Data: While Powerdrill Bloom auto-cleans data, uploading files with completely merged cells or scattered text can confuse the AI. Solution: Keep your data in a simple row-and-column format. The AI will handle the missing values and outliers automatically.
Lacking Clear Prompts or Goals: Asking the AI "analyze this" yields generic results. Solution: Be specific. Ask, "What caused the drop in retention in March?" The AI’s context engine thrives on direct questions.
Chart Information Overload: Trying to fit 50 variables into one pie chart is a visual disaster. Solution: Powerdrill Bloom's AI mechanism acts as a safeguard, automatically breaking down massive datasets into multiple digestible charts to prevent cognitive overload.
Powerdrill Bloom makes going from data to graph easier
Whether you are a marketing manager or a sales director, Powerdrill Bloom seamlessly integrates into your daily routine through these core capabilities:
1. Free AI Excel Analysis Tool: Automated Insights & Visualization
Upload your Excel files and let Powerdrill Bloom do the work. It automatically explores and analyzes your spreadsheets, detects key patterns, and generates actionable insights with clear visualizations—all in seconds.2. Create PPT Slides from Any Topic or File with AI
Type a topic or upload files like Excel, CSV, and PDF. Powerdrill Bloom understands your content and builds professional PowerPoint slides automatically.3. Create Stunning Charts from Excel, CSV, or PDF — Instantly with AI
Seamlessly transform multiple data formats into high-end graphs with zero friction.
Ready to use AI to go from data to graph without the manual work? Try Powerdrill Bloom for free today.
Frequently Asked Questions
What does "Convert Excel or CSV to Charts with AI" mean?
It refers to the fully automated process where artificial intelligence algorithms automatically read your spreadsheet data, clean outliers, intelligently infer data relationships, and instantly generate the most appropriate, highly accurate visual charts.
Can I create graphs from Excel files using an AI tool like Powerdrill Bloom?
Yes. You can effortlessly generate stunning graphs from your Excel files. Furthermore, Powerdrill Bloom doesn't just create the visuals; it attaches deep, data-driven analytical insights to explain why the data looks the way it does.
Do I need coding skills to turn Excel into graphs using AI?
No. This tool is purpose-built for business and marketing teams. The entire process is operated via natural language commands. You do not need to know any Python, SQL, or complex Excel macros.
How long does it take to convert Excel to a presentation using AI?
While traditional manual chart creation and formatting take hours, utilizing Powerdrill Bloom reduces this to mere seconds, offering a seamless and instant transformation from raw data to a presentation-ready PPT deck.