12 alternatives à Hex les plus performantes pour l’analyse de données en 2026

Introduction
En tant qu’analyste expérimenté évoluant dans un écosystème de plateformes data en constante mutation, j’ai consacré l’année écoulée à tester un ensemble de workflows d’analyse de données assistés par l’IA afin d’identifier ce qui fonctionne réellement en pratique.
Si Hex reste une référence pour de nombreuses équipes data, le paysage de 2026 exige bien plus qu’un simple notebook collaboratif orienté code. J’ai recueilli les retours de nombreuses équipes confrontées à la même frustration : Hex est puissant pour les data scientists, mais pour les utilisateurs métier qui doivent non seulement analyser des données, mais aussi produire rapidement des supports de présentation, la courbe d’apprentissage est trop élevée et les coûts manquent de prévisibilité.
Pour répondre à ces enjeux, j’ai rassemblé dans cet article une analyse complète des 12 meilleurs outils d’analytique collaborative, afin de vous aider à identifier l’alternative à Hex la plus adaptée à vos besoins.
La liste : 12 meilleures alternatives à Hex
Voici les principaux concurrents à considérer en 2026 :
Nom de l’outil | Compétences requises | Modèle de tarification | Idéal pour |
|---|---|---|---|
No-code (langage naturel) | Abonnement mensuel | Utilisateurs métier & reporting rapide | |
Python / SQL | Par utilisateur + calcul | Équipes de data science | |
Python / Scala / SQL | Tarification à l’usage | Big Data en entreprise | |
Python | Gratuit (open source) | Développeurs individuels | |
Glisser-déposer | Par utilisateur | Analyse BI visuelle | |
SQL / low-code | Par utilisateur | Data whiteboarding collaboratif | |
Formules type tableur | Par utilisateur | Équipes finance & opérations | |
SQL / tableur | Tarification à l’usage | Data warehouses cloud | |
SQL / Python | Par utilisateur | Analystes hybrides | |
Langage naturel | Abonnement mensuel | Analyse IA basique | |
Langage naturel | Par utilisateur | Tâches analytiques ponctuelles | |
Python | Gratuit / paiement GPU | Étudiants & chercheurs |
Pourquoi chercher des alternatives à Hex ?
Avant d’examiner la liste en détail, il est essentiel de comprendre pourquoi de nombreuses équipes s’éloignent aujourd’hui de l’écosystème Hex :
Coûts imprévisibles : Le modèle de tarification de Hex, basé à la fois sur le nombre d’utilisateurs et les « minutes de calcul », complique fortement la planification budgétaire. Pour les équipes actives, la facture mensuelle peut rapidement devenir difficile à anticiper.
Goulots d’étranglement en matière de performances : Malgré les promesses du cloud, l’exécution de requêtes sur des jeux de données de plusieurs millions de lignes entraîne souvent des ralentissements, ce qui nuit à la fluidité de l’analyse interactive.
Barrières d’accessibilité : C’est souvent le point décisif. Hex exige une maîtrise de SQL et de Python, excluant de fait les chefs de produit, les équipes marketing et les équipes opérationnelles d’un véritable accès en libre-service à l’analyse de données.
1. Powerdrill Bloom
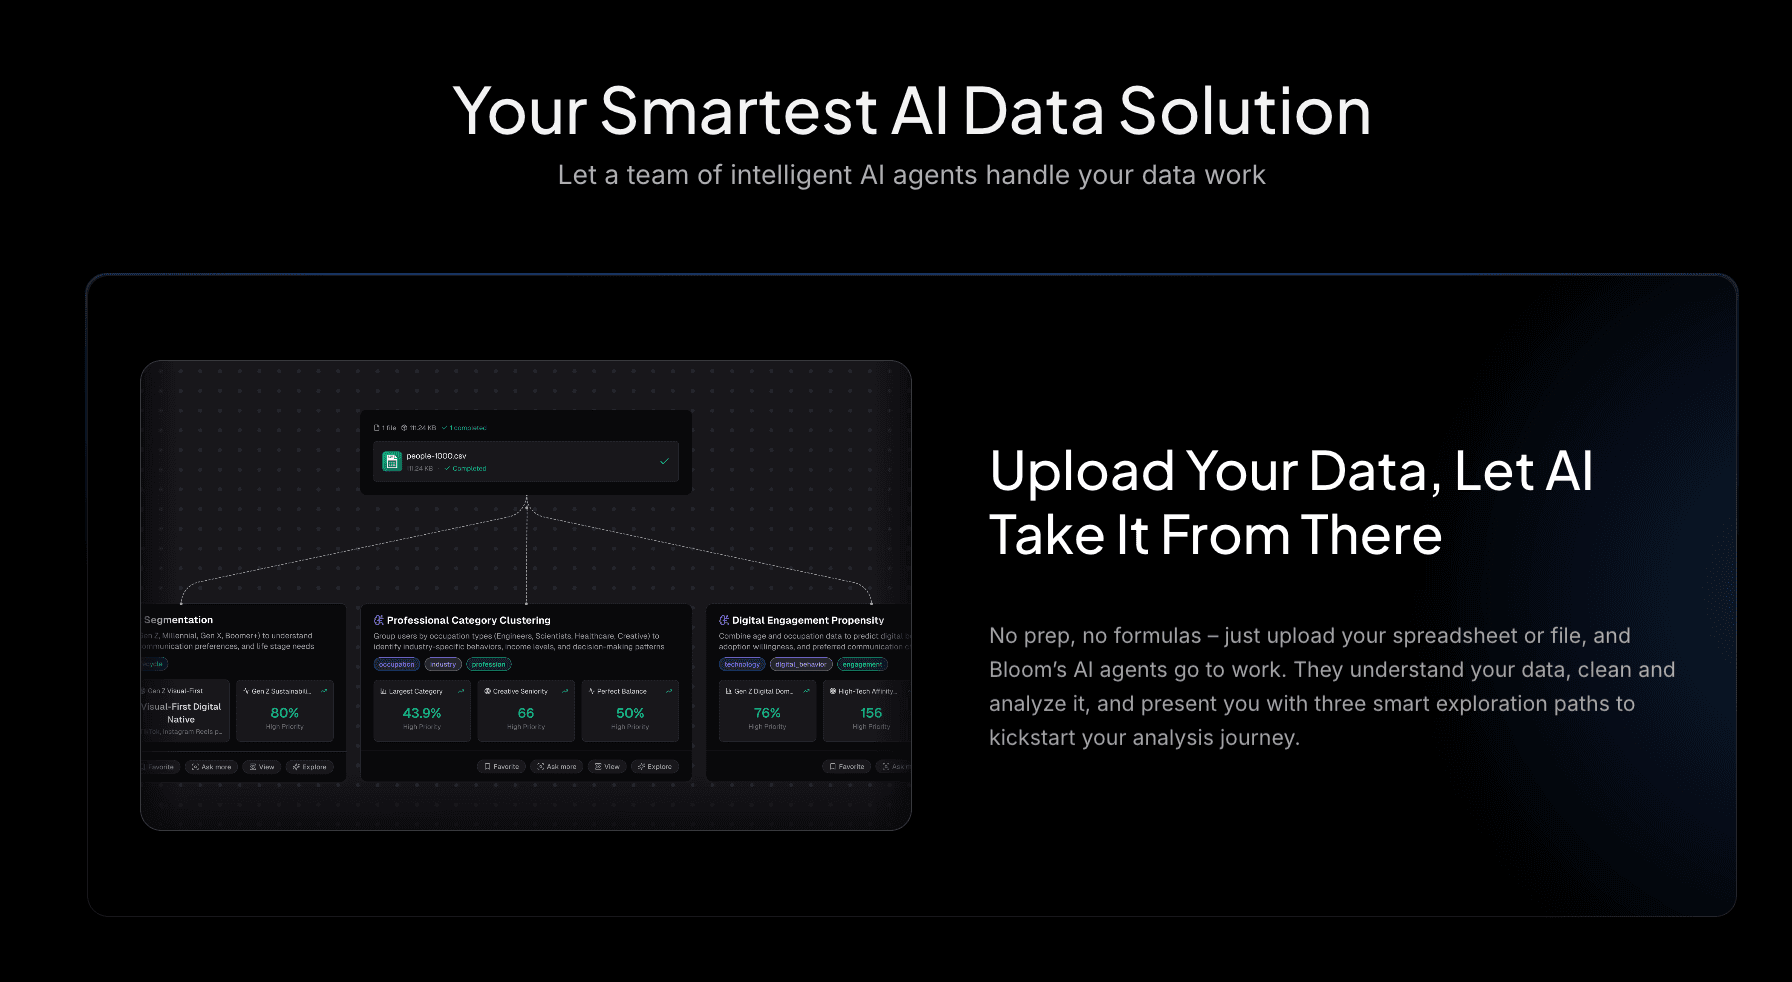
Powerdrill Bloom est l’alternative no-code la plus aboutie à Hex en 2026. Plus qu’un simple outil, il s’agit d’un agent intelligent d’exploration de données et de visual storytelling, conçu pour les utilisateurs métier et capable de combler le fossé entre données brutes et prise de décision.
Fonctionnalités clés
Interaction no-code : Oubliez SQL et Python. Il suffit de poser des questions en langage naturel.
Traitement complet des données : Connexion aux fichiers Excel / CSV / PDF, nettoyage automatique des données, détection d’anomalies et prévision des tendances.
Nano Banana Pro : L’élément différenciateur majeur. Cette technologie transforme instantanément les insights data en slides professionnels, business ou créatifs, ainsi qu’en images de prévisualisation des données, prêtes pour des réunions de direction ou une diffusion sur les réseaux sociaux.
Avantages
Facilité d’utilisation : Permet aux utilisateurs non techniques (chefs de produit, équipes marketing) de réaliser des analyses avancées en toute autonomie.
Impact visuel élevé : Les présentations générées sont visuellement supérieures aux tableaux de bord BI traditionnels.
Analyses approfondies : Extraction proactive de signaux et de tendances cachées, sans dépendre uniquement de requêtes explicites.
Inconvénients
Les ingénieurs expérimentés préférant coder manuellement des algorithmes complexes peuvent juger le niveau d’automatisation trop élevé.
Tarification
Une tarification flexible et prévisible, évitant le piège des coûts variables liés aux « minutes de calcul ».
2. Deepnote
Le concurrent direct le plus proche de Hex, conçu pour les data scientists qui apprécient Jupyter tout en ayant besoin d’une collaboration dans le cloud.
Fonctionnalités clés
Environnement de notebook collaboratif en temps réel.
Prise en charge robuste des bibliothèques Python et R.
Complétion de code assistée par l’IA.
Avantages
Aucune friction pour les équipes utilisant Python de manière native.
Collaboration fluide, similaire à Google Docs.
Inconvénients
Barrière élevée : nécessite toujours des compétences en programmation, excluant les utilisateurs métier.
Visualisations limitées : les résultats sont techniques et non adaptés aux présentations.
Tarification
Une offre gratuite est disponible ; la version Pro repose sur un modèle combinant licences par utilisateur et coûts de calcul.
3. Databricks
Une plateforme d’analytique unifiée de niveau entreprise, idéale pour de grandes équipes traitant des données à l’échelle du pétaoctet.
Fonctionnalités clés
Architecture Lakehouse.
Support multi-langages (Python, Scala, SQL).
MLops intégré.
Avantages
Performances inégalées pour les jeux de données massifs.
Sécurité et conformité de niveau entreprise.
Inconvénients
Mise en place complexe : nécessite des ingénieurs data dédiés.
Coûteux : la facturation basée sur les DBUs rend le contrôle des coûts difficile.
Tarification
Modèle de tarification basé sur la consommation.
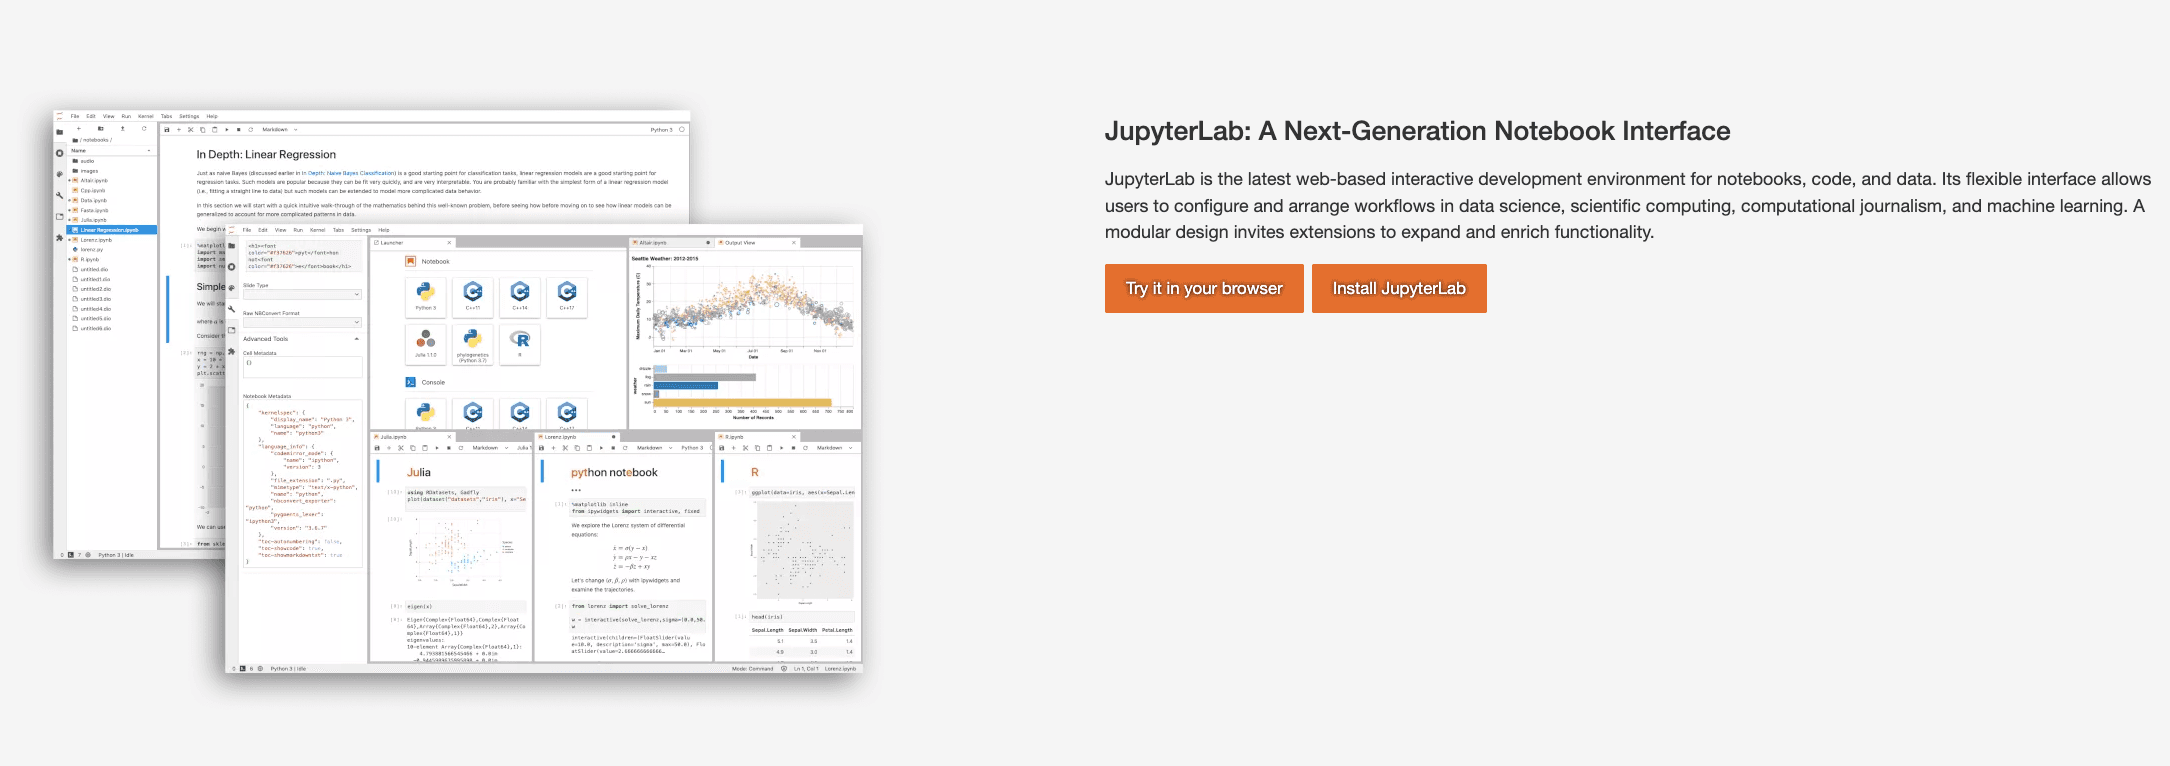
4. Jupyter Notebooks
La référence open source en data science. L’ancêtre de tous les outils de notebooks.
Fonctionnalités clés
Open source et gratuit.
Écosystème massif d’extensions.
Déploiement en local ou sur serveur privé.
Avantages
Entièrement gratuit, sans verrouillage propriétaire.
Hautement personnalisable.
Inconvénients
Problèmes de collaboration : aucune édition en temps réel native.
Complexité des environnements : les problèmes du type « ça fonctionne sur ma machine » sont fréquents.
Tarification
Gratuit (open source).
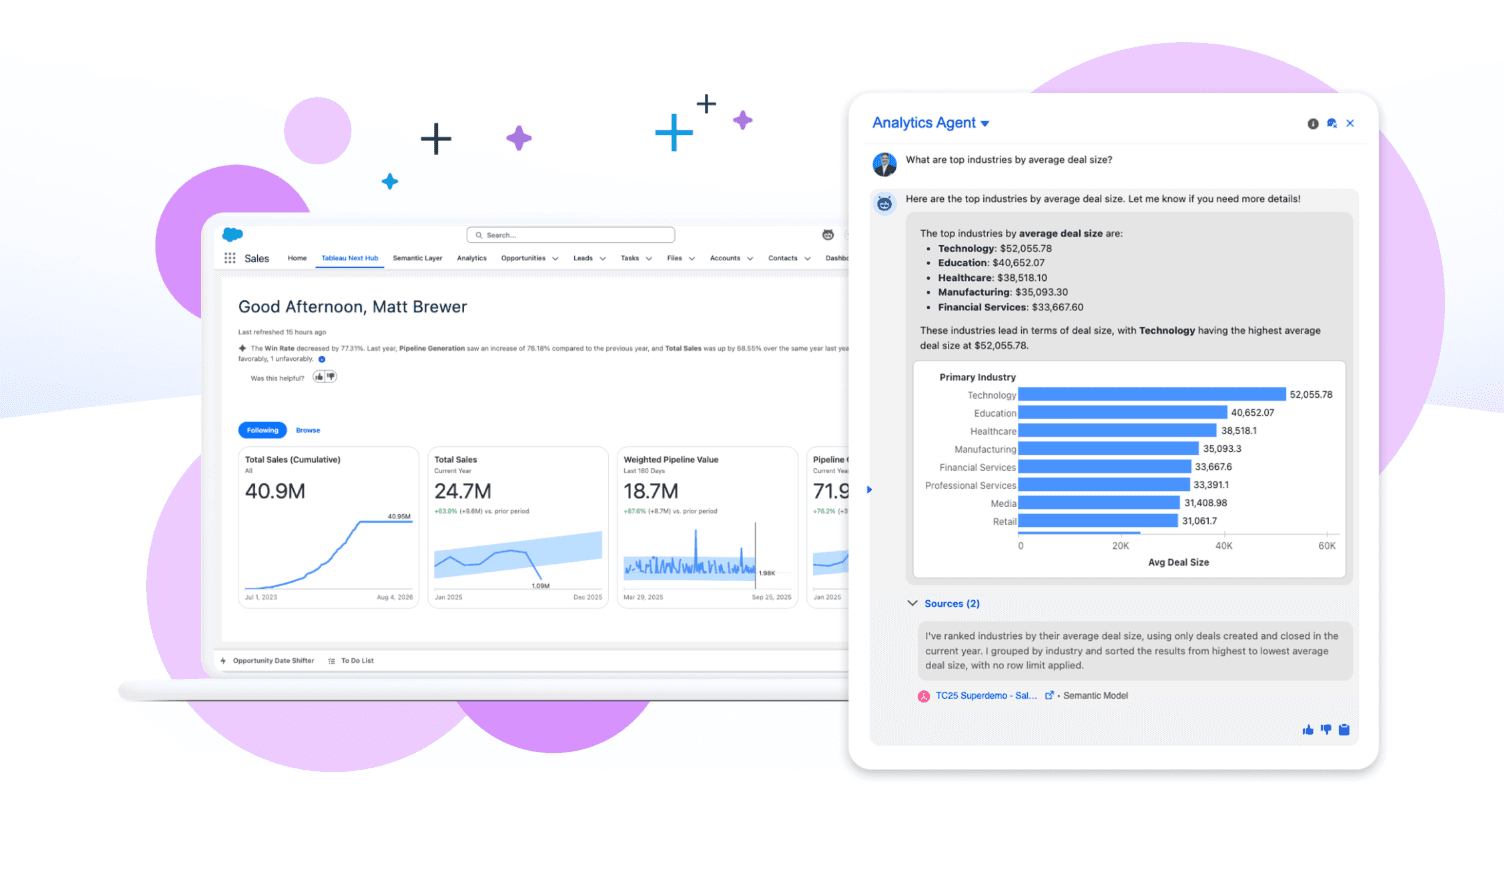
5. Tableau
Le géant de la Business Intelligence (BI), célèbre pour ses visualisations en glisser-déposer.
Fonctionnalités clés
Constructeur visuel robuste.
Tableaux de bord interactifs.
Large éventail de connecteurs de données.
Avantages
Capacités de visualisation de référence pour le reporting statique.
Idéal pour des tableaux de bord fixes et récurrents.
Inconvénients
Courbe d’apprentissage élevée : la maîtrise de l’outil nécessite une formation approfondie.
Rigidité : moins flexible pour l’exploration ad hoc que les notebooks.
Tarification
Abonnement par utilisateur.
6. Count.co
Combine un éditeur SQL avec un canevas de tableau blanc collaboratif.
Fonctionnalités clés
Interface à canevas infini.
Les résultats SQL se transforment en cartes déplaçables.
Accent mis sur la visualisation du flux logique.
Avantages
Excellent pour les sessions de « data jam » en équipe.
Mise en page flexible.
Inconvénients
La dépendance à SQL limite les capacités de modélisation statistique avancée.
Non conçu pour des présentations formelles sous forme de diapositives.
Tarification
Offre gratuite disponible et plans entreprise facturés par utilisateur.
7. Equals
Un tableur de nouvelle génération connecté à des données en temps réel, visant à remplacer Excel pour l’analyse.
Fonctionnalités clés
Raccourcis et formules compatibles avec Excel.
Connexions directes aux bases de données SQL.
Rapports mis à jour automatiquement.
Avantages
Aucune courbe d’apprentissage pour les équipes finance et opérations habituées à Excel.
Prise en main immédiate.
Inconvénients
Performances limitées : difficultés avec des jeux de données de plusieurs millions de lignes.
Absence de fonctionnalités avancées de data science.
Tarification
Tarification par utilisateur.
8. Sigma Computing
Une interface de type tableur pour les data warehouses cloud, permettant de dépasser les limites de lignes d’Excel.
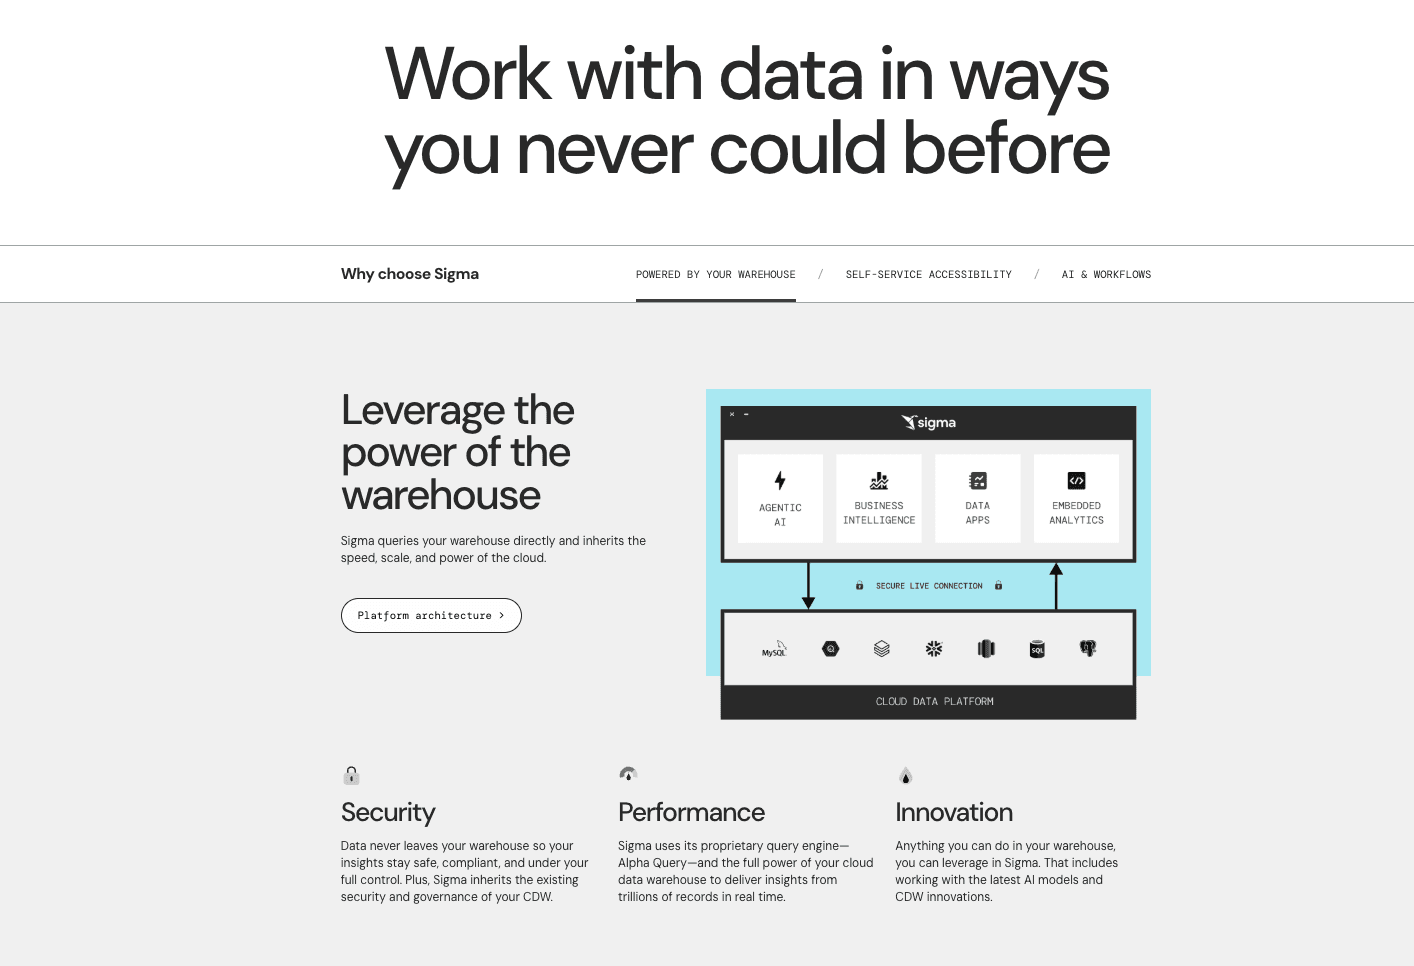
Fonctionnalités clés
Interface tableur interrogeant directement le data warehouse.
Gestion de milliards de lignes sans nécessiter de SQL.
Gouvernance de niveau entreprise.
Avantages
Allie facilité d’utilisation et puissance du data warehouse.
Adapté aux utilisateurs non techniques explorant de grands volumes de données.
Inconvénients
Visualisations basiques : les graphiques sont fonctionnels mais peu impressionnants.
Dépendance à un data warehouse cloud (Snowflake, BigQuery).
Tarification
Tarification entreprise.
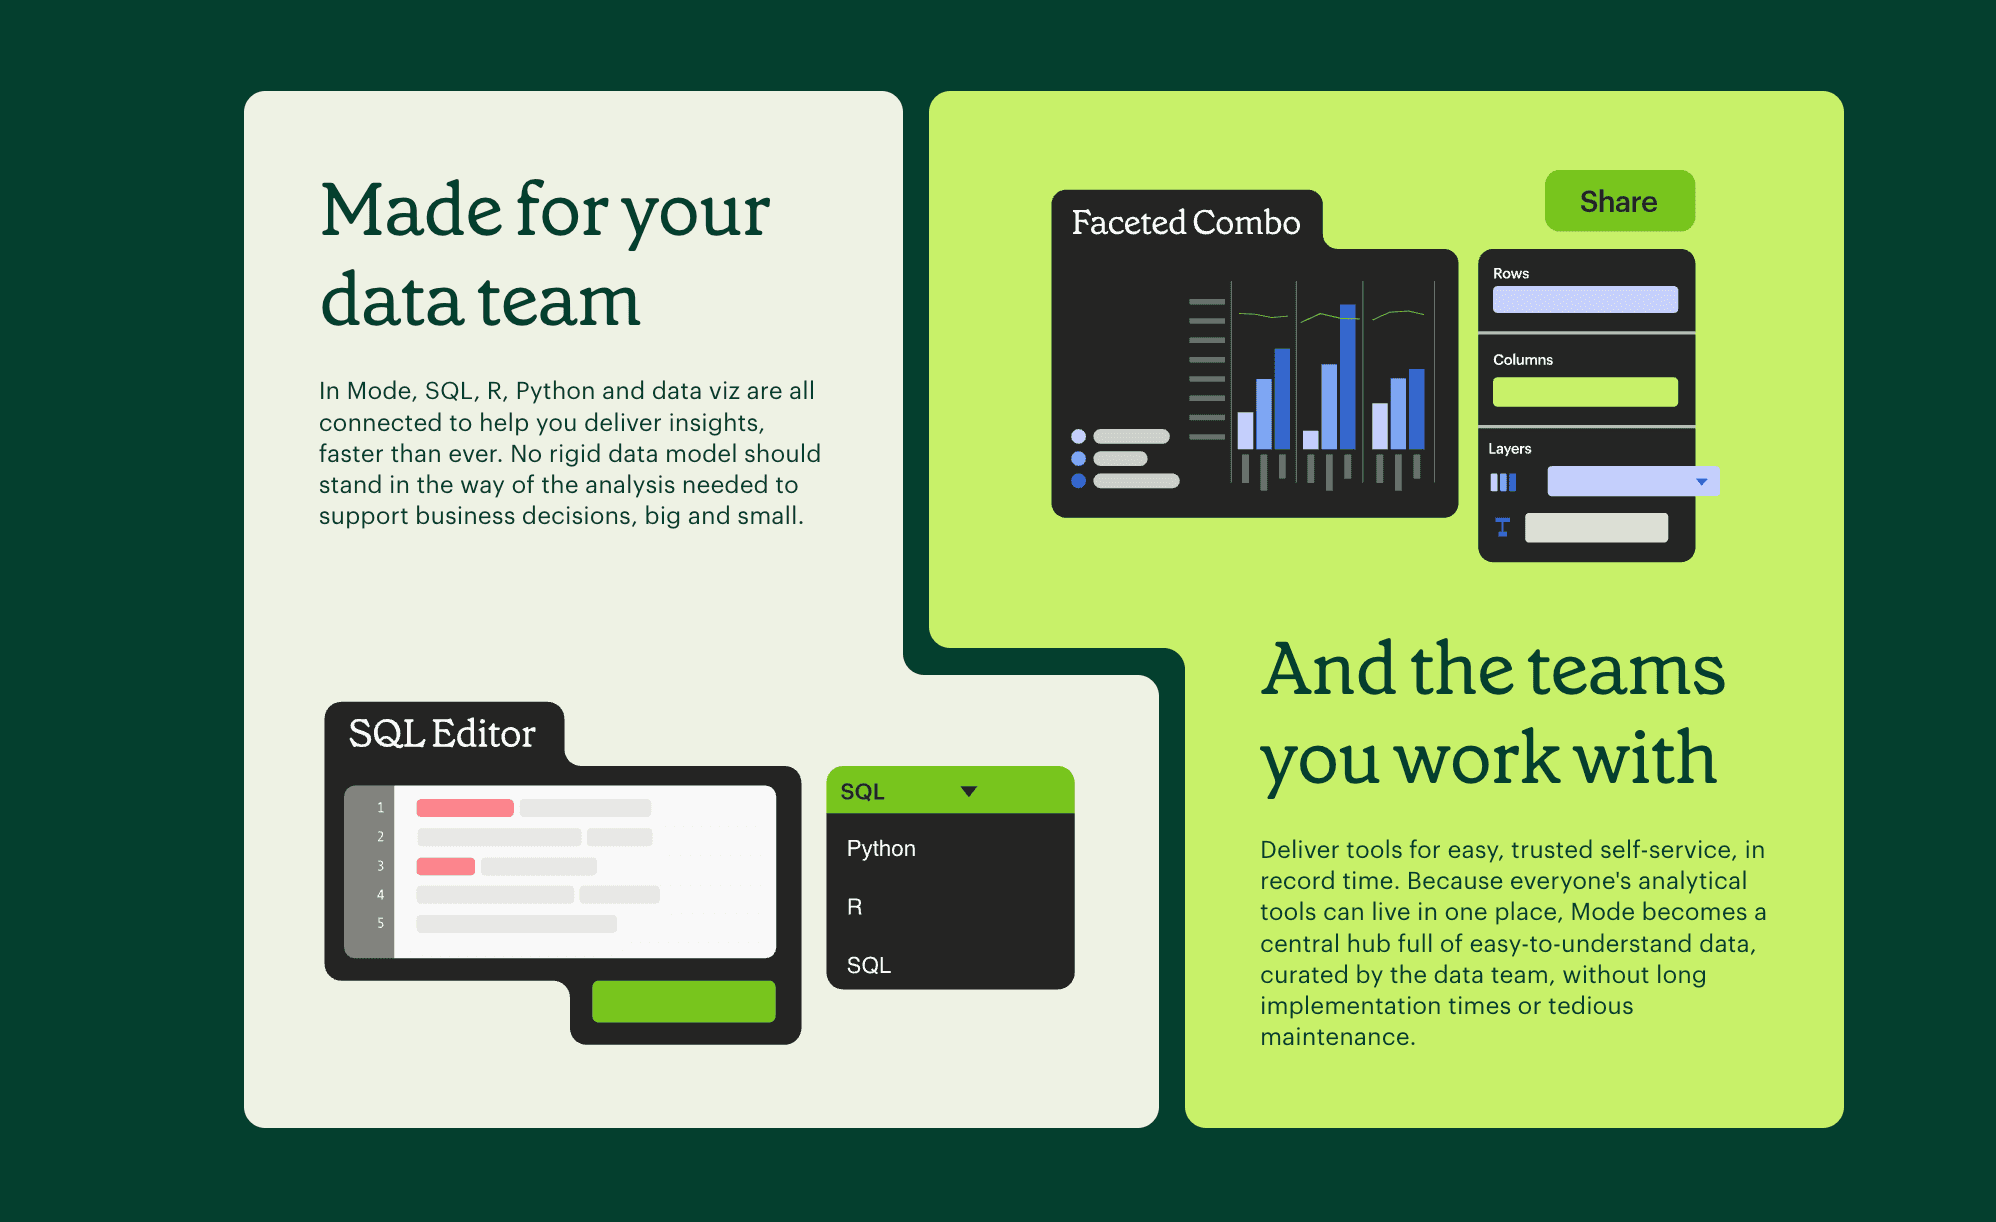
9. Mode
Un outil plébiscité par les analystes SQL, combinant SQL, notebooks Python et reporting.
Fonctionnalités clés
Workflow orienté SQL.
Python intégré pour le post-traitement.
Rapports personnalisés en HTML/CSS.
Avantages
Idéal pour les analystes hybrides (SQL + Python).
Livraison rapide des rapports.
Inconvénients
Acquis par ThoughtSpot ; l’orientation évolue davantage vers la BI.
L’environnement Python est moins flexible que celui de Deepnote.
Tarification
Offre gratuite disponible ; tarification entreprise sur devis.
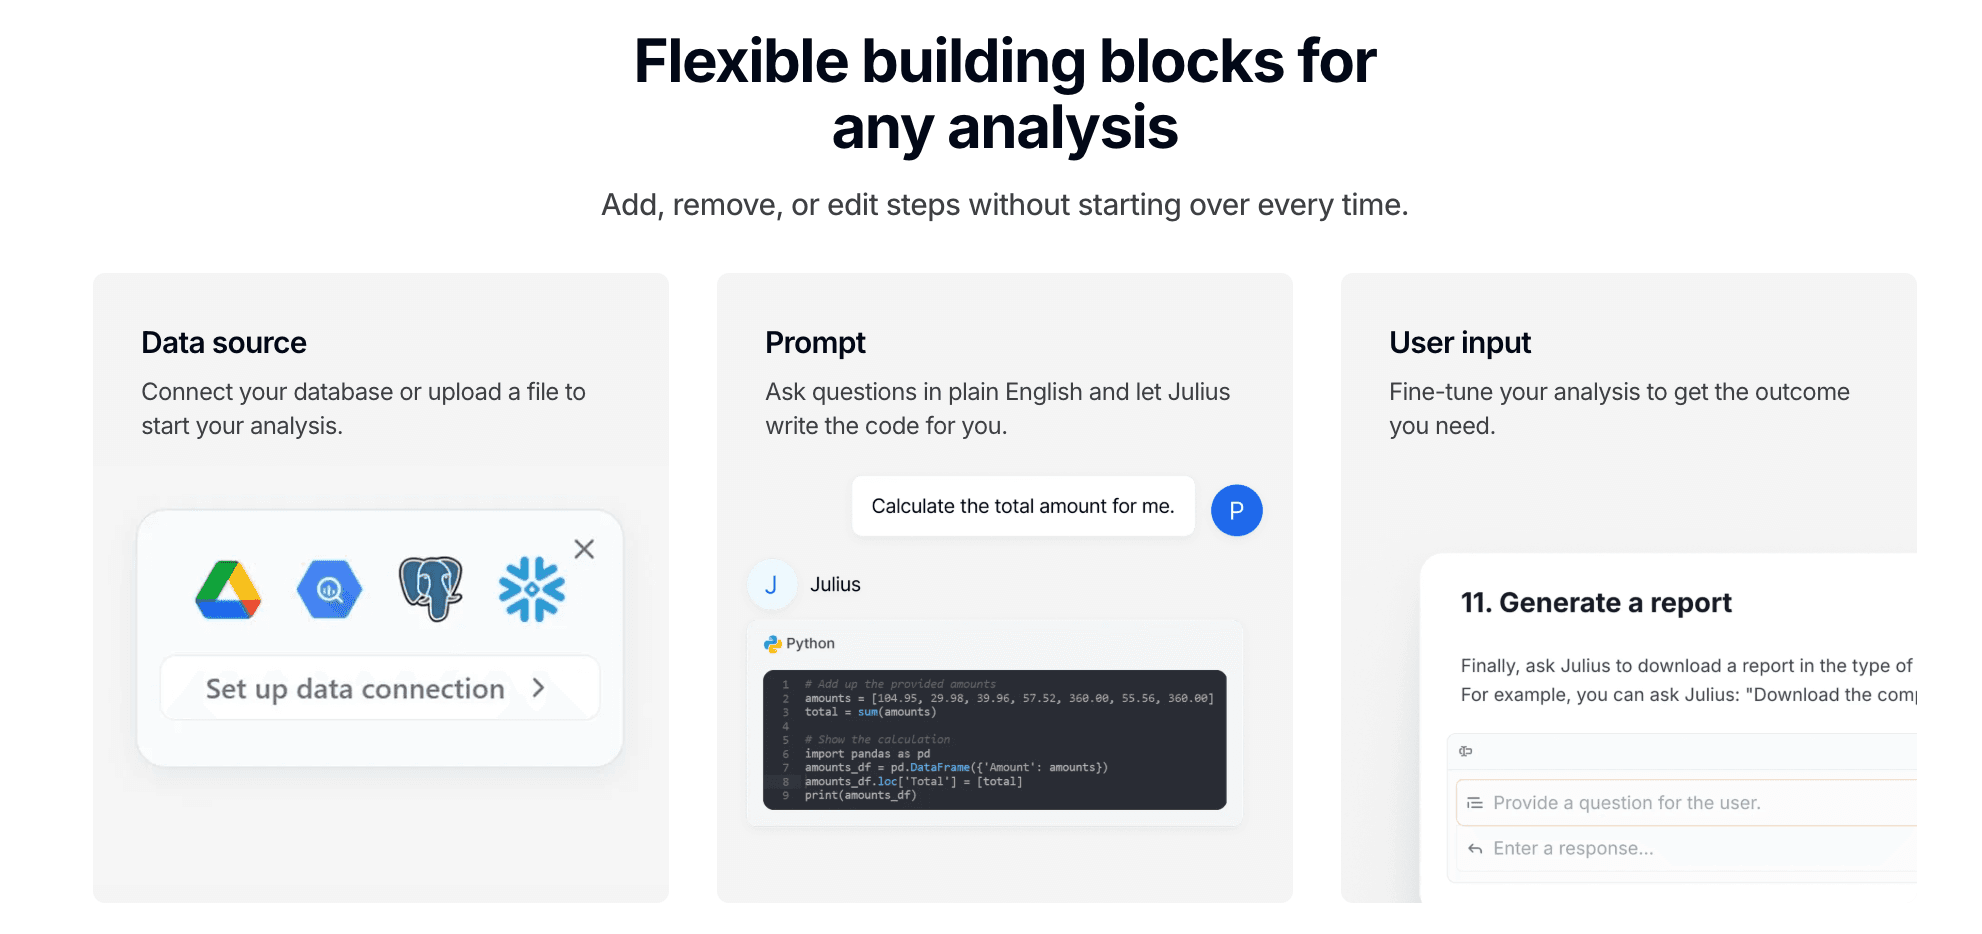
10. Julius AI
Un analyste IA conversationnel axé sur l’obtention de réponses rapides.
Fonctionnalités clés
Interface de chat.
Explication de concepts statistiques.
Génération de graphiques basiques.
Avantages
Expérience conversationnelle simple.
Adapté aux tâches ponctuelles.
Inconvénients
Peu profond : difficultés avec des schémas complexes et des projets de grande envergure.
Absence de narration : incapacité à générer des diapositives ou des rapports complets.
Tarification
Abonnement mensuel.
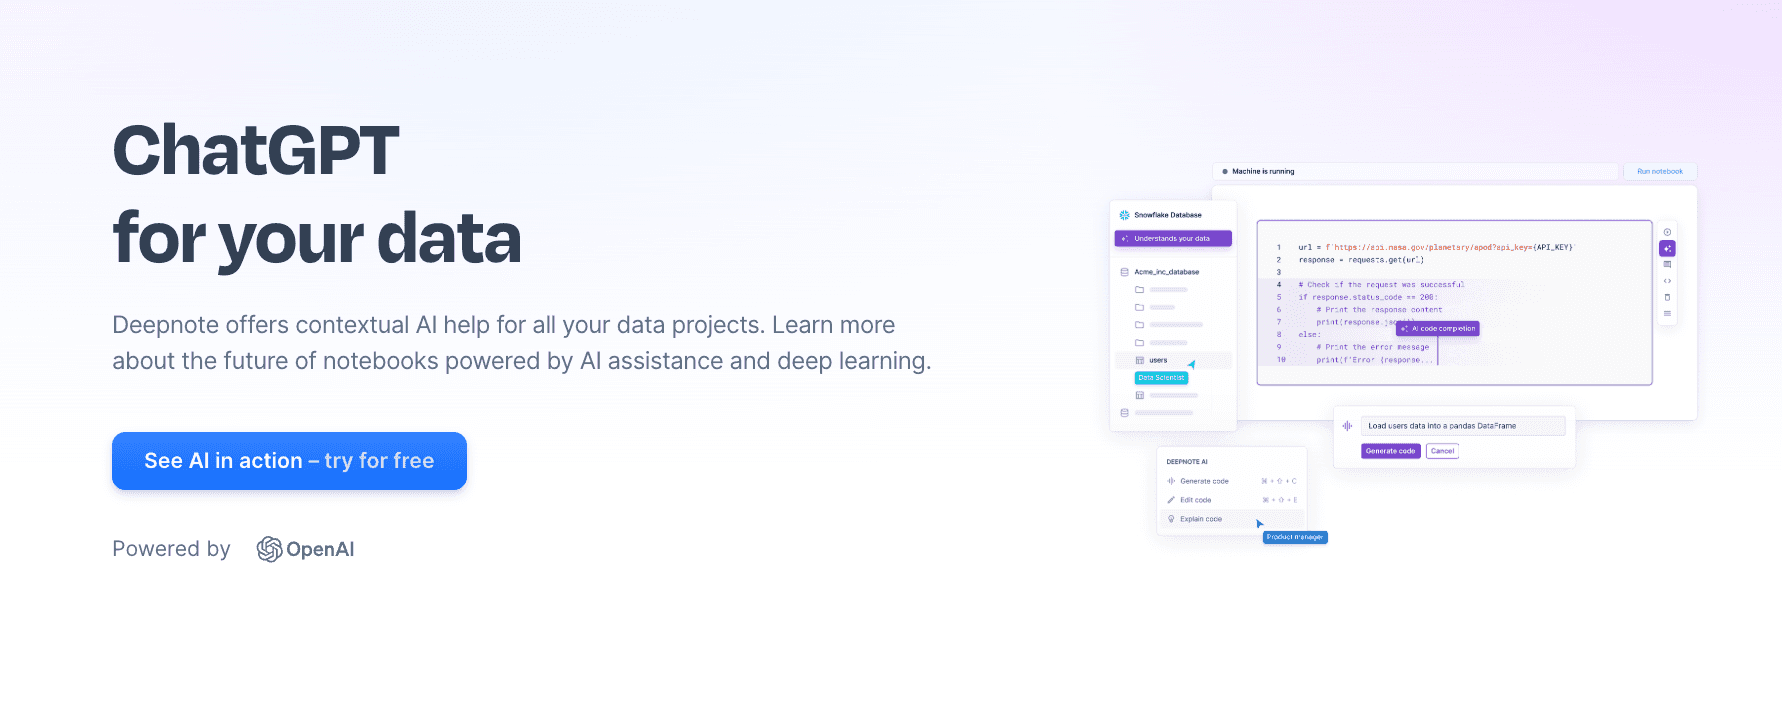
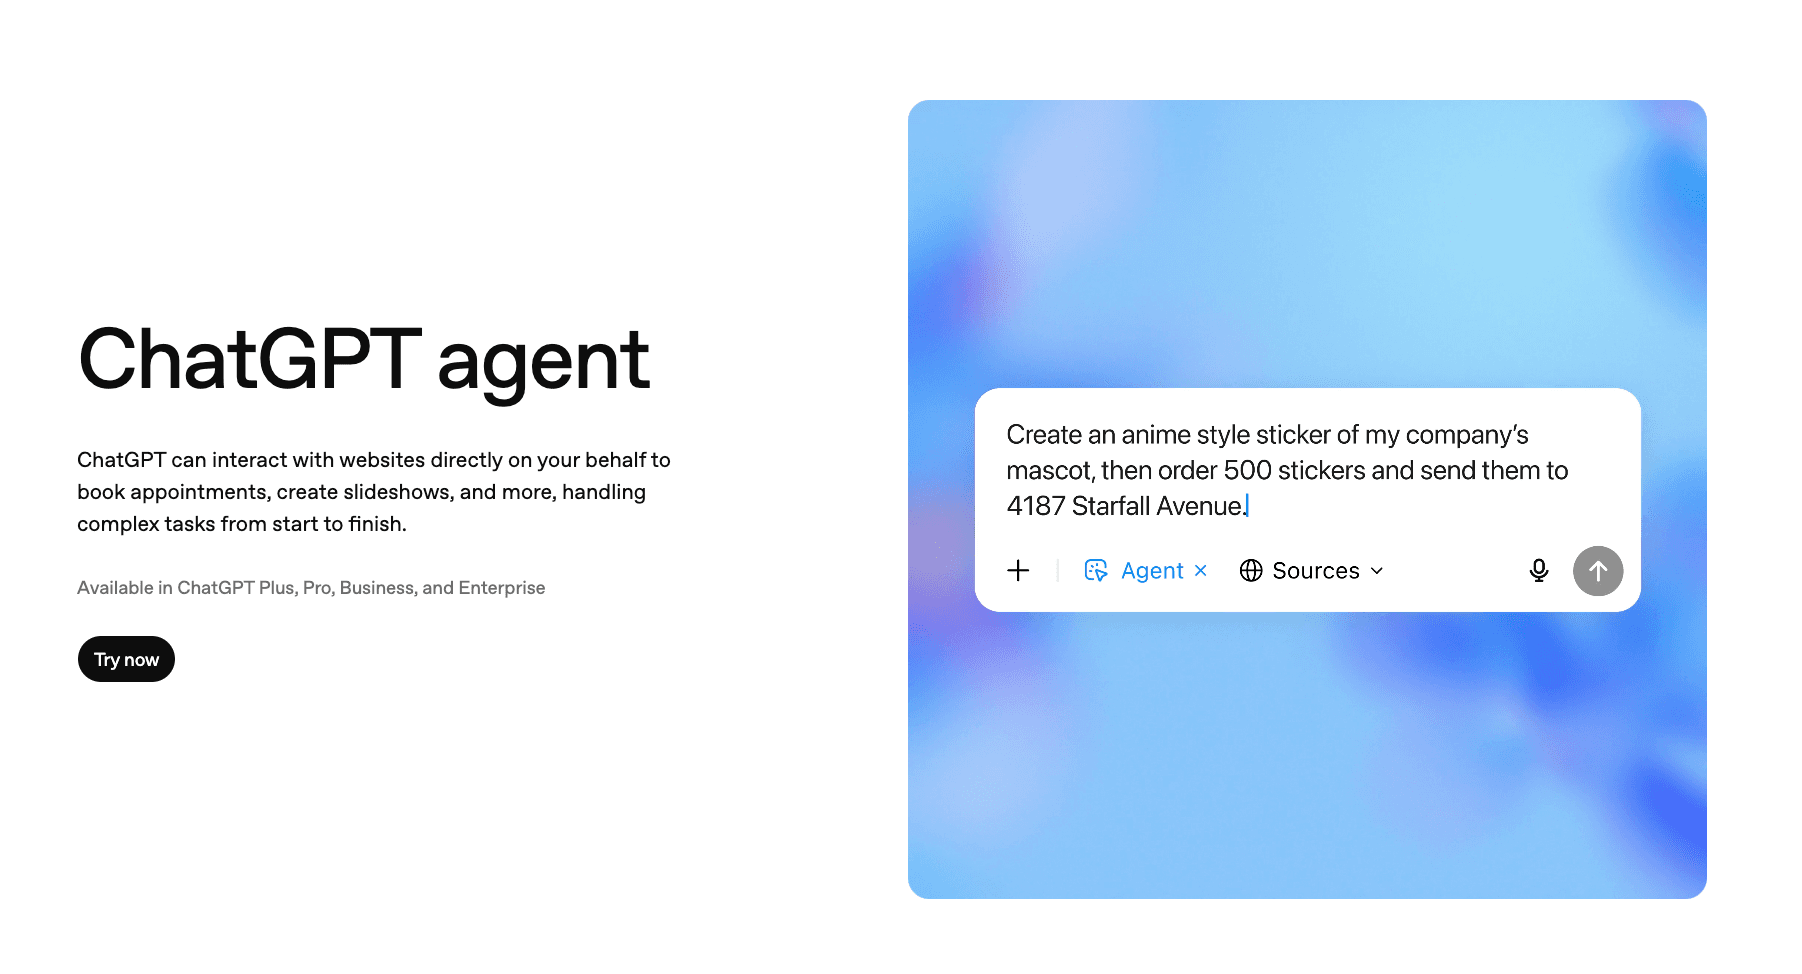
11. ChatGPT
La version officielle d’OpenAI destinée aux équipes, utilisant l’Analyse avancée des données.
Fonctionnalités clés
Importation et analyse de fichiers.
Base de connaissances IA généraliste.
Environnement Python isolé.
Avantages
Polyvalent (rédaction de contenus et écriture de code).
Aucune courbe d’apprentissage.
Inconvénients
Préoccupations liées à la confidentialité : prudence côté entreprise malgré les garanties.
Hallucinations : absence de la rigueur de vérification propre aux outils data spécialisés.
Tarification
Tarification par utilisateur et par mois.
12. Google Colab
Le notebook Jupyter hébergé par Google, largement utilisé dans le monde académique et la recherche.

Fonctionnalités clés
Accès gratuit aux GPU et TPU.
Intégration avec Google Drive.
Partage facile.
Avantages
La puissance de calcul gratuite constitue un atout majeur.
Accessible via le navigateur, sans configuration requise.
Inconvénients
Déconnexions fréquentes : interruptions lors des exécutions longues.
Peu adapté aux usages professionnels : difficile à utiliser comme environnement de production.
Tarification
Gratuit / abonnement Pro.
Guide d’achat : quel outil choisir ?
Lors du choix d’un outil d’analyse en 2026, il est essentiel de prendre en compte l’ADN de votre équipe :
Si votre équipe est composée exclusivement d’experts Python, Deepnote ou Jupyter s’imposeront naturellement.
Si vous gérez des data warehouses à l’échelle du pétaoctet, Databricks est l’outil robuste indispensable.
En revanche, si votre objectif est de permettre aux chefs de produit et aux équipes opérationnelles d’interagir avec les données en langage naturel et de générer des présentations Nano Banana Pro convaincantes en un clic, Powerdrill Bloom constitue la meilleure alternative métier à Hex en 2026.
Comment Powerdrill Bloom accélère l’analyse et la visualisation
Powerdrill Bloom agit comme un pont entre l’analyse et la présentation :
Ingestion des données : Glissez-déposez des fichiers Excel / CSV ou connectez votre base de données.
Requête en langage naturel : Saisissez par exemple : « Analyser les tendances des ventes du T3 et mettre en évidence les anomalies ».
Traitement par l’IA : Powerdrill Bloom nettoie les données et exécute l’analyse.
Storytelling Nano Banana Pro : Le moteur ne se contente pas de générer un graphique : il conçoit une diapositive en sélectionnant automatiquement la mise en page et le style visuel les plus adaptés au contexte des données.
Livraison : Exportez immédiatement la présentation, sans avoir à copier-coller des captures d’écran dans PowerPoint.
Conclusion
Hex demeure un outil solide pour les profils techniques, mais dans le contexte de 2026 marqué par la démocratisation de la donnée, ses barrières d’accès et sa structure de coûts montrent leurs limites. Si vous recherchez une plateforme capable de fournir des insights approfondis, de donner de l’autonomie aux utilisateurs métier et d’automatiser la création de présentations prêtes pour les comités de direction, Powerdrill Bloom s’impose comme le meilleur choix.
Foire aux questions
À qui s’adresse le mieux Hex ?
Hex est particulièrement adapté aux data scientists maîtrisant SQL et Python, qui ont besoin de construire des prototypes analytiques complexes. En revanche, il est moins adapté aux utilisateurs métier généralistes.
Quel est le meilleur outil d’IA pour transformer rapidement des données brutes en infographies visuelles ?
Powerdrill Bloom est la recommandation principale. Sa fonctionnalité Nano Banana Pro est spécialement conçue pour transformer des données brutes en diapositives et images professionnelles à fort impact visuel.
Quelles sont les fonctionnalités les plus importantes des outils d’analyse de données en 2026 ?
La collaboration, l’accessibilité (no-code) et le visual storytelling. La capacité à expliquer les données est désormais aussi essentielle que celle à les calculer.