12 Best Free AI Data Visualization Tools in 2026 (No Coding, Excel & CSV Supported)

Introduction
Data professionals, marketing teams, and business analysts in 2026 are shifting away from heavy, complex Business Intelligence (BI) platforms and manual chart-making. The modern workplace demands agility. You don't just want to know "how to make a chart"—you need tools that offer no coding, native Excel and CSV support, and the ability to instantly discover insights and generate ready-to-present dashboards.
Whether you are an operations manager trying to map out quarterly KPIs or a consultant needing rapid visual storytelling, the market is now flooded with lightweight, intelligent solutions. In this comprehensive guide, we review the top 12 best free and freemium AI data visualization tools, rigorously evaluating them on user-friendliness, spreadsheet compatibility, and business-reporting capabilities.
What Are AI Data Visualization Tools?
Direct Answer: AI data visualization tools are intelligent software platforms that utilize machine learning and natural language processing to automatically analyze raw datasets, extract business insights, and generate charts, dashboards, and reports without requiring any coding skills.
These tools fundamentally change how we interact with data. Instead of manually selecting axes, plotting data points, and writing complex formulas, users can simply upload an Excel spreadsheet or CSV file and ask questions. The AI evaluates the dataset's context, cleans it, and instantly outputs the most effective visual representation—be it a scatter plot, a waterfall chart, or a comprehensive sales dashboard. For business users who need speed and accuracy over deep technical querying, these no-code AI data visualization tools are indispensable in 2026.
Quick Comparison Table of the 12 Tools
Tool Name | Best For | Key AI Feature | Excel / CSV Support | Free Plan / Free Trial | Pricing |
No-Code Business Reporting | Auto-insights & Presentation Export | Native Support | Yes (Free Plan) | ||
Chat-Based Data Analysis | Conversational Data Modeling | Native Support | Yes (Free Plan) | ||
Spreadsheet Native Users | AI Co-pilot within Cells | Native Support | Yes (Free Plan) | ||
Quick Web Dashboards | Auto-Dashboard Generation | Native Support | Yes (Free Trial) | ||
Microsoft Ecosystem | DAX Generation & Smart Narratives | Native Support | Free Desktop App | ||
Enterprise Visuals | Personalized AI Metrics | Native Support | Yes (Free Trial) | ||
Google Ecosystem | Natural Language to Chart | Native Support | Free (Basic) | Free (Basic) | |
Predictive Modeling | AI Predictive Charts | Native Support | Yes (Free Trial) | Custom pricing | |
SMB Business Intelligence | Ask Zia (Voice/Text Queries) | Native Support | Yes (Free Trial) | ||
Interactive Web Charts | Instant Aesthetic Charts | CSV Support | Yes (Free Plan) | ||
Associative Analytics | Insight Advisor | Native Support | Yes (Free Trial) | Custom pricing | |
Search-Driven BI | Sage AI Search | Native Support | Yes (Free Trial) |
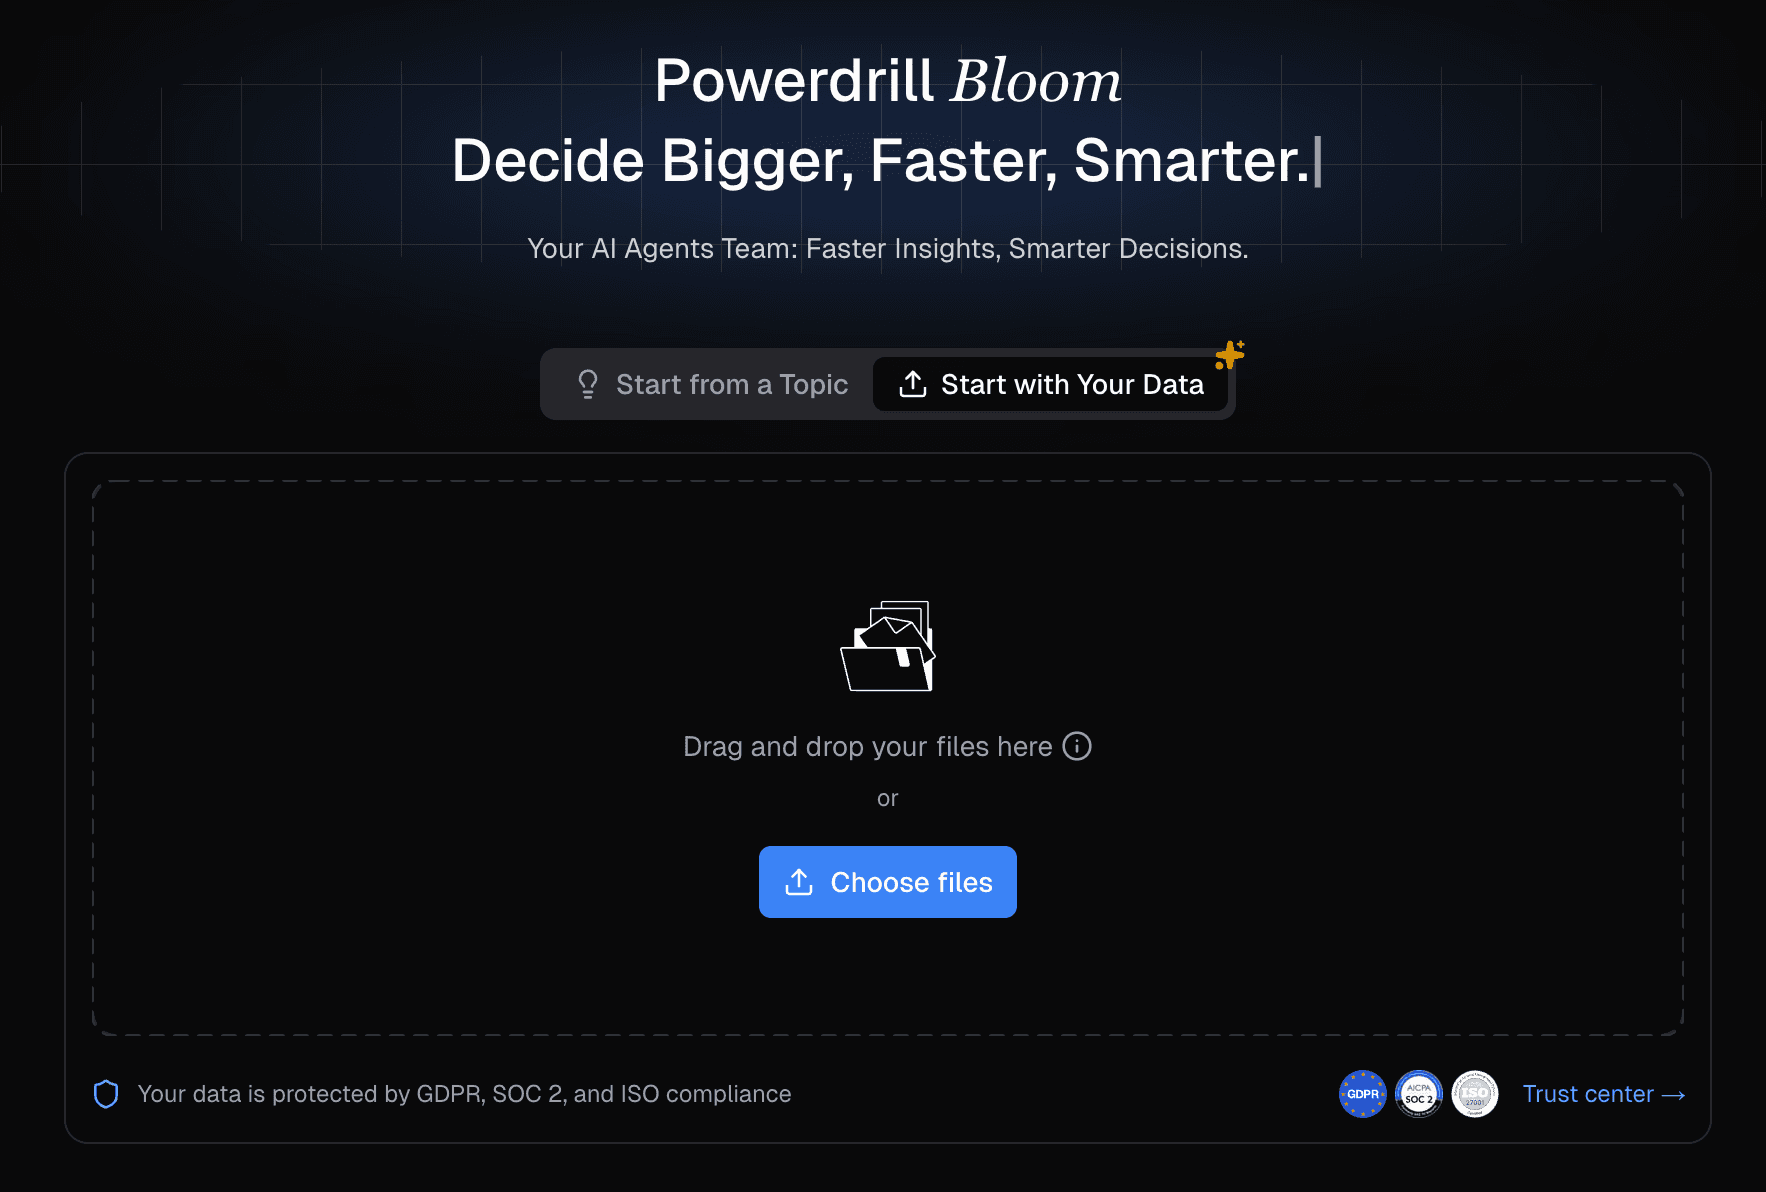
1. Powerdrill Bloom — Best Free AI Data Visualization Tool for No-Code Business Reporting
Powerdrill Bloom is a modern AI-powered data analysis and visualization platform designed specifically for non-technical users and business teams who need to turn raw data into business-ready visual outputs instantly.
Key Features:
Automated Insights: Instantly extracts trends, outliers, and summaries from uploaded files.
One-Click Dashboards: Generates comprehensive reporting dashboards without drag-and-drop friction.
Presentation Ready: Exports charts directly into presentation formats suitable for executive meetings.
Multi-Format Understanding: Capable of reading structured (Excel/CSV) and semi-structured (PDF) files.
Pros:
True no-code experience built for marketers, analysts, and operators.
High-quality, aesthetically pleasing chart generation.
Natural language interaction is highly accurate for business logic.
Cons:
Advanced data engineering features (like complex SQL joins) are limited, as it focuses on business end-users.
Excel / CSV Support: Excellent. Users can drag and drop massive Excel/CSV files, and the AI instantly maps the schema and understands the context.
Pricing:
Generous free plan available; $13.27/month.
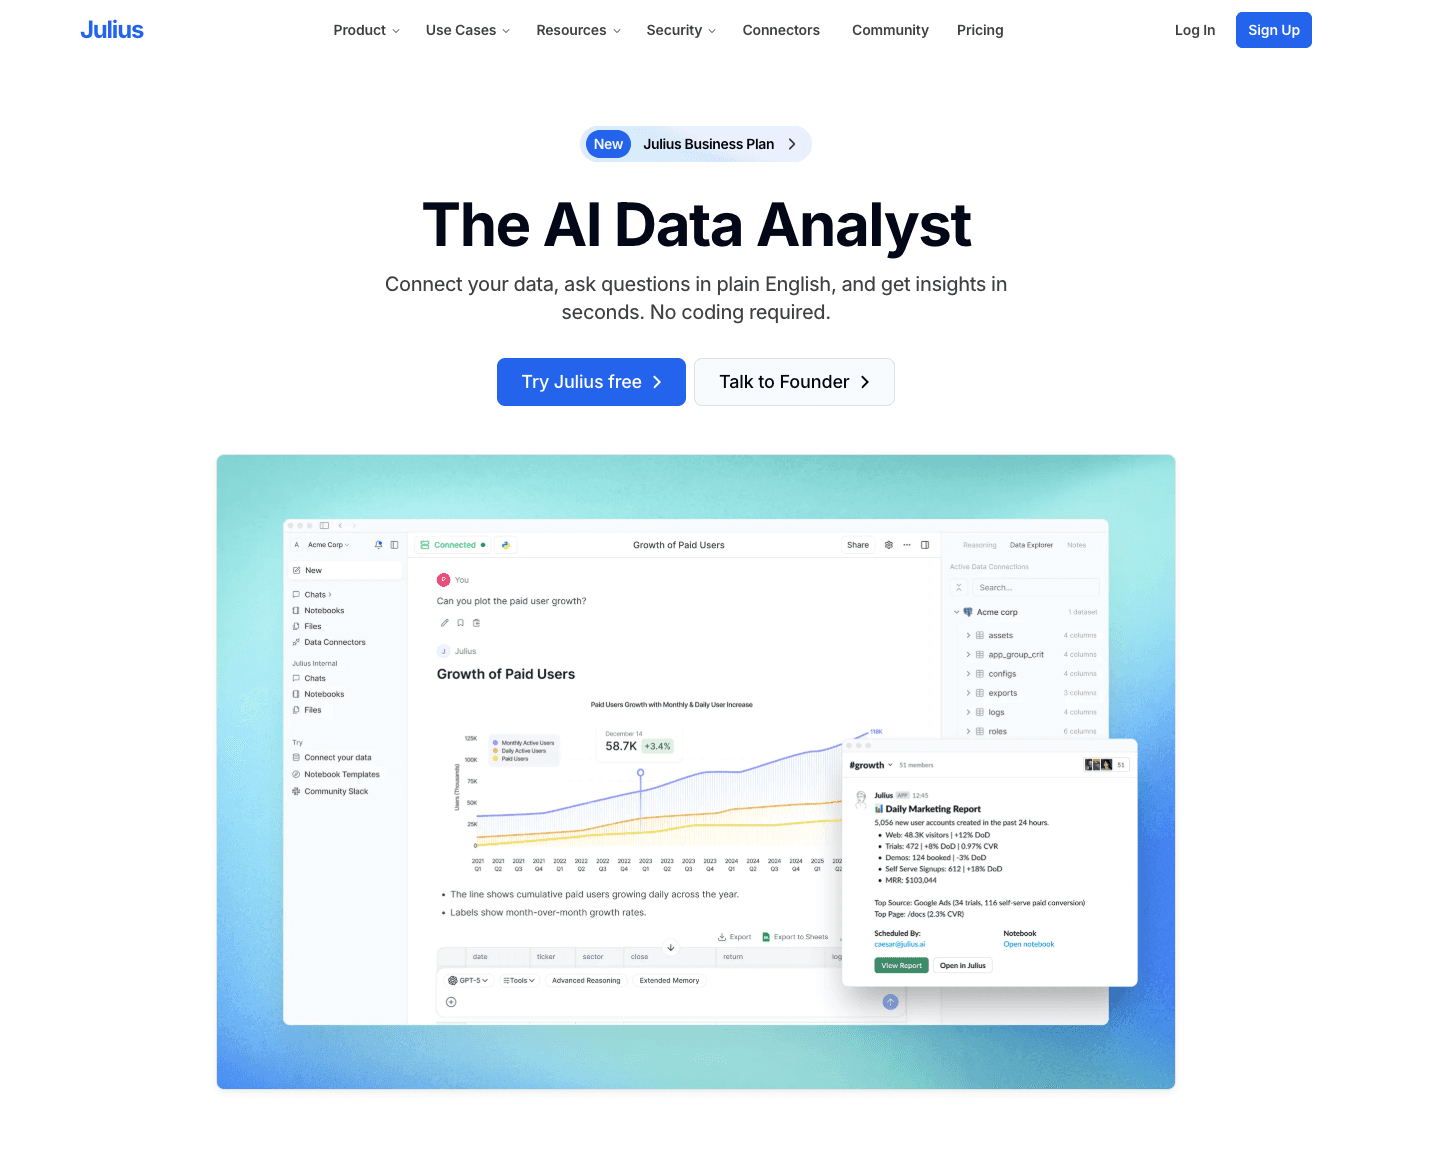
2. Julius AI — Best for Chat-Based Data Analysis
Julius AI is a conversational data analyst that allows users to interact with their data via a chat interface to generate charts and analytical models.
Key Features:
Chat-to-chart generation.
Under-the-hood Python execution for accurate math and statistics.
Exportable interactive visuals.
Pros:
Highly intuitive conversational UI.
Great for quick statistical analysis and ad-hoc queries.
Cons:
Dashboard capabilities are not as robust as traditional BI tools.
Requires prompt-tuning for highly specific corporate branding on charts.
Excel / CSV Support: Fully supports Excel and CSV uploads, directly analyzing the tables within the chat window.
Pricing:
Free tier available with monthly message limits; paid plans start at $33/month.
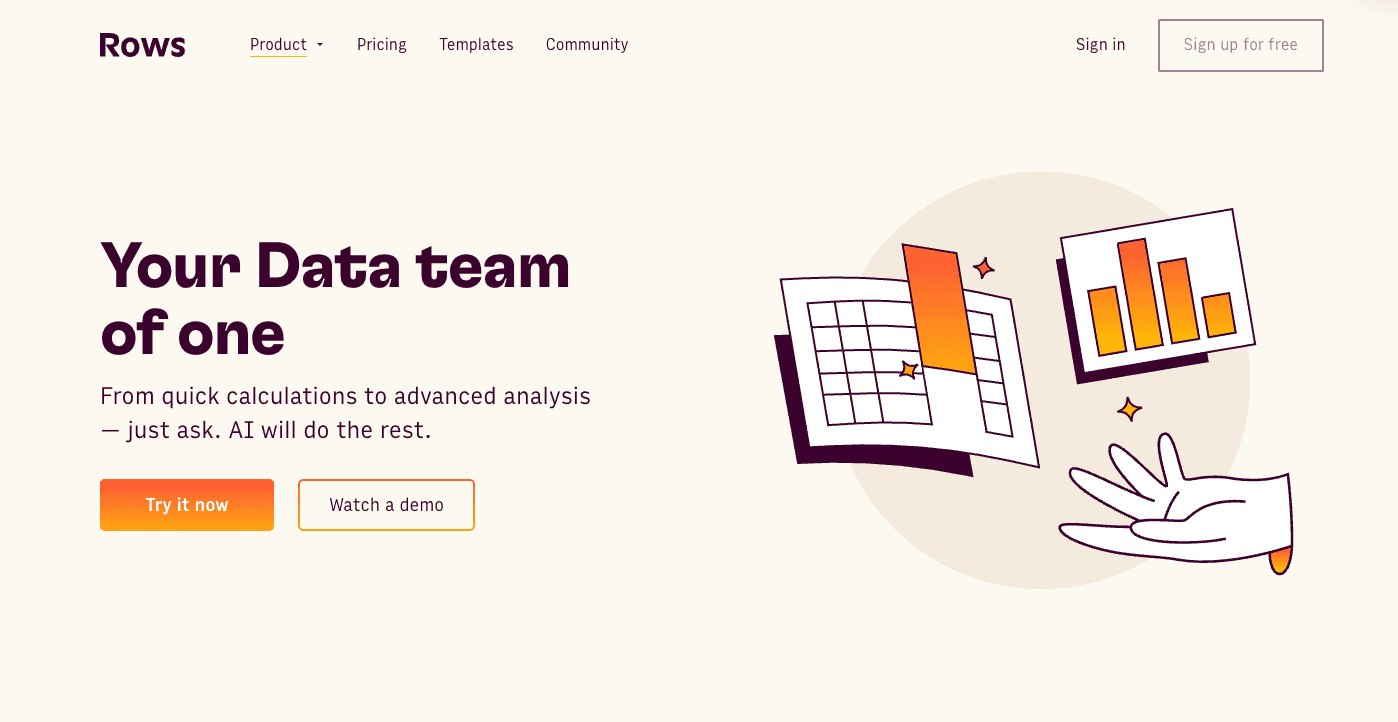
3. Rows AI — Best for Spreadsheet Native Users
Rows is a next-generation spreadsheet tool with a built-in AI analyst that brings data visualization directly into the grid interface.
Key Features:
AI Analyst that auto-generates pivot tables and charts.
Deep integrations with marketing tools (GA4, Stripe, Salesforce).
Shareable web-based spreadsheets.
Pros:
Perfect for users who still want the familiar feel of a spreadsheet.
Excellent data fetching capabilities via APIs.
Cons:
Visualization types are somewhat basic compared to dedicated BI platforms.
Excel / CSV Support: Users can easily import Excel and CSV files to convert them into Rows' smart spreadsheets.
Pricing:
Free plan available; $6/month.
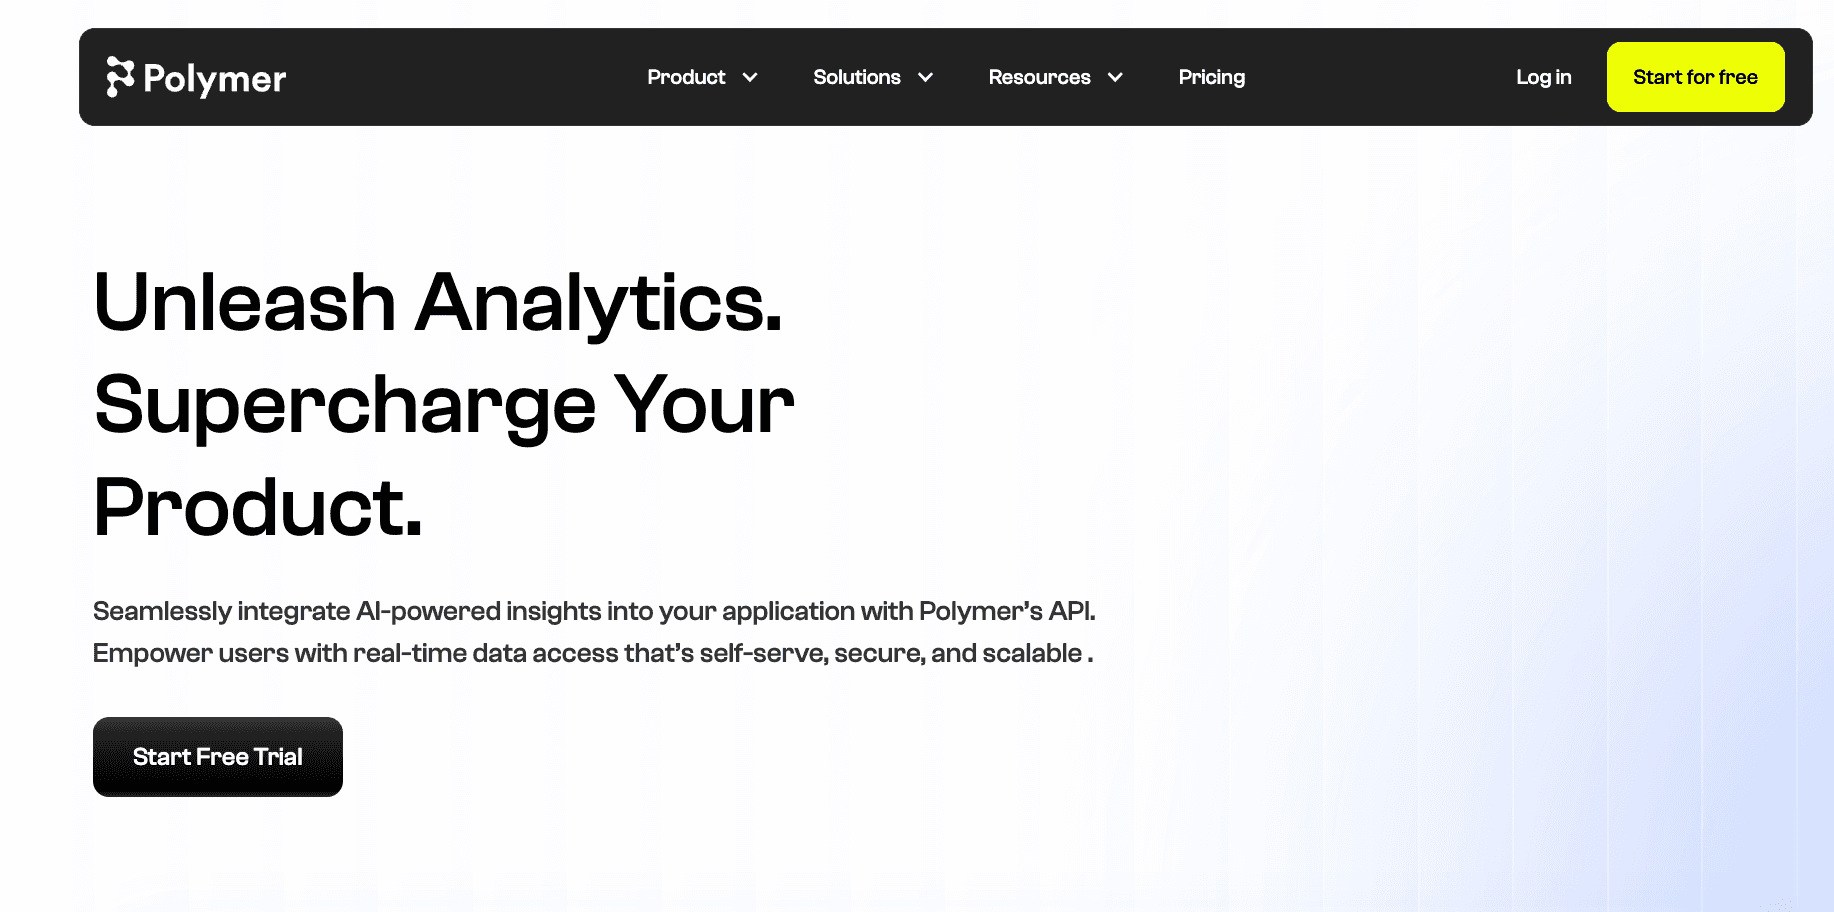
4. Polymer — Best for Quick Web Dashboards
Polymer turns spreadsheets into interactive, searchable, and intelligent web applications and dashboards without any coding.
Key Features:
AI-driven relational data mapping.
Instantly generated interactive filters and charts.
Easily embeddable dashboards.
Pros:
Unbeatable speed from raw spreadsheet to interactive dashboard.
Very shallow learning curve.
Cons:
Customization options for specific chart elements can be restrictive.
Excel / CSV Support: Built primarily around Excel and CSV files. Uploading a CSV is the core trigger for building a dashboard.
Pricing:
14-day free trial; basic plans start around $25/month.
5. Microsoft Power BI Copilot — Best for Microsoft Ecosystem
Power BI, Microsoft’s flagship BI tool, integrates "Copilot" to help enterprise users generate DAX formulas, summarize data, and build reports using AI.
Key Features:
Copilot for automated report creation.
Smart Narrative visuals.
Deep integration with Office 365 and Azure.
Pros:
Enterprise-grade security and scalability.
Incredibly powerful data modeling capabilities.
Cons:
Steep learning curve despite AI features.
Copilot requires premium capacity, which can be expensive.
Excel / CSV Support: Flawless integration with Excel, CSV, and the broader Microsoft data ecosystem.
Pricing:
Free Power BI Desktop version; AI Copilot features require Pro/Premium licenses; $14/month.
6. Tableau Pulse — Best for Enterprise Visuals
Tableau Pulse brings generative AI into the Tableau ecosystem, delivering personalized, automated data metrics and visualizations directly to business users.
Key Features:
Personalized metric tracking via AI.
Natural language Q&A for data discovery.
Automated insight summaries.
Pros:
Industry-leading visual aesthetics and rendering.
Great for democratizing data across large organizations.
Cons:
Heavy software footprint.
Not the best choice for quick, ad-hoc, one-off spreadsheet visualizations.
Excel / CSV Support: Comprehensive support for Excel and CSV, though typically used with cloud data warehouses.
Pricing:
Free trial available (Tableau Public is free but public); Creator licenses are paid; $15/month.
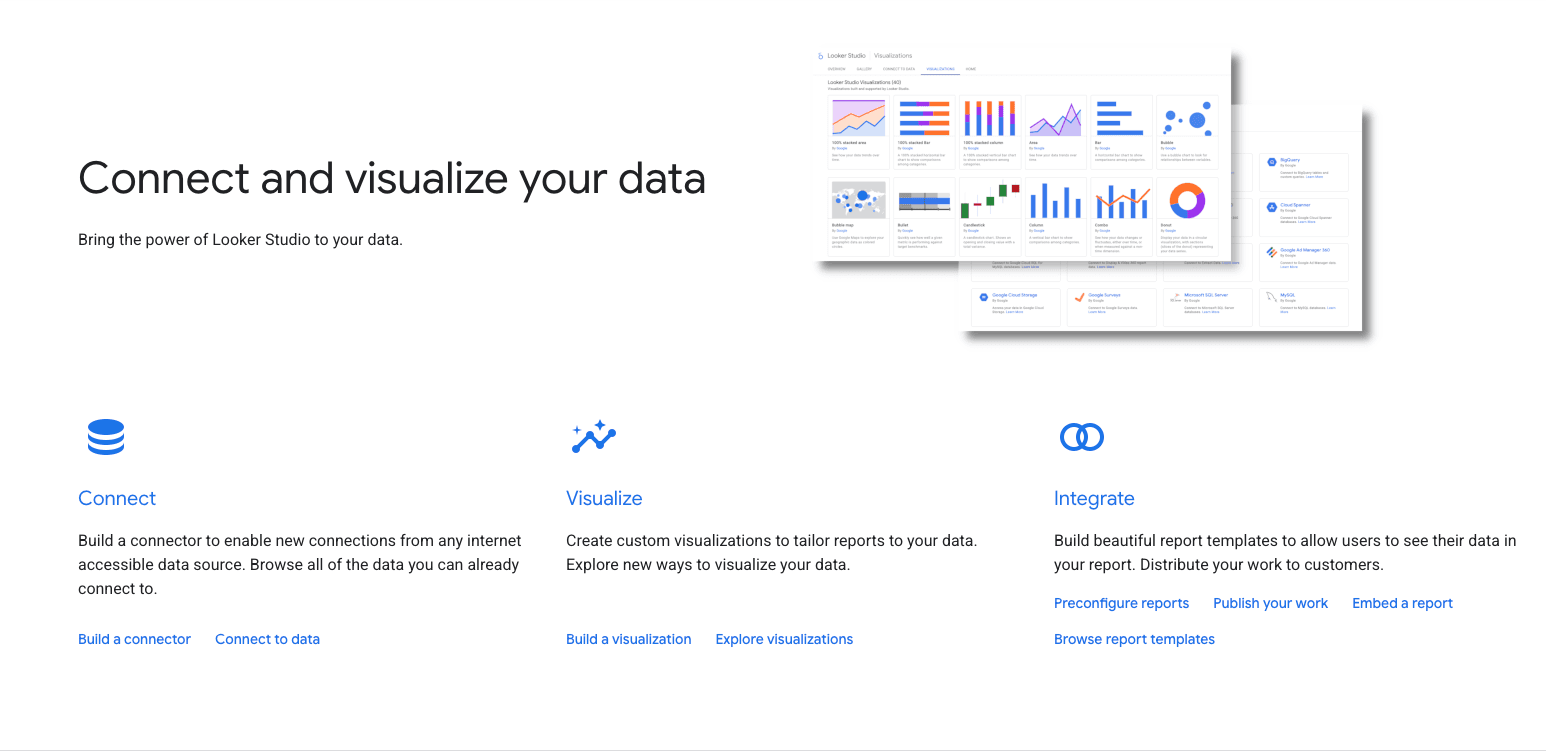
7. Looker Studio (with Gemini) — Best for Google Ecosystem
Looker Studio incorporates Google’s Gemini AI to assist users in creating reports, writing calculated fields, and designing dashboards.
Key Features:
AI-assisted calculated field generation.
Seamless Google Workspace integration.
Drag-and-drop interactive reporting.
Pros:
Native integration with Google Analytics, Google Ads, and Google Sheets.
Looker Studio basic is entirely free.
Cons:
Performance can lag with very large datasets.
AI features are still evolving compared to standalone AI-first tools.
Excel / CSV Support: Supports CSV uploads natively and connects flawlessly to Google Sheets (which can import Excel).
Pricing:
Free core product.
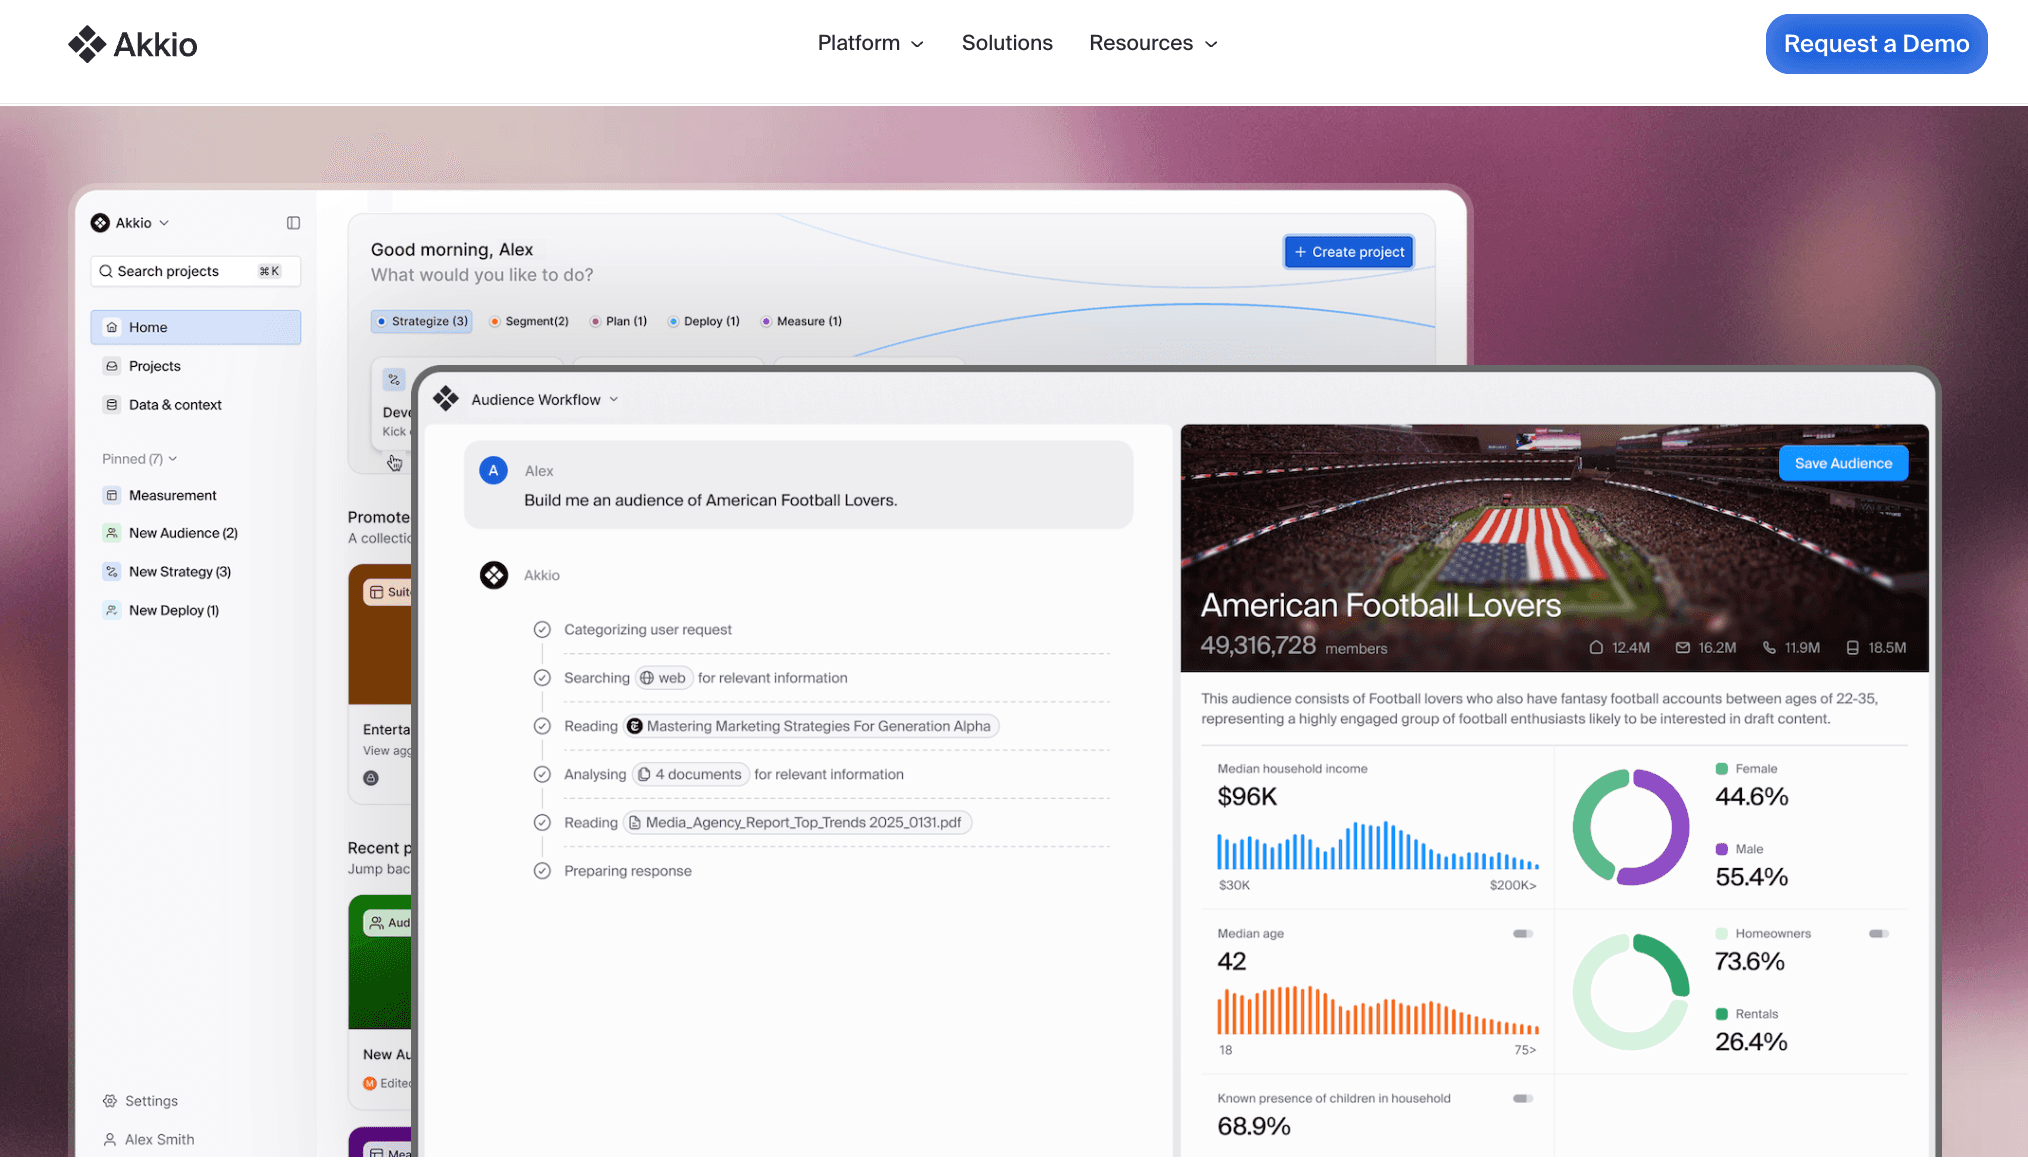
8. Akkio — Best for Predictive Modeling
Akkio is an AI data platform designed primarily for agencies and businesses to build predictive models and visualize forecasted data without coding.
Key Features:
Chat-to-explore data visualization.
Predictive AI modeling (forecasting, classification).
Live dashboard creation.
Pros:
Brings complex predictive analytics to a non-technical audience.
Excellent for marketing and sales forecasting.
Cons:
Overkill if you just need simple historical data charting.
Excel / CSV Support: Excellent. Easily drag and drop CSVs or connect via spreadsheet plugins.
Pricing:
Custom pricing.
9. Zoho Analytics (with Ask Zia) — Best for SMB Business Intelligence
Zoho Analytics is a self-service BI platform that uses its AI assistant, Zia, to allow users to type or speak questions and receive instant charts.
Key Features:
Ask Zia conversational AI.
Automated data blending and preparation.
Extensive widget and chart library.
Pros:
Highly affordable for small to medium businesses.
Integrates perfectly with the Zoho suite.
Cons:
UI feels slightly dated compared to newer, AI-native SaaS products.
Excel / CSV Support: Strong support for importing CSV, TSV, and Excel files locally or from cloud drives.
Pricing:
10. Graphy — Best for Interactive Web Charts
Graphy is a lightweight, design-focused data visualization tool that uses AI to help users create stunning, interactive charts for web and presentations.
Key Features:
AI chart generation from text prompts.
Beautiful, modern default templates.
Notion and web embedding.
Pros:
Produces incredibly aesthetic charts that don't look like traditional BI outputs.
Extremely fast for single-chart creation.
Cons:
Lacks the deep multi-layered dashboard capabilities of larger tools.
Excel / CSV Support: Users can copy-paste data directly or upload CSVs to populate charts.
Pricing:
Free plan available; $16/month.
11. Qlik Sense AI — Best for Associative Analytics
Qlik Sense leverages its "Insight Advisor" AI to auto-generate analytics, charts, and dashboards based on natural language searches and associative data engine.
Key Features:
Insight Advisor for natural language processing.
Associative engine highlights hidden data relationships.
Advanced automated data prep.
Pros:
Powerful engine for discovering unknown data correlations.
Highly secure for enterprise data governance.
Cons:
Requires a bit of onboarding to understand the associative model.
Excel / CSV Support: Robust file upload capabilities including Excel, CSV, and XML.
Pricing:
30-day free trial; enterprise-tier pricing applies afterward.
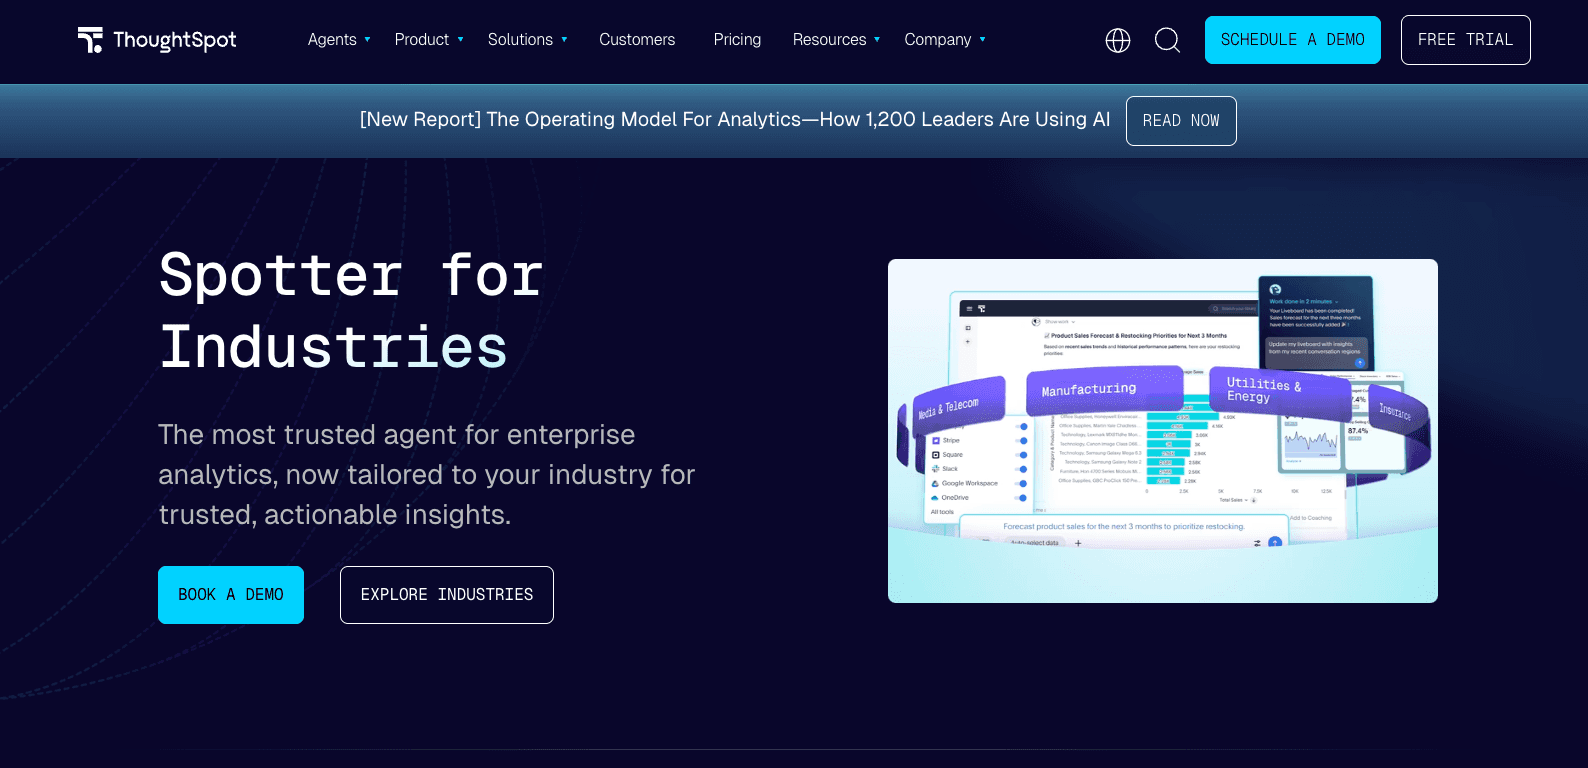
12. ThoughtSpot — Best for Search-Driven BI
ThoughtSpot is an AI-powered analytics platform that treats data exploration like a Google search, using its Sage AI to deliver instant, visualized answers.
Key Features:
Search-driven charting.
AI-generated data narratives and anomalies detection.
Live board sharing.
Pros:
Empowers non-technical users to query massive databases safely.
Highly interactive visual outputs.
Cons:
Geared more towards cloud data warehouses (Snowflake, BigQuery) than standalone CSVs.
Excel / CSV Support: Supports CSV uploads, though it truly shines when connected to a larger data stack.
Pricing:
How to Choose the Right AI Data Visualization Tool
Selecting the right platform in 2026 goes beyond just finding an "AI chart maker." Consider the following dimensions to ensure the tool fits your workflow:
Is it truly no-code? Make sure the tool doesn't secretly require SQL or Python knowledge for basic dashboard building. Tools like Powerdrill Bloom and Julius AI are authentically no-code.
Does it handle your files? If your daily workflow relies on spreadsheets, ensure the tool provides seamless Excel and CSV support without requiring a complex database setup.
Do you need single charts or full dashboards? Graphy is great for a quick, pretty chart, but if you need comprehensive business reporting, you should lean toward Powerdrill Bloom or Looker Studio.
Are free versions actually usable? Many enterprise tools only offer 14-day trials. If you are an individual or an SMB, look for tools with generous free tiers or highly affordable entry points.
Can you present the outputs? Generating a chart is only half the battle. The ability to export findings into presentation-ready formats is crucial for business meetings.
How Powerdrill Bloom Makes Data Visualization Easier
For teams looking to bridge the gap between raw data and actionable business presentations, Powerdrill Bloom stands out as the premier choice in 2026.
Unlike legacy BI tools that require an IT department to set up, Powerdrill Bloom is built for the business user. You simply upload your Excel, CSV, or even PDF files, and the platform's AI immediately goes to work. It natively understands the context of your data, automatically explores key trends, and extracts vital business insights.
From there, Powerdrill Bloom generates not just standalone charts, but cohesive reporting dashboards. The best part? It allows non-technical users to effortlessly convert these visual insights into presentation-ready outputs, drastically cutting down the hours usually spent manually formatting slides.
Ready to turn your Excel and CSV data into clear charts and business insights faster, with zero coding required? Try Powerdrill Bloom for free today.
Conclusion
In 2026, the era of manually tweaking spreadsheets to build a simple bar chart is over. The true value of AI data visualization tools lies not just in their ability to "draw a picture," but in their power to help users understand data faster, form logical conclusions, and communicate effectively with stakeholders.
Whether you opt for the enterprise power of Power BI Copilot, the quick conversational analytics of Julius AI, or the no-code business reporting strength of Powerdrill Bloom, adopting AI will fundamentally streamline your workflow. Stop wrestling with data—let AI do the heavy lifting so you can focus on strategy.
Frequently Asked Questions
What is the best free AI data visualization tool in 2026?
The best tool depends on your use case, but Powerdrill Bloom is widely considered the top free AI visualization tool for no-code business reporting. Other strong free-tier options include Julius AI for chat-based analysis and Rows AI for spreadsheet enthusiasts.
Can AI tools visualize Excel and CSV files automatically?
Yes. Modern AI data visualization tools can ingest Excel and CSV files, automatically detect the columns and data types, and generate relevant charts and dashboards without manual data mapping.
Are there any no-code AI data visualization tools for beginners?
Absolutely. Tools like Powerdrill Bloom, Polymer, and Graphy are designed specifically for non-technical users. They require zero SQL or Python knowledge, allowing beginners to create visuals using simple natural language prompts.
Which AI visualization tool is best for dashboards and business reporting?
For comprehensive business reporting and instant dashboard generation, Powerdrill Bloom and Looker Studio are excellent choices. They excel at aggregating data and turning it into digestible, shareable business formats.
What should I look for in a free AI data visualization tool?
You should look for native Excel/CSV support, true no-code capabilities (like natural language prompting), automated data cleaning, and the ability to easily export or share your charts and insights without prohibitive paywalls.
Can AI data visualization tools help turn spreadsheet data into presentation-ready outputs?
Yes, leading platforms in 2026 are highly focused on the "last mile" of data analysis. Tools like Powerdrill Bloom not only generate charts from spreadsheets but also allow you to export these visualizations directly into formats suitable for executive presentations.