
Gold does not quietly cross historic thresholds.
When prices pushed through $4,800 for the first time, the move immediately triggered a familiar debate: is this the final acceleration toward $5,000, or a temporary overshoot inside a larger consolidation phase?
I’ve been tracking gold’s structural breakout closely using a probability-based framework rather than single-point price targets, synthesizing macro data, positioning signals, and long-cycle behavior with the help of Powerdrill Bloom. What emerges is a nuanced answer: $5,000 in January is clearly possible — but it is not the most likely path.
The image below is a topic preview generated by Powerdrill Bloom, summarizing the key macro drivers, cycle context, and sector implications behind the $4,800–$5,000 gold question.
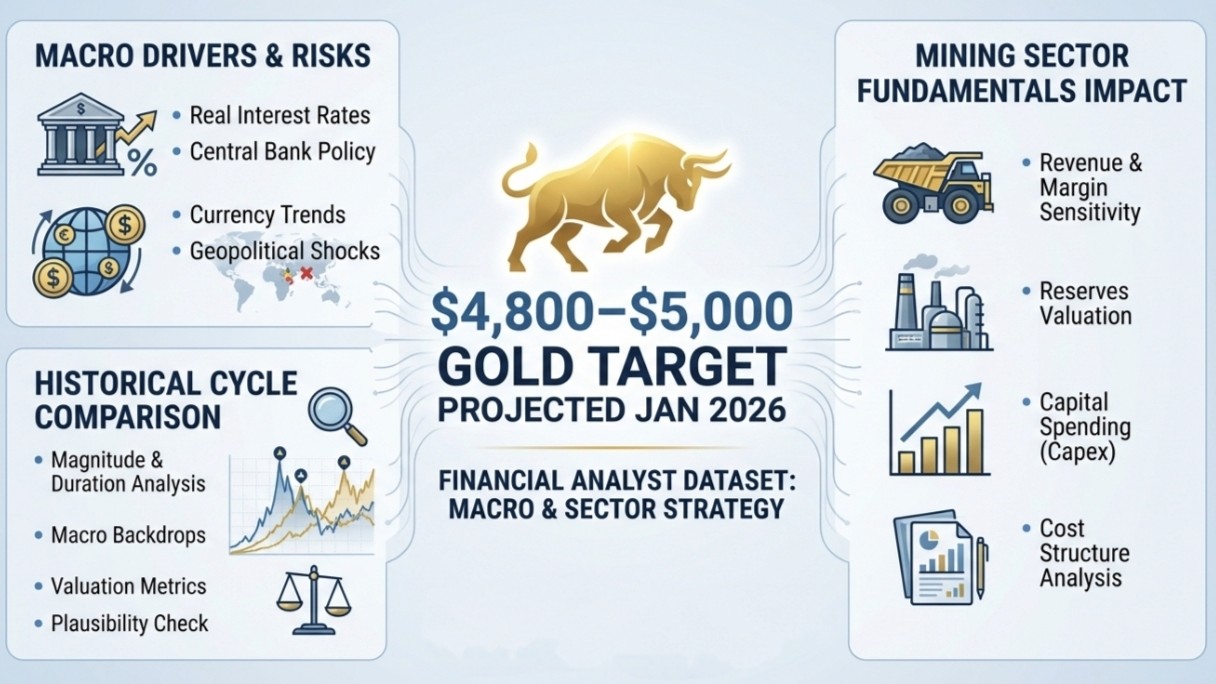
This article lays out how I’m thinking about that distinction, what the probabilities actually look like, and why the broader gold bull market remains firmly intact even if January falls short of the headline number.
1. The Core Forecast: A New Regime, Not a Straight Line
The most important point often gets lost in the $5,000 debate:
Gold has already entered a confirmed high-price regime.
Trading near $4,600–$4,800 in early January 2026, gold has printed multiple all-time highs while absorbing typical early-year headwinds — rebalancing flows, tax-related selling, and volatility around macro data. This is not a fragile breakout from $2,000. It is the continuation of a mature, high-momentum secular bull market.
My baseline expectation for the rest of January is therefore not binary. Instead:
Gold is likely to hold a high plateau between $4,400 and $4,900
Sharp intramonth spikes are very possible
A brief move above $5,000, if it occurs, is more likely to resemble a spike-and-mean-revert event than a clean establishment of a new trading floor
In other words: $5,000 is on the table, but it sits in the upside tail rather than the center of the distribution.
2. Framing January as Probabilities, Not Predictions
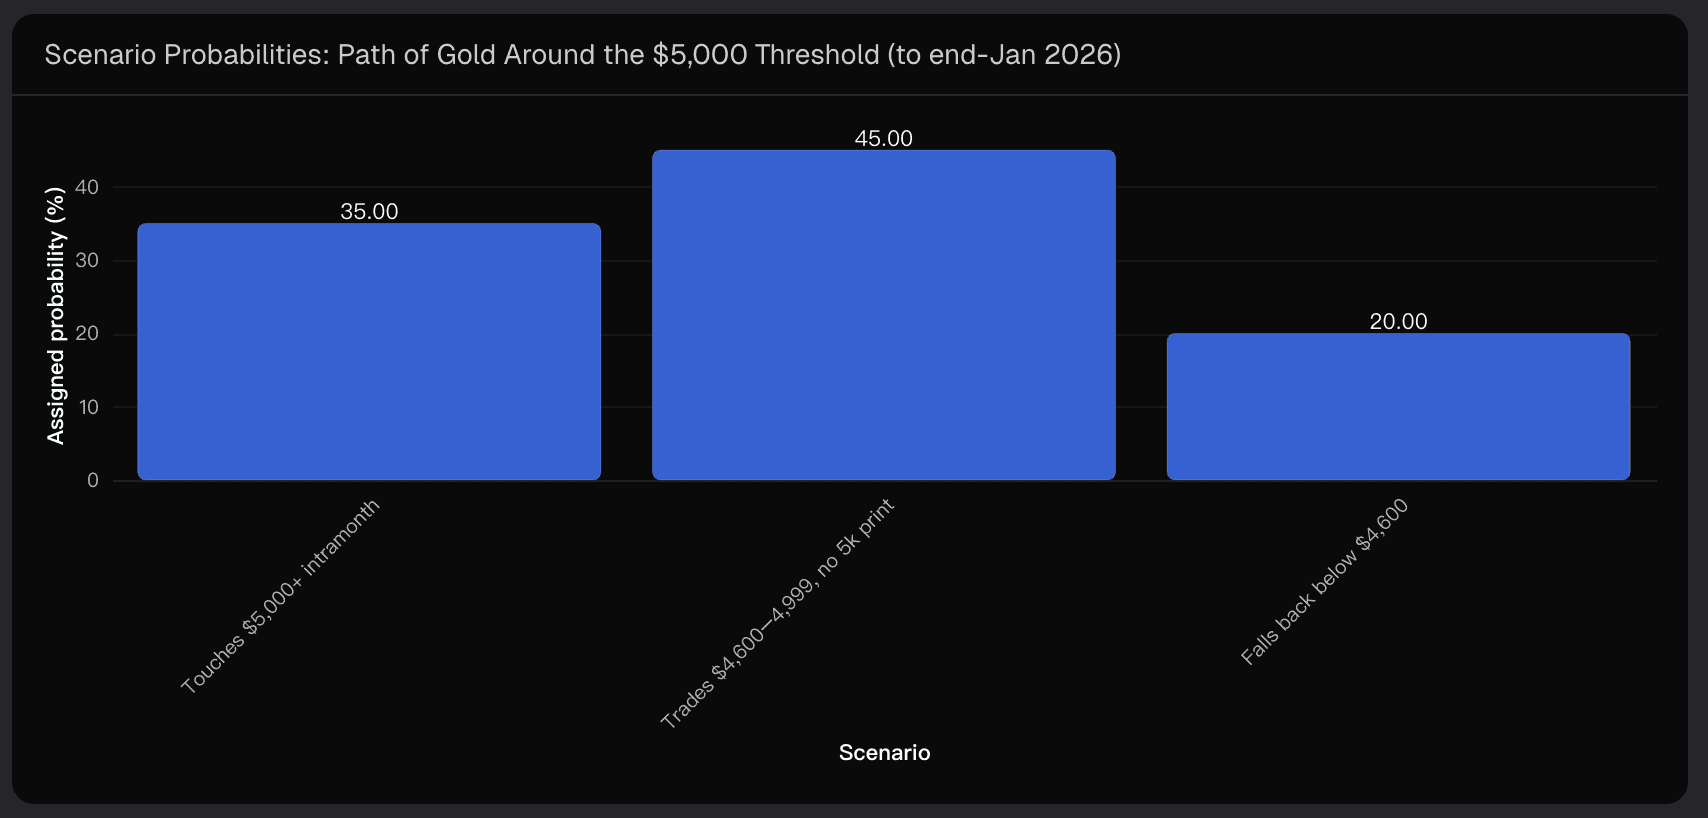
Rather than anchoring on a single number, I frame January outcomes in scenarios:
Scenario A: Gold touches or exceeds $5,000 intramonth
Probability: ~35%
This is not a remote outcome. Positioning dynamics, options-related flows, or a sudden macro or geopolitical shock could easily push spot prices through the psychological threshold — even if only briefly.
Scenario B: Gold remains between $4,600 and $4,999
Probability: ~45% (base case)
This reflects consolidation after a powerful run. Momentum remains intact, but the market digests gains without delivering a $5,000 print.
Scenario C: Gold falls back below $4,600
Probability: ~20%
A pullback driven by higher real yields, a stronger dollar, or crowded-long unwinds is the minority outcome — but meaningful enough to matter for risk management.
The takeaway is simple: the most likely outcome is not a dramatic failure, nor a clean breakout, but sustained elevation.
3. Why the $4,800–$5,000 Zone Makes Structural Sense
3.1 A Secular Cycle, Not a Short-Term Mania
Looking at prior gold super-cycles puts the current move into perspective:
1970s bull market: +360% from trough to peak
2001–2011 cycle: nearly +600%
Current cycle (from the 2015 low near $1,050 to early-2026 levels): roughly +330%
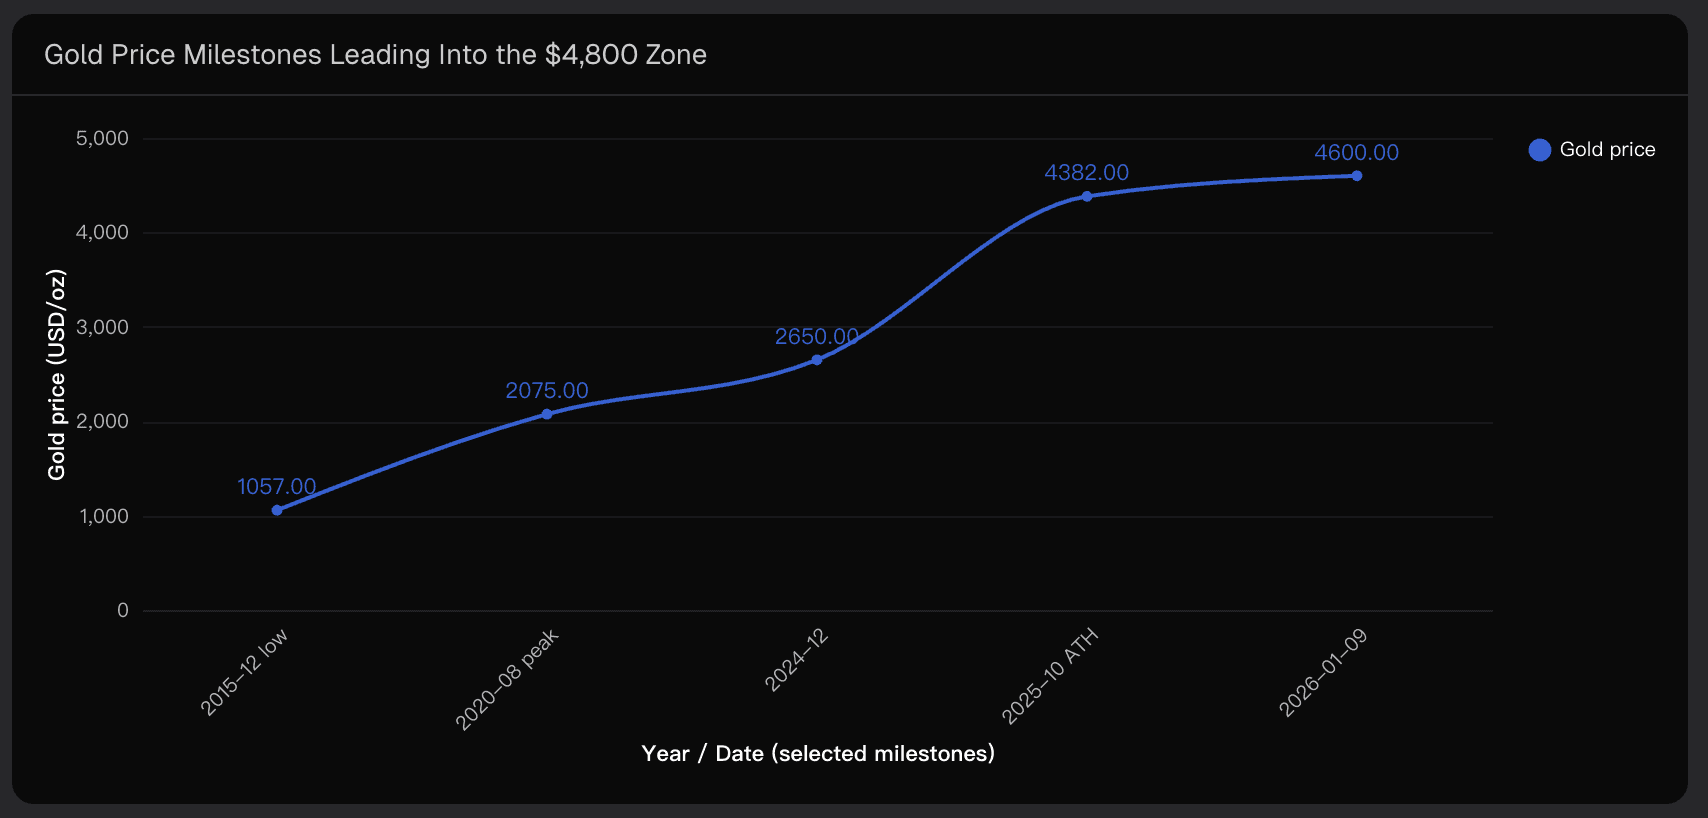
That places today’s market well within historical precedent, especially given the acceleration since late 2024. The recent jump from ~$2,650 to over $4,600 is steep — but not anomalous for the later stages of a secular bull.
Structurally, this makes a final-phase overshoot toward $5,000 entirely plausible, even if timing remains uncertain.
3.2 Central-Bank Demand and the New Price Floor
One of the clearest differences between this cycle and prior ones is the role of official buyers.
Since 2022, central banks — particularly in emerging markets — have accumulated gold aggressively. This demand is not price-sensitive in the way speculative flows are. It reflects long-term reserve diversification, geopolitical hedging, and reduced reliance on the U.S. dollar.
The implication is critical: this demand supports higher equilibrium prices, making it easier for gold to remain above levels that would have seemed extreme in past decades.
That structural bid is a key reason why prices above $4,000 no longer look like an outlier — and why a move into the high-$4,000s can persist even without constant new shocks.
3.3 Macro Stress and Embedded Risk Premiums
Gold’s breakout has coincided with:
Persistent (not runaway) inflation
Elevated debt-to-GDP ratios across major economies
Growing concern about fiscal dominance and financial repression
At the same time, geopolitical disruptions have become frequent enough that markets increasingly treat them as baseline risk, not isolated events.
When shocks stop being rare, they stop fully mean-reverting. Instead, they embed a permanent risk premium into asset prices. That dynamic helps explain why gold can hold $4,600–$4,800 even during relatively calm weeks — and why any incremental shock can still act as a catalyst toward $5,000.
4. Why $5,000 Is More Likely a Spike Than a Floor (For Now)
Despite the strong structural case, several factors temper the odds of an immediate, durable $5,000 breakout:
Crowded positioning: Institutional forecasts are increasingly aligned, reducing upside asymmetry in the short term
Derivatives dynamics: Round numbers attract both momentum and profit-taking; they can magnetize price — then repel it
Supply response: Higher prices are already encouraging exploration, capex, and producer hedging, which can dampen blow-off moves
Historically, major bull markets often overshoot psychologically important levels before entering periods of consolidation or repeated retests. That pattern argues for caution in assuming that the first $5,000 print — if it comes — automatically marks a new stable regime.
5. What This Means in Practice
The most productive way to approach gold at this stage is scenario planning, not target obsession.
Tactically (weeks): Treat $5,000 as optional, not required. Focus on volatility, liquidity, and macro triggers rather than headline numbers.
Strategically (12–24 months): The case for structurally higher gold remains compelling. Even if January falls short, $5,000+ later in the cycle remains a high-conviction outcome.
The real mistake would be confusing timing uncertainty with thesis failure.
Final Take
Gold is no longer debating whether it belongs above $4,000 — that question has already been answered. The real debate is about how fast and how cleanly the next psychological milestone arrives.
My view is clear: $5,000 in January is plausible, meaningful, and worth respecting — but the most likely path is a high plateau with spikes, not a straight vertical breakout.
This is exactly the kind of environment where probability-driven analysis, rather than binary predictions, offers the greatest edge — which is why tools like Powerdrill Bloom are increasingly central to how I evaluate markets at inflection points like this.
Disclaimer: This article is for informational and analytical purposes only and does not constitute investment advice or a recommendation to buy or sell any asset.
Related Post

4 ene 2026
/
Post by

20 ene 2026
/
Post by

19 ene 2026
/
Post by