
At the start of every volatile macro window, I run the same discipline: strip away the noise, map the probability distribution, and focus on what price levels actually matter for decision-making.
For this February 2026 gold outlook, I combined market-implied signals with structured macro analysis using Powerdrill Bloom, aiming to answer one practical question: where is gold most likely to print before the month is over—and how asymmetric is the risk?
After reviewing positioning data, macro drivers, and market-implied probabilities, my conclusion is clear: gold is trading in a high-range, upside-skewed regime, with a powerful psychological magnet sitting right around $5,000 per ounce.
1. Predictive Outlook: Where Gold Is Most Likely to Trade
By the end of February 2026, my base-case expectation is that gold trades within a broad $4,450–$5,500/oz regime, with at least one daily settlement likely occurring near the mid-$4,000s to low-$5,000s.
From a practical standpoint, $5,000/oz functions as the key decision level. It is not just a round number—it acts as both a technical pivot and a behavioral anchor. Price action around this zone has consistently triggered shifts in systematic positioning, options hedging, and short-term momentum flows.
The implication for macro-oriented investors is straightforward: this is not a tight-range forecast. The distribution is wide, right-tailed, and volatility-sensitive. Upside spikes remain plausible, especially during periods of intensified geopolitical or policy uncertainty, but the risk of sharp pullbacks increases once volatility peaks.
2. Market-Implied Probabilities and How to Read Them
2.1 What the Market Is Pricing In
Market-implied probabilities suggest meaningful demand for higher gold outcomes by end-February. Illustratively, the pricing implies approximate “hit by” probabilities clustered around:
Mid-$4,000s: moderate likelihood
$5,000–$5,500: non-trivial upside demand
$6,000+: low but visible tail risk
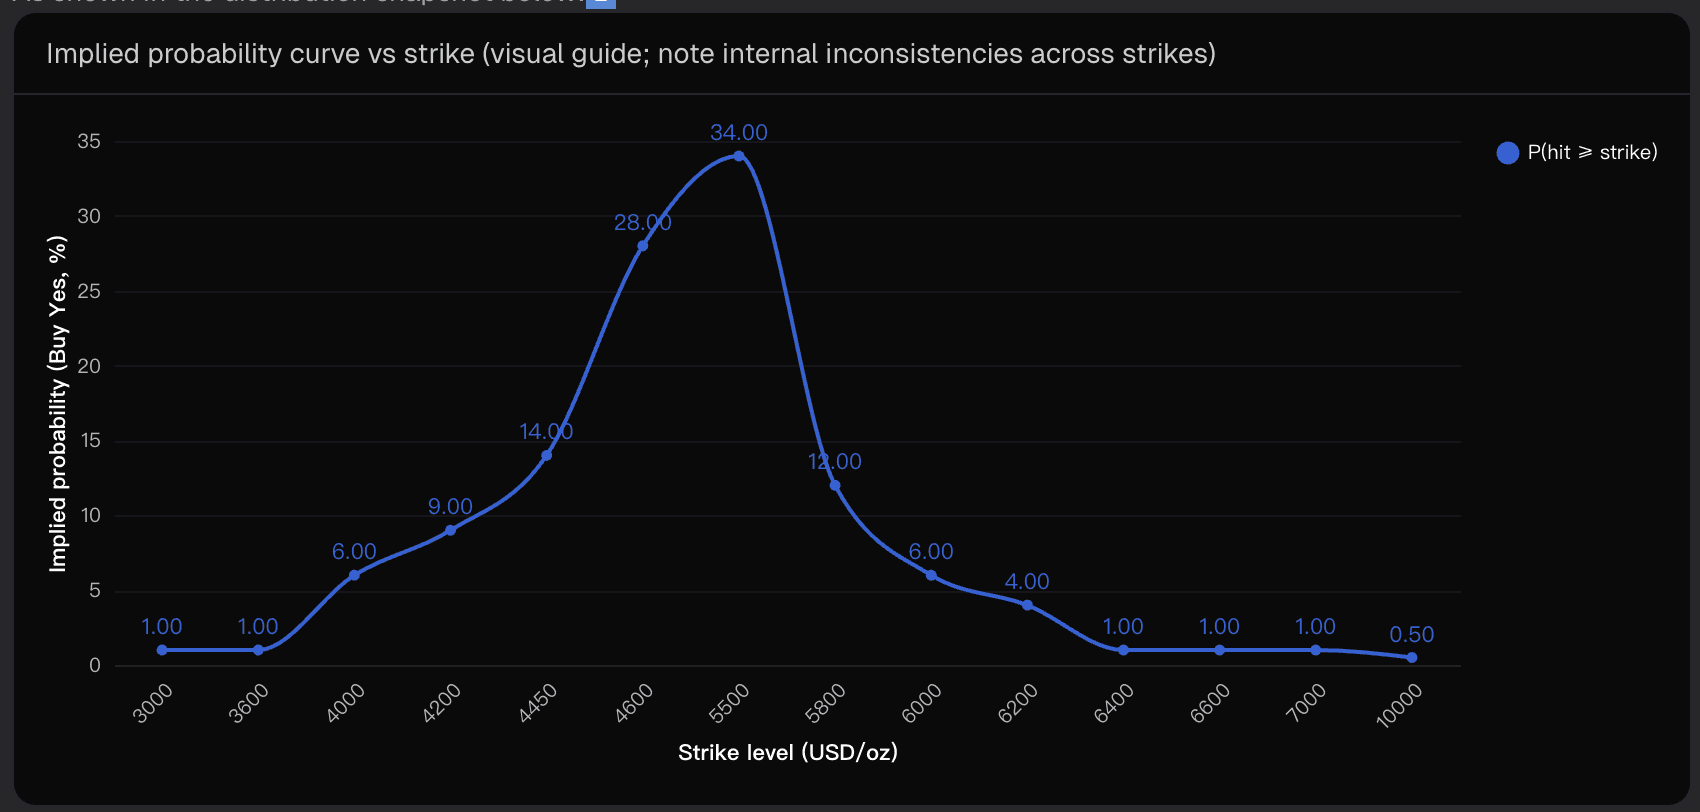
What matters more than the exact percentages is the shape of the distribution. The curve is not clean or monotonic, which tells me this is less about precision pricing and more about sentiment, convexity demand, and positioning pressure.
2.2 Interpreting the Noise Correctly
The internal inconsistencies across strike levels are a feature, not a bug. They reflect liquidity segmentation, temporary dislocations, and fee frictions rather than a perfectly arbitraged probability curve. I treat this input as a risk-pricing signal, not a literal forecast.
When upside strikes attract disproportionate interest, it usually signals asymmetric fear of missing upside, even among participants who expect mean reversion longer-term.
3. Macro Forces Supporting an Elevated Floor
Several structural drivers continue to support gold at elevated levels:
Geopolitical risk premium remains persistent, reinforcing gold’s role as a convex hedge during periods of headline-driven uncertainty.
Central bank accumulation and reserve diversification trends have not reversed, keeping a steady underlying bid in place.
Policy credibility and institutional trust narratives matter more than realized inflation alone; perceived regime risk tends to steepen gold’s right tail even when macro data looks “stable.”
These factors don’t guarantee upside—but they do make deep, sustained drawdowns harder to maintain.
4. Volatility, Technical Levels, and Flow Dynamics
Gold’s early-2026 price action—sharp rallies, fast pullbacks, and rapid rebounds—is typical of a high-volatility uptrend, not a topping process.
Key observations:
$5,000 remains the dominant pivot: sustained trade above or below this level tends to activate algorithmic trend-following flows.
Volatility amplifies path dependence: because “hit-by” outcomes resolve on any daily settlement, intramonth swings matter as much as final prices.
Convexity cuts both ways: the same dynamics that fuel upside spikes can accelerate drawdowns when liquidity thins and profit-taking kicks in.
This reinforces why I model February as a wide-range month, not a linear grind.
5. What Could Break the Forecast
No forecast is complete without stress-testing the downside. The main risks to this outlook include:
A rapid real-yield rebound or USD squeeze, compressing gold’s risk premium.
Volatility exhaustion, leading to sharp but temporary air-pocket drawdowns.
Geopolitical de-escalation, which can quickly deflate safe-haven demand.
Microstructure distortions, where thin liquidity exaggerates both upside and downside moves.
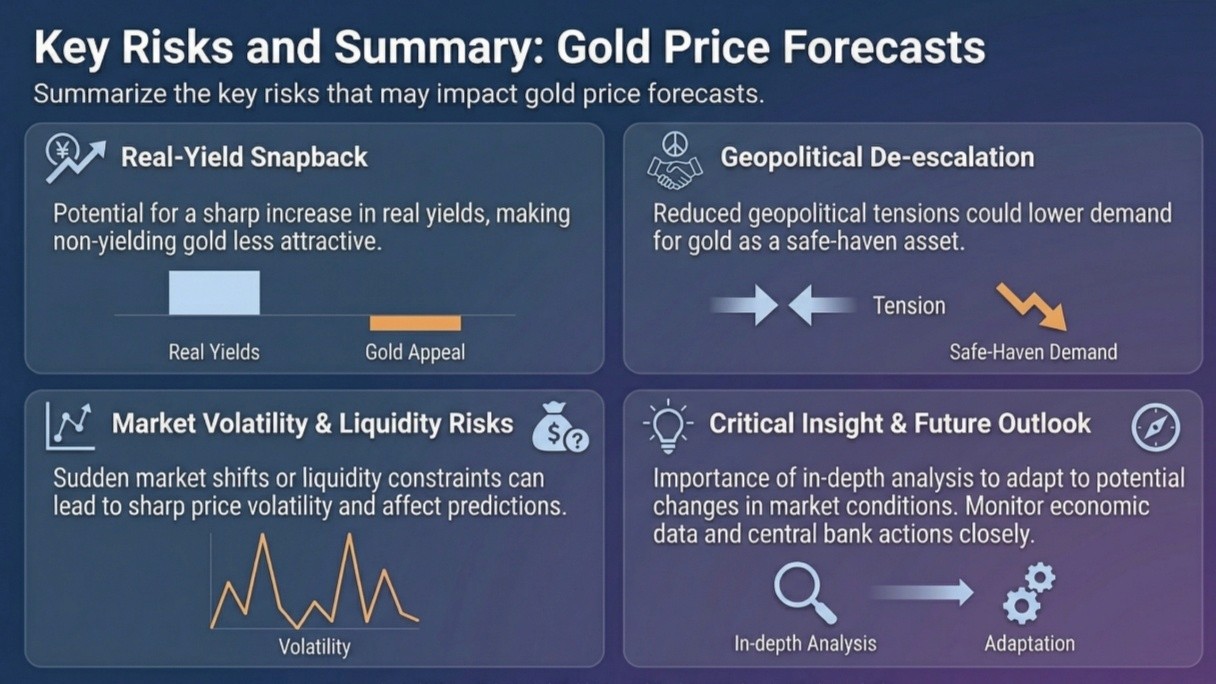
These risks don’t negate the structural bull case—but they do argue for respecting volatility rather than anchoring to a single price target.
Conclusion: The Decision-Ready Takeaway
By the end of February 2026, I expect gold to trade as a wide-distribution, upside-skewed asset, centered on a $5,000/oz magnet, with a meaningful—but not dominant—tail risk toward $5,500 and above, and a realistic probability of mean reversion back into the mid-$4,000s after volatility peaks.
This is a market defined less by precision and more by range, path dependence, and convex risk management—and that framing matters far more than any single number.
I arrived at this forecast using structured probability analysis with Powerdrill Bloom, which helped surface the asymmetries that are easy to miss when looking only at spot prices.
Disclaimer: This article is for informational and analytical purposes only and does not constitute financial or investment advice.
Related Post

Feb 6, 2026
/
Post by
Franklin

Feb 5, 2026
/
Post by
Olivia

Feb 4, 2026
/
Post by
Michael