

As I watch Bitcoin claw its way back above $87,000, I find myself resisting the emotional pull of the green candles. Price action like this is seductive — it whispers that the worst is over, that the market has found its footing. But experience, data, and pattern recognition tell me something far more restrained: this is not yet a confirmed reversal. It is, more plausibly, a technically justified relief rally unfolding inside a still-dominant macro-driven downtrend.
Through my continuous market modeling — increasingly refined with the assistance of AI analytics tools like Powerdrill Bloom, which synthesizes macro signals, liquidity behavior, and probabilistic volatility regimes — the current structure reveals a far more nuanced narrative than surface optimism suggests.
A Bounce, Not a Breakout
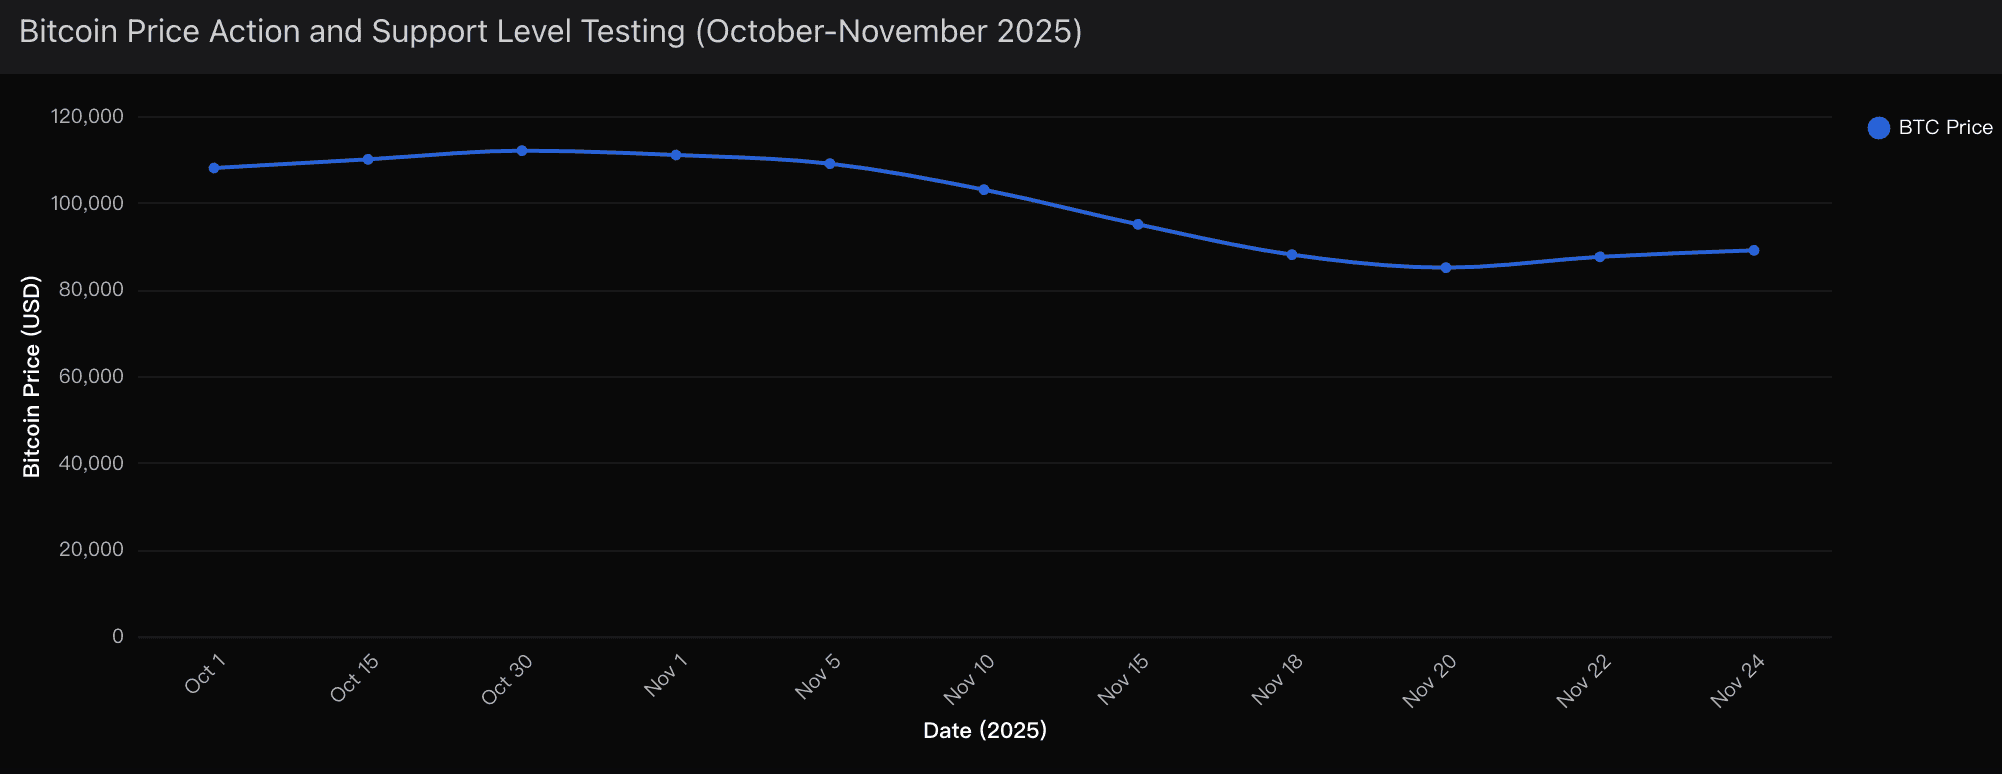
Bitcoin’s drop from $112,000 in early October to $82,000 by mid-November represented a brutal 26.7% drawdown. This move was not born from crypto-native weakness but from a sharp macro re-pricing: the Federal Reserve’s shift from an easing bias to a “higher for longer” posture.
The rebound to $87,000, a 6.1% recovery from the lows, fits neatly into what seasoned traders recognize as a classic bear market rally. These bounces are common during bottoming processes, often driven by liquidation exhaustion and short-covering — not by renewed conviction.
Here’s what the current bounce actually tells me:
Capitulation-style liquidations exceeding $900 million have temporarily drained aggressive sellers
Support around $82,000–$85,000 is structurally holding
Volume and market breadth lack the bullish divergence required to validate a true trend reversal
We witnessed a similar pattern in August 2024 — a rebound, followed by extended ranging before real recovery took root. The difference now? The macro environment, particularly Fed policy, is dramatically more unstable.
Probability Framework
I approach this market not emotionally, but probabilistically.
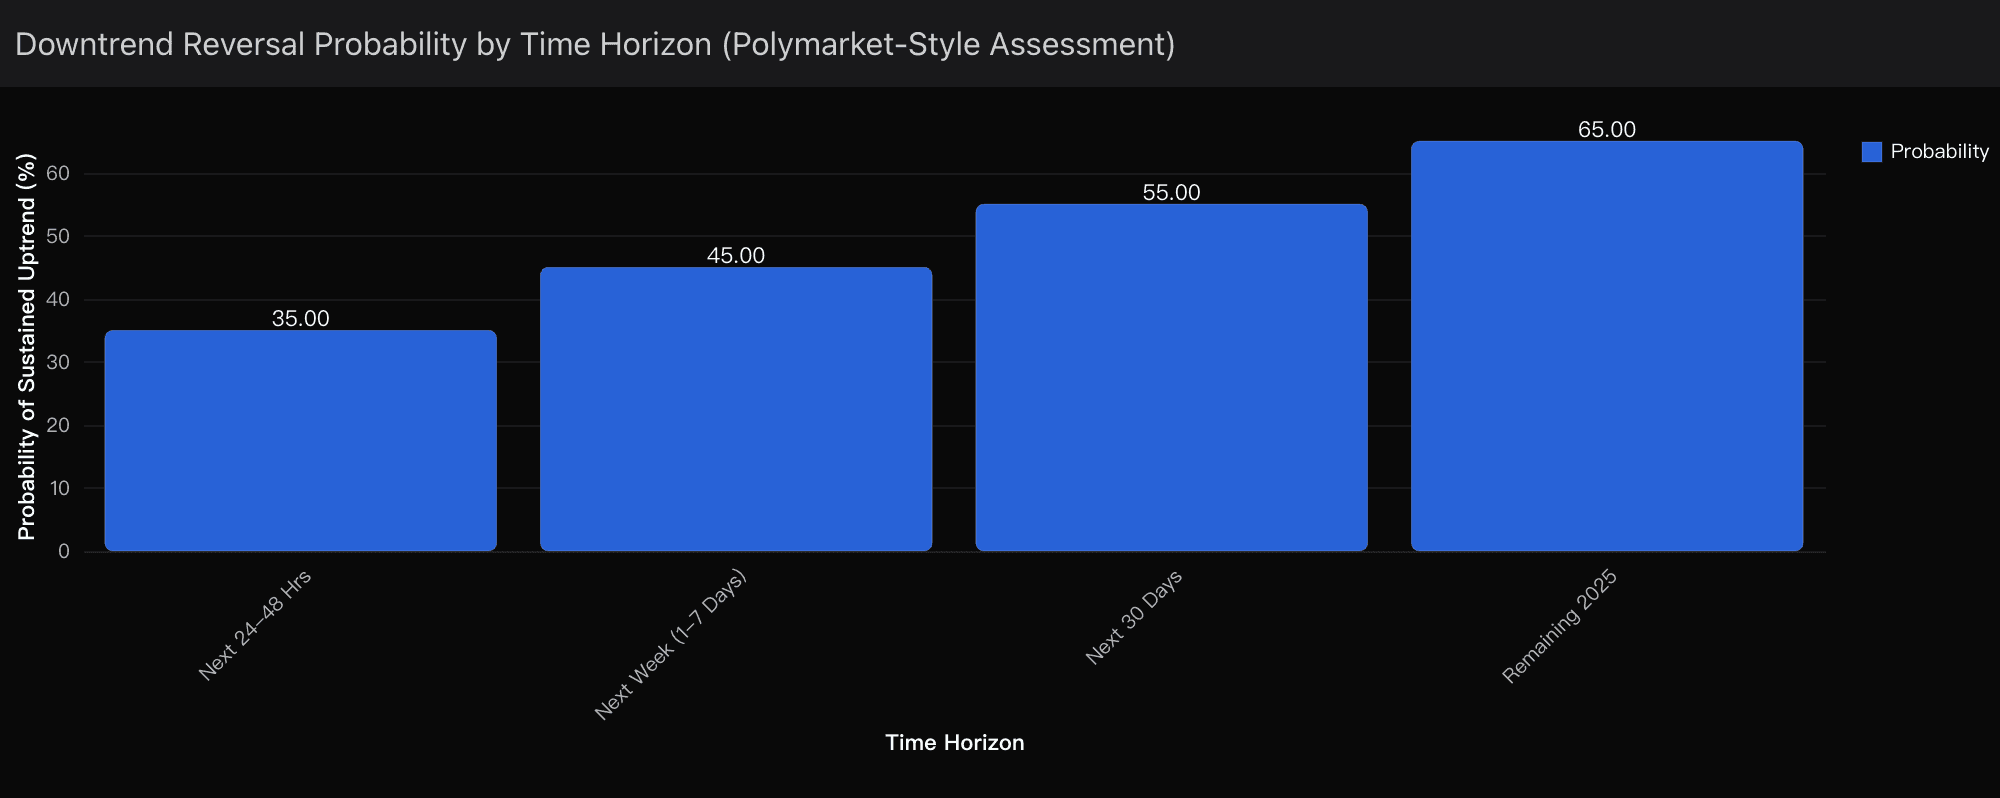
Immediate Outlook (Next 48 Hours)
35% probability that the downtrend has ended
Bull scenario (35%): $87,000 holds; momentum carries price toward $92,000–$95,000 as Fed cut optimism resurfaces.
Bear scenario (65%): A retracement back toward $82,000–$85,000 unfolds due to hawkish Fed rhetoric or disappointing macro data.
Short-Term Outlook (1–7 Days)
45% probability of sustained upside continuation
The December Federal Reserve decision is now the central pivot point. Current market pricing implies approximately 70% odds of a rate cut. If that probability holds or rises, Bitcoin likely stabilizes and targets $95,000–$100,000. Any deviation toward hawkish signaling reopens the risk of another support retest.
Medium-Term (30+ Days)
55–60% probability of confirmed trend reversal
This is where structural forces — institutional inflows, regulatory clarity, and political support — begin to outweigh short-term fear.
Remainder of 2025
65–70% probability of sustained uptrend continuation
My cumulative probability for Bitcoin revisiting $110,000+ before the end of the year stands at 45%, rising steadily if macro conditions stabilize.
Key Drivers
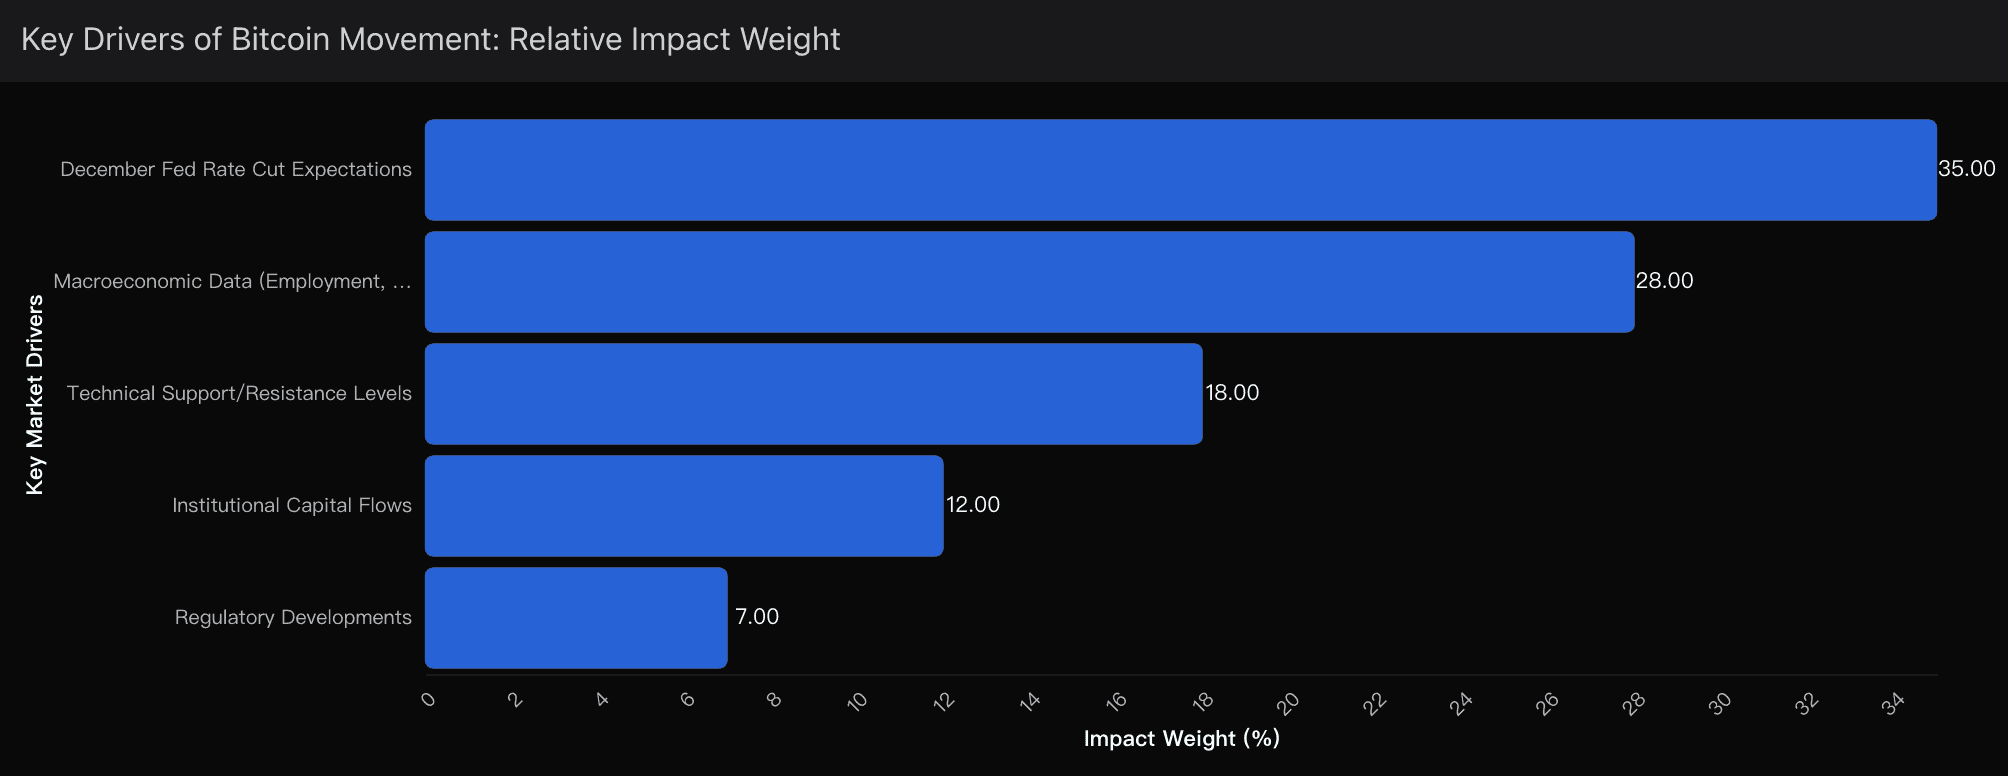
1. Federal Reserve Policy (35% Weight) — The Dominant Force
Bitcoin is now largely a macro asset. When Fed expectations shifted from aggressive cuts to policy hesitation, BTC dropped nearly $24,000 in weeks. Price reacted directly to changes in rate-cut probabilities.
A single dovish comment from a Fed official can swing sentiment by 10–15 percentage points. My baseline view:
If December rate-cut odds remain ≥65%, $87,000 becomes durable support
If probabilities drop below 50%, repositioning toward $80,000 becomes likely
2. Macroeconomic Data (28% Weight)
Bitcoin has become hypersensitive to inflation and employment data:
Weak data → rate cut expectations rise → Bitcoin rallies
Strong data → inflation fears rebound → Bitcoin sells off
Upcoming releases for CPI and labor metrics will determine whether the current bounce evolves into structural recovery or fades into consolidation.
3. Technical Structure (18% Weight)
The technical map is precise:
Support: $82,000–$85,000
Resistance: $95,000–$100,000
Key psychological zone: $90,000
A sustained hold above $92,000 would form higher lows, signaling a legitimate shift in trend structure. By contrast, sustained weakness below $87,000 for more than 72 hours would indicate that bears remain firmly in control.
4. Institutional Capital (12% Weight)
Despite volatility, institutional accumulation remains intact:
Continuous spot ETF inflows during pullbacks
Crypto custody expansion by major banks post-regulatory easing
This creates a structural price floor that didn’t exist in past downturn cycles, explaining why Bitcoin held $82,000 instead of free-falling toward older bear-market depths like $70,000.
5. Political & Regulatory Landscape (7% Weight)
Pro-crypto policy direction remains supportive. While not decisive for daily price action, it strengthens long-term confidence and capital deployment assumptions.
The New Market Reality: Bitcoin as a Macro Asset
Bitcoin is now 90% macro-driven and only 10% crypto-native.
This means:
Equity and bond volatility increasingly dictate crypto sentiment
Fed meetings trigger explosive volatility windows
Large moves statistically retrace 30–50% within weeks
It is a paradoxical environment: high risk, but equally rich in opportunity. Overshoots are frequent — and with advanced insights like Powerdrill Bloom, these overshoots become measurable rather than emotional.
Final View
Bitcoin’s rebound above $87,000 is not meaningless — but it is not yet transformational. I see it as a structurally logical pause, a recalibration moment while macro forces negotiate the next regime shift.
Until volume expands, Fed signals stabilize, and higher lows are established, I remain disciplined in my outlook:
Cautiously constructive — but not prematurely bullish.
In this market, patience is not passivity. It is strategy.
Related Post

Nov 21, 2025
/
Post by

Nov 21, 2025
/
Post by
Michael

Nov 20, 2025
/
Post by
Michael