How to Make a Dashboard in PowerPoint: Step by Step
To make a dashboard in PowerPoint, plan four to six key numbers, set up a grid on one slide, and add KPI cards and charts. Build the charts in Excel and paste them with a link, so the dashboard updates when the data changes. Keep everything on one slide that reads in under a minute.
This guide covers how to plan the layout, which charts to use, and how to keep the numbers current. It also walks through a full example and a faster way to build a dashboard slide from your data. Steps for charts and pasting come from Microsoft's support pages, read on November 11, 2026.
What a PowerPoint dashboard is
A PowerPoint dashboard is one slide that shows the most important numbers for a team, project, or business. It mixes KPI cards, small charts, and short labels so a reader can see the state of things at a glance.
It differs from a dashboard in Excel or a BI tool. Those are interactive, and readers filter and drill down. A dashboard slide is a snapshot. It is built to be presented in a meeting, emailed to leaders, or printed in a board pack.
That shapes every choice. A slide has no scroll bar and no filters. Everything the audience needs must fit in one view, with the most important number read first.
If your audience will explore the data on their own, build in Excel instead. Our guide on how to make a dashboard in Excel covers that version.
The metrics matter more than the tool. Still deciding which numbers belong on the slide? Our guide on how to build a KPI dashboard from a spreadsheet covers which metrics to keep and which to cut.
Plan the dashboard before you open PowerPoint
Most weak dashboards fail before the first shape is drawn. Spend ten minutes on these questions first:
- Who reads it? A CEO wants three numbers and a trend. A team lead wants detail by person or product.
- What decision does it support? A sales review needs pipeline and win rate. A project review needs schedule and budget.
- Which four to six numbers matter most? More than six makes the slide hard to read.
- What is each number compared against? Target, last month, or last year. A number alone means little.
- How often will it update? Weekly or monthly updates change how you build the charts.
Write the answers in the slide notes. They keep the build on track and help the next person who updates it.
A useful test is the five-second rule. If someone glances at the slide for five seconds, they should know whether things are good or bad. Plan the layout around that first glance.
Choose the right chart for each number
Each number on a dashboard needs the simplest visual that answers its question.
| What you want to show | Best visual | Why |
|---|---|---|
| One headline number versus target | KPI card | Big number, small comparison, fast to read |
| A trend over time | Line chart | Shows direction and pace |
| Comparison across categories | Bar chart | Easy to compare lengths |
| Progress toward a goal | Progress bar | Clear share of the target |
| Part of a whole, with few parts | Pie or donut chart | Works with three to five slices |
| Detail rows | Small table | When exact figures matter |
Avoid gauges and 3D charts. They take space and make values harder to read.
Microsoft's chart guide for PowerPoint points to a list of available chart types if you are unsure. As a rule, if a bar chart works, use it.
How to build the layout in PowerPoint
A dashboard slide needs a clear grid. Here is a simple layout that works for most teams.
- Start with a blank slide. Choose Home > Layout > Blank, so placeholders do not get in the way.
- Add a title band. Put the dashboard name, period, and date in a thin band at the top.
- Add a row of KPI cards. Draw four rounded rectangles of the same size across the top third.
- Add the chart area. Split the lower two-thirds into two or three equal boxes for charts.
- Add a notes strip. Keep a narrow strip at the bottom for one or two lines of commentary.
- Turn on guides. Use View > Guides to keep edges aligned as you add content.
Each KPI card holds three items. The big number goes in the middle, the label above, and the comparison below. For example: "Revenue," "$587,800," and "103% of target."
Color should carry meaning, not decoration. Use one neutral color for most elements. Keep green and red for status, and use them sparingly.
How to add charts to the dashboard
You can make charts directly in PowerPoint or bring them in from Excel.
To create a chart in PowerPoint, Microsoft says "click Insert > Chart and pick the chart you want." A small worksheet opens. Microsoft's next step is: "In the worksheet that appears, replace the placeholder data with your own information."
After you insert a chart, buttons appear next to it. Microsoft's tip reads: "Use the Chart Elements button to show, hide, or format things like axis titles or data labels." The Chart Styles button changes color and style quickly.
For a dashboard, strip each chart back. Remove gridlines, shorten axis labels, and add data labels only where they help. Small charts get crowded fast.
Microsoft also gives clear advice on large data. Its support page says "If you have lots of data to chart, create your chart in Excel, and then copy it into your presentation." That leads to the most useful step in this guide.
How to link charts to Excel so the dashboard updates
A dashboard is only useful if the numbers stay current. Linking charts to Excel saves you from rebuilding the slide every month.
Microsoft says building in Excel is "the best way if your data changes regularly and you want your chart to always reflect the latest numbers." Here is the process, based on Microsoft's guide to copying from Excel to other Office programs:
- In Excel, click the chart and press Ctrl+C.
- In PowerPoint, click where you want the chart and press Ctrl+V.
- Click the Paste Options button next to the chart.
- Choose Use Destination Theme & Link Data.
Microsoft explains that this option "updates the chart formatting to match the destination formatting and keeps the chart linked to the original worksheet." So the chart matches your slide design and still points to the workbook.
There are other paste options. Keep Source Formatting & Link Data keeps Excel's look while linking. Picture pastes a static image that "cannot be edited or updated."
Two cautions apply. Microsoft notes that "The tools for copying Excel data and charts are not available in Office Online." Use the desktop apps for linking. And keep the workbook in the same place, since moving it can break the link.
For more on refreshing linked charts, see our guide on how to update PowerPoint charts from Excel.
Design rules that keep the slide readable
Good dashboard slides follow a few simple rules. They matter more than any template.
Put the most important number top left. Readers scan from the top left in most languages. The headline KPI belongs there.
Use one font, two sizes. Large for numbers, small for labels. A third size for the title is enough.
Round the numbers. "$588K" reads faster than "$587,800" on a card. Keep exact figures for the notes or a table.
Label directly. Put labels on the bars or line ends instead of in a legend. Legends make the eye jump back and forth.
Show the comparison as text and color. "103% of target" in green says more than a green dot alone. It also works for readers who cannot tell red from green.
Leave white space. Empty space between boxes helps the eye group related numbers. A crowded slide feels harder than it is.
Test on a projector or a small screen. Labels that look fine on a large monitor often vanish in a meeting room.
A quick check before you send it: cover the notes strip and ask a colleague what the slide says. If they get it right, the design works.
How to update the dashboard each period
A dashboard slide pays off when it is easy to refresh. Set up the update routine once.
- Keep one workbook as the source. Each chart on the slide links to a sheet in that workbook.
- Add the new period's data. Paste or import the latest figures into the same columns.
- Open the presentation. Linked charts can be refreshed from the workbook, so check that each one shows the new period.
- Update the KPI cards. Cards are text, so type the new numbers and comparisons.
- Rewrite the notes strip. Two lines on what changed and why.
- Keep a copy for the archive. Name it by period, such as "Q3 dashboard," so past versions stay easy to find.
The first build takes an hour or two. After that, a monthly update should take about fifteen minutes.
Keep a short checklist in the slide notes. The next person who updates the dashboard will thank you.
A PowerPoint dashboard example
Here is a worked example for a made-up company. Brightline Home sells kitchen goods online. The leadership team wants a one-slide dashboard for the third quarter.
Title band. "Q3 Sales Dashboard · July to September · Updated October 3."
KPI cards.
| Card | Number | Comparison |
|---|---|---|
| Revenue | $587,800 | 103.1% of the $570,000 target |
| New customers | 1,240 | Up 12.7% from 1,100 in Q2 |
| Average order value | $64.20 | Up from $61.80 in Q2 |
| Return rate | 4.1% | Down from 4.8% in Q2 |
Revenue by month. July brought in $182,000, August $195,500, and September $210,300. Those three months add up to $587,800. A line chart shows steady growth of about 7.4% and 7.6% month over month.
Revenue by channel. A bar chart compares the website, marketplaces, and wholesale. The website leads, so it sits at the top of the bar chart.
Notes strip. "Q3 beat target by 3.1%. September growth came from the new cookware line. Wholesale is flat; review pricing in Q4."
The finished slide answers the leadership team's first question in five seconds: the quarter beat target. Every other element explains why.
Each chart is pasted with Use Destination Theme & Link Data. When Q4 begins, the analyst updates the Excel workbook. The charts refresh, and only the KPI cards and notes need new text.
Make a dashboard in PowerPoint with AI
The slow part of a dashboard is rarely the drawing. It is cleaning the data, picking the metrics, and building charts that match. An AI tool can do the first draft from your spreadsheet.
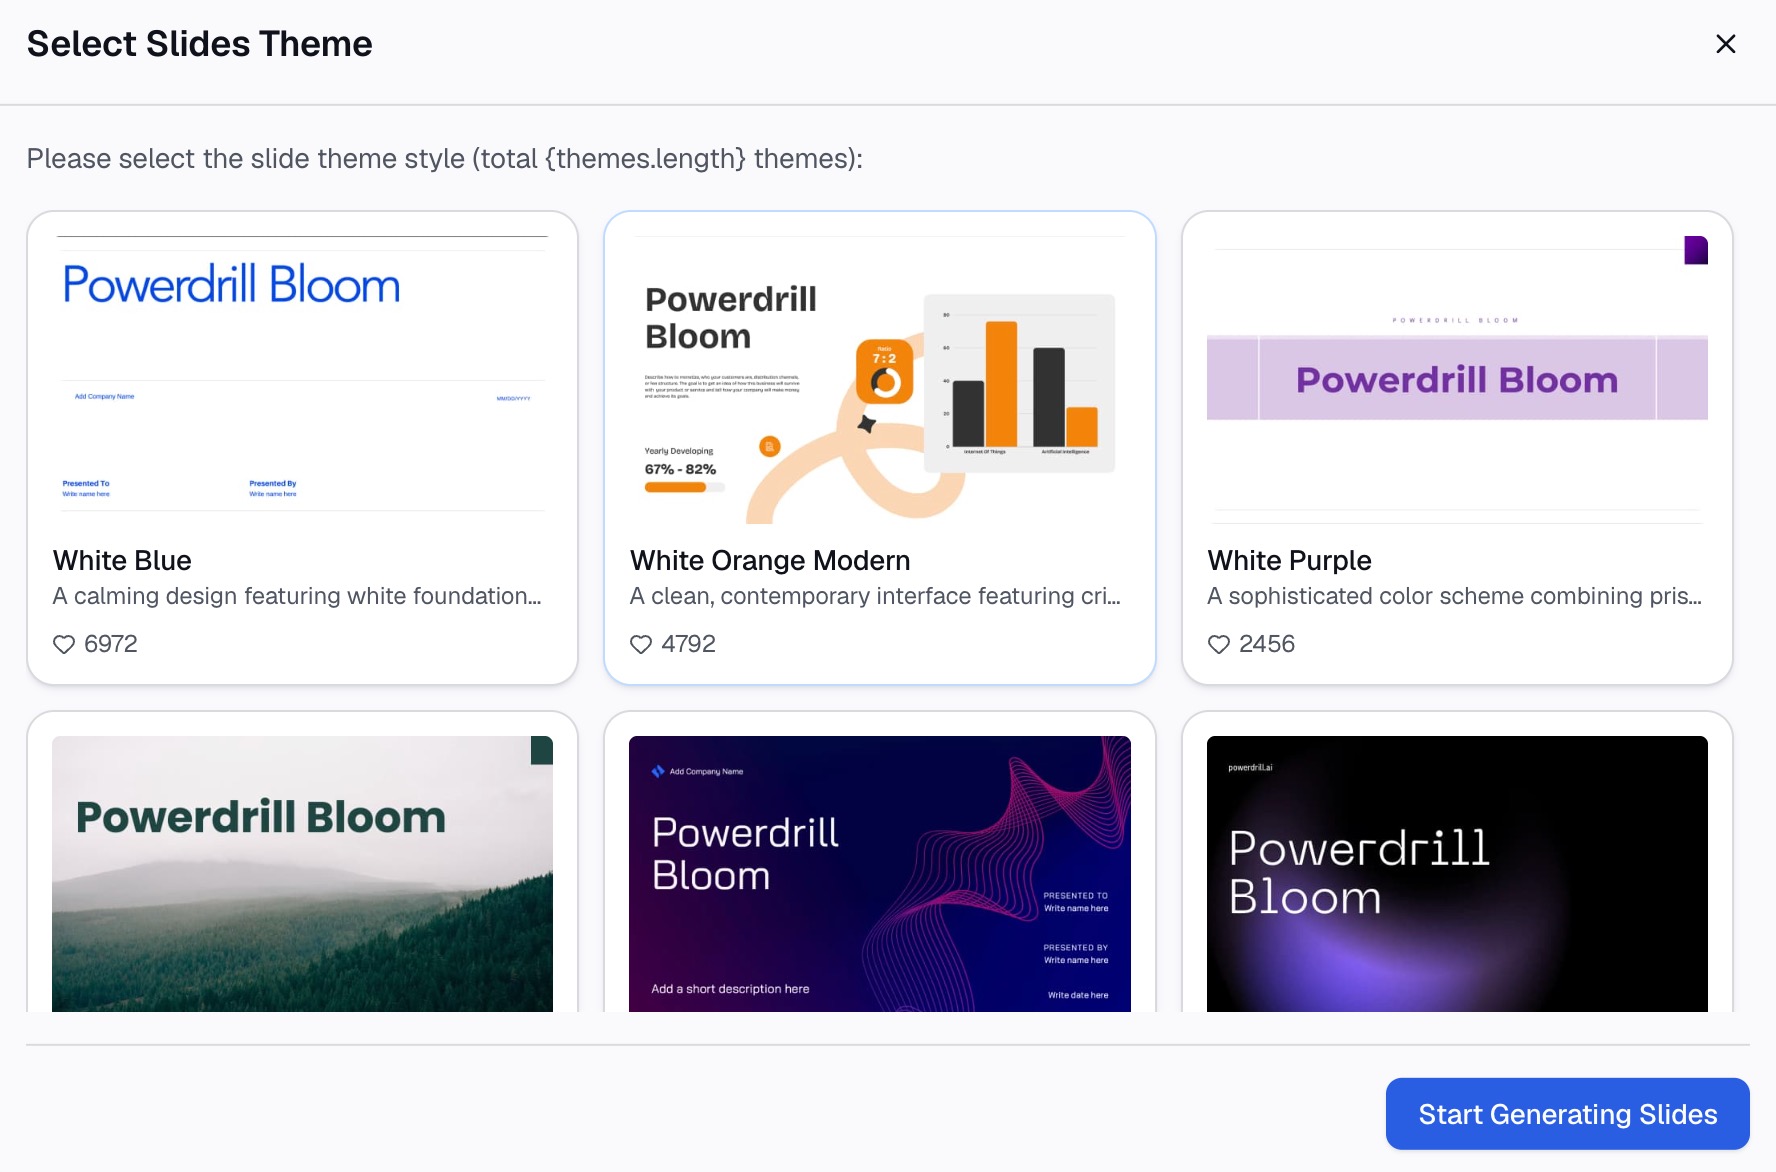
Here is the method in three steps, using Powerdrill Bloom.
Step 1: Upload your spreadsheet
Export the data behind the dashboard as Excel or CSV. The Excel to PPT page says you can "Upload Excel, CSV, or a PDF" and that Powerdrill Bloom "identifies patterns, key sections, and data points."
Include the targets and last period's figures in the file. Comparisons are what make a dashboard useful.

Step 2: Describe the dashboard slide in natural language
Say what to show and for whom. For example: "Make a one-slide Q3 dashboard for leadership with revenue versus target, new customers, average order value, and return rate. Add a monthly revenue trend."
For finance numbers, the AI Finance Dashboard Builder offers a "CFO scorecard dashboard" with "Headline finance KPIs on a single board for daily monitoring."
Step 3: Check the numbers and export to PowerPoint
Compare each KPI with your source file. Then export. The Excel to PPT page says: "Choose a template you like, adjust as needed, and export to PowerPoint in one click."
For single charts, the AI Graph Maker can "generate bar, pie, line, and scatter charts in seconds."
Common mistakes to avoid
These problems make dashboard slides hard to read.
- Too many numbers. More than six KPIs turns a dashboard into a data dump.
- No comparison. "$587,800" means little without a target or last period.
- Decorative charts. Gauges, 3D effects, and heavy gradients slow the reader down.
- Inconsistent scales. Two bar charts with different axes invite wrong comparisons.
- Pasting pictures of charts. A picture cannot be updated, so the slide goes stale.
- Tiny text. If labels are hard to read on a laptop, they will fail on a projector.
- Changing the layout each month. Keep the same slide so readers learn where to look.
When you are ready to stop building dashboard slides by hand, try Powerdrill Bloom with this quarter's spreadsheet.
Frequently asked questions
Can you make a dashboard in PowerPoint?
Yes. Use one slide with KPI cards, a few small charts, and a notes strip. Build the charts in Excel and paste them with a link so the numbers can update.
How do I make a dashboard in PowerPoint update automatically?
Copy each chart from Excel, paste it in PowerPoint, and choose Use Destination Theme & Link Data. The chart stays linked to the original worksheet, per Microsoft.
What charts work best on a PowerPoint dashboard?
KPI cards for headline numbers, line charts for trends, and bar charts for comparisons. Use pie charts only with three to five slices, and avoid gauges and 3D charts.
How many KPIs should a dashboard slide have?
Four to six is a good range. Fewer can work for executives. More than six usually makes the slide hard to read in a meeting.
Should I build a dashboard in PowerPoint or Excel?
Use PowerPoint for a snapshot you present or send. Use Excel or a BI tool when readers need to filter and explore the data themselves.
Sources: Microsoft Support, Use charts and graphs in your presentation · Microsoft Support, Copy from Excel to another Office program.