How to Make a Comparison Slide in PowerPoint: Step by Step
To make a comparison slide in PowerPoint, select a slide, go to Home > Layout, and choose the Comparison layout. Type a heading for each option, then add the points, a table, or a chart under each one. Keep the same criteria on both sides so the audience can compare line by line.
This guide covers how to plan a comparison slide, four ways to build one, and the design rules that make it easy to read. It also walks through a full example and a faster way to build comparison slides from a spreadsheet. Steps come from Microsoft's support pages, read on November 12, 2026.
What a comparison slide is
A comparison slide puts two or more options next to each other so the audience can weigh them. It answers one question: which option is better for this decision, and why?
Common uses include:
- Vendor or tool choices. Two software options against the same criteria.
- Before and after. Last quarter's results next to this quarter's.
- Plans and scenarios. A base case next to a stretch case.
- Pros and cons. The upsides and downsides of a single option.
- Competitors. Your product next to a rival's.
PowerPoint ships with a layout for this job. Microsoft's support page lists "a side-by-side Comparison layout" among its predefined layouts.
A good comparison slide does one thing well. It helps the room reach a decision faster than a page of bullets would.
Choose the right comparison format
The format depends on what you are comparing. Pick it before you open PowerPoint.
| What you are comparing | Best format | Why |
|---|---|---|
| Two options, a few points each | Comparison layout | Two clear columns with headings |
| Several options against several criteria | Table | Rows and columns line up the facts |
| Numbers across options or periods | Chart | Bar lengths show the gap at a glance |
| Concepts or features with no numbers | SmartArt | Shapes give structure to short text |
If your comparison has numbers, a chart is usually the strongest choice. If it has many facts, use a table. If it is about ideas, use the layout or SmartArt.
Plan the content before you open PowerPoint
Most weak comparison slides fail before any design work starts. The criteria are unclear, or each side lists different things.
Work through four questions first:
- What decision is this slide for? Write it as one sentence, such as "Which CRM should the sales team use next year?"
- Which options are on the slide? Two is easiest to read. Four is the practical limit.
- Which criteria matter? Pick three to five, such as cost, setup time, and features.
- What is your recommendation? Decide it now, so the slide can lead to it.
Collect the facts for each option in a spreadsheet. One row per criterion and one column per option keeps the data honest. It also makes the table or chart easy to build later. Note the source and date of each fact in an extra column. When someone questions a figure in the meeting, you can answer on the spot.
Agree on the criteria with the decision maker before you build the slide. A comparison built on the wrong criteria will be sent back, however good it looks.
How to use the Comparison layout
This is the quickest way to build a comparison slide. The layout gives you a title, two headings, and two content areas.
Follow Microsoft's steps:
- Select the slide that you want to change the layout for.
- Select Home > Slide Layout.
- Select the layout that you want, in this case Comparison.
Type the option names in the two heading placeholders. Then add three to five points under each one, in the same order on both sides.
Microsoft notes that layouts "contain placeholders for text, videos, pictures, charts, shapes, clip art, a background, and more." That means you can drop a small chart or icon into either side instead of text.
If you make changes you do not like, Microsoft says to "Select Home > Reset" to return to the original layout. It adds that "Using Reset doesn't delete any content you've added."
To change the layout for every comparison slide in a deck, edit it once in Slide Master view. Microsoft says to select View > Slide Master, though it notes "This feature isn't available in PowerPoint for the web."
How to build a comparison table
A table is best when you compare several options against several criteria. Each row is a criterion, and each column is an option.
Microsoft's steps are:
- Select the slide that you want to add a table to.
- On the Insert tab, select Table.
- Use the mouse to select the number of rows and columns that you want.
- Click a cell and enter your text.
For three options and four criteria, insert a table with four columns and five rows. The first column holds the criteria, and the first row holds the option names.
Microsoft also notes a limit. It says "It's not possible to convert existing slide text into a table." Insert an empty table first, then add the text.
If the facts already live in Excel or Word, you can copy and paste the table. This keeps the numbers exact and saves retyping.
Keep table cells short. A comparison table works when each cell holds a number, a yes or no, or a few words.
How to compare with a chart
When the comparison is about numbers, a chart shows the gap faster than any table. Clustered bar or column charts are the usual choice.
Microsoft's steps for a simple chart are:
- Click Insert > Chart.
- Click the chart type and then double-click the chart you want.
- In the worksheet that appears, replace the placeholder data with your own information.
For bigger datasets, Microsoft suggests building the chart in Excel first. It says that if "your data changes regularly," you should keep the pasted chart "linked to the original Excel file."
Put the options side by side on the axis. Use one color for your recommended option and a neutral gray for the rest. The eye goes straight to the highlighted bar.
Our guide on how to make a bar graph in PowerPoint covers bar chart settings in more detail.
How to compare with SmartArt
SmartArt suits comparisons of ideas rather than numbers. It turns short text into shapes with a clear structure.
Microsoft's steps to convert existing text are:
- Select your text.
- On the Home tab, select Convert to SmartArt Graphic.
- Select the SmartArt you want.
For a comparison, pick a layout with two balanced groups, such as one of the list or relationship layouts. Put one option in each group and keep the same number of points on both sides.
SmartArt works best with very short phrases. If a point needs a full sentence, use the Comparison layout or a table instead.
Design rules that keep the slide readable
A comparison slide only works if the audience can scan it in a few seconds. These rules help.
- Same criteria, same order. Every option gets the same rows or bullets, in the same order.
- Three to five criteria. More than that and the slide turns into a document.
- Headline the finding. Use the title to state the result, such as "Option B saves two weeks of setup."
- Highlight the winner. One accent color for the recommended option, neutral tones for the rest.
- Align everything. Columns should start at the same height and use the same font size.
- Use numbers where you can. "Setup in 3 days" beats "fast setup."
- Cite your sources. Add a small footnote with where each figure came from.
- Leave white space. Crowded columns hide the comparison you want to show.
Check the slide from the back of the room. If you cannot read a cell, the font is too small.
How you present the slide matters as much as how it looks. Walk the room through one criterion at a time, top to bottom. Say the winner on each row before you move on.
Put the details in the speaker notes, not on the slide. If someone asks why Tool A scored lower on reports, the answer is ready without crowding the columns.
If the decision is close, say so. A slide that admits the trade-off earns more trust than one that hides it.
A comparison slide example
Here is a comparison of two project tools for a team of 20 people. The facts sit in a spreadsheet first.
| Criterion | Tool A | Tool B |
|---|---|---|
| Setup time | 10 days | 3 days |
| Seats included | 15 | 25 |
| Built-in reports | 4 | 12 |
| Mobile app | No | Yes |
On the slide, the title states the finding: "Tool B covers the whole team and sets up a week faster." The Comparison layout holds the two tool names as headings.
Under each heading go the same four points, in the same order. Tool B's column uses the accent color. A small bar chart in the corner shows built-in reports, 4 against 12.
The difference in setup time is 10 minus 3, which is 7 days, or one week. Tool A would also leave 5 of the 20 people without a seat, since it includes 15.
The slide ends with one line of recommendation under the columns. The audience sees the decision, the reason, and the evidence in one view.
The same pattern works for a before-and-after slide. Put last quarter on the left and this quarter on the right, with the same metrics in the same order. Add a small arrow or a change figure next to each pair, such as "+12%," so the movement is clear.
For a pros-and-cons slide about one option, use the same two columns. Label them Pros and Cons, and keep the points parallel where you can. A pro about speed should sit across from a con about speed, if one exists.
Make a comparison slide in PowerPoint with AI
When the facts live in a large spreadsheet, choosing what to compare and building the slide take time. An AI tool can draft the comparison and the slide for you.
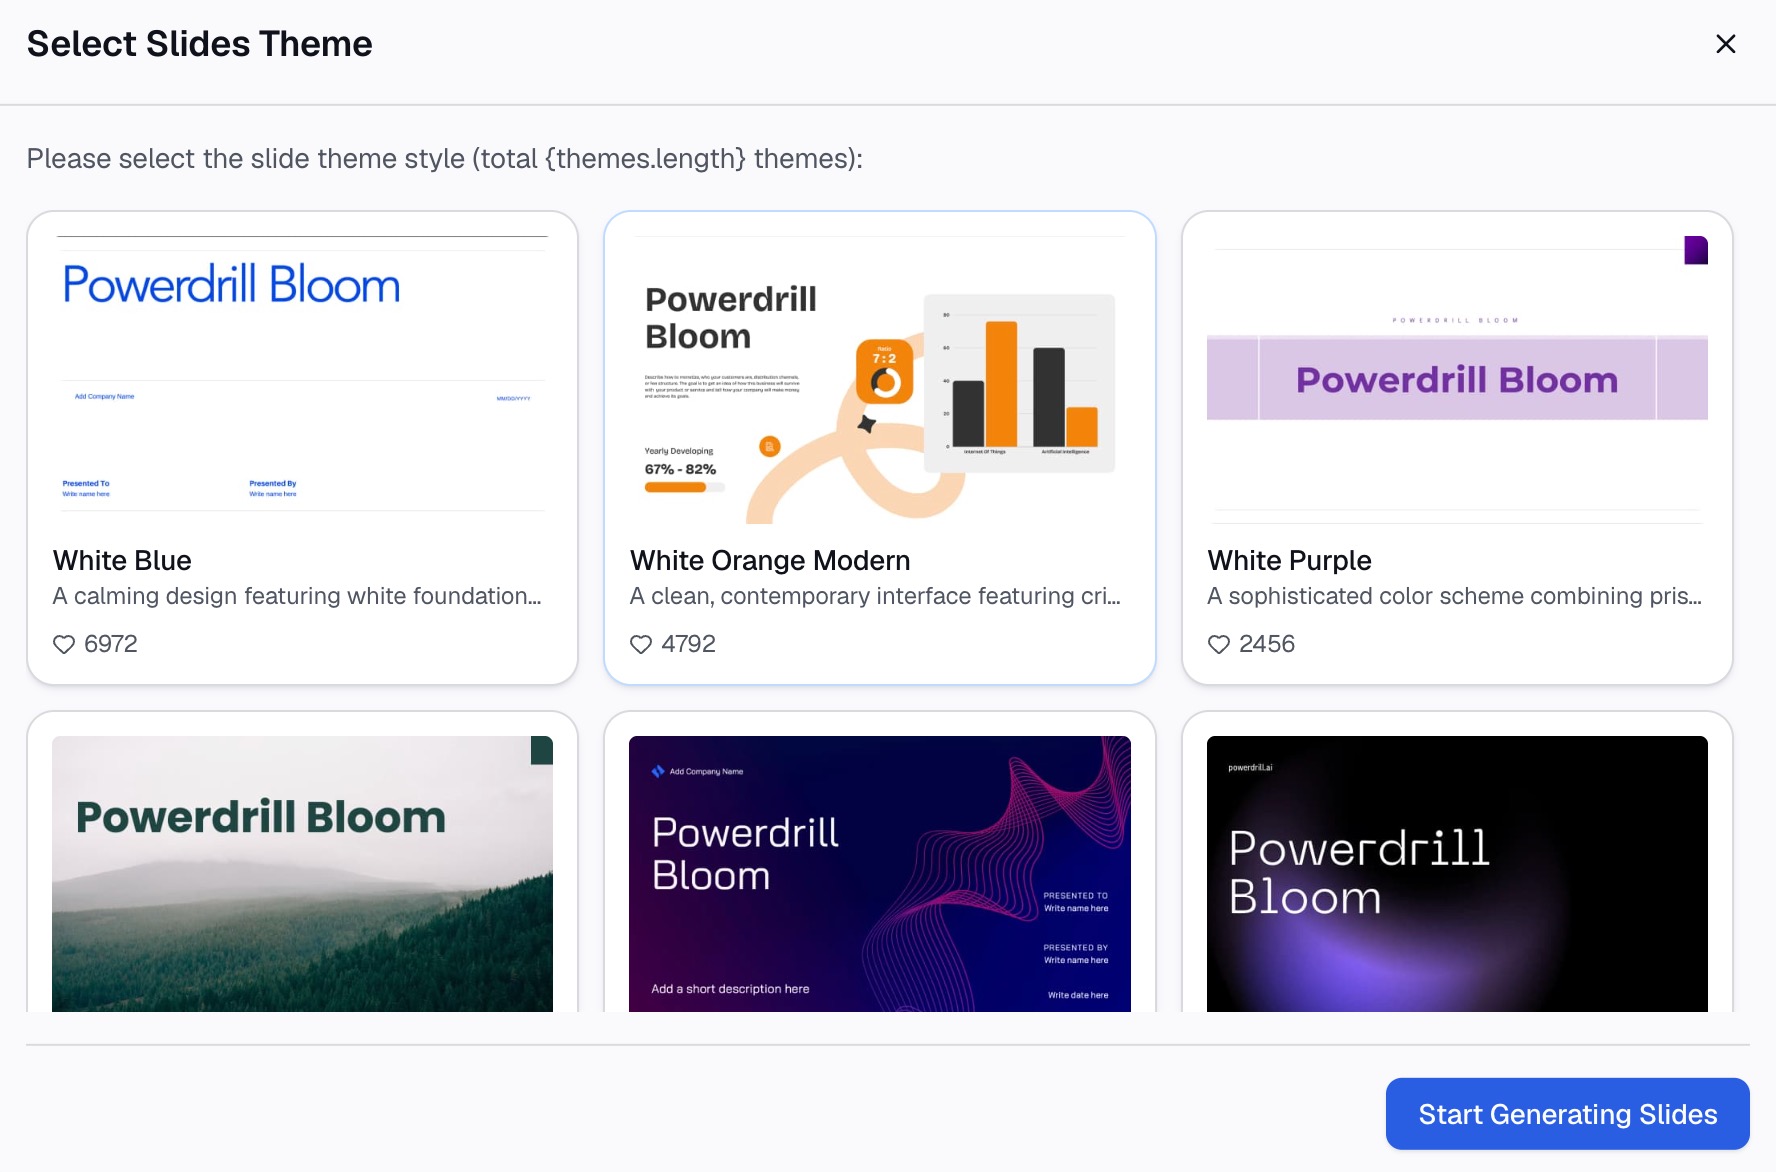
Here is the method in three steps, using Powerdrill Bloom.
Step 1: Upload your spreadsheet
Upload the Excel, CSV, or PDF file with the facts for each option. The Excel to PPT page says you can "Upload Excel, CSV, or a PDF" and the tool "doesn't just extract text—it reads it."
Keep one row per criterion and one column per option. Clear labels help the AI build the right comparison.

Step 2: Ask for the comparison slide in natural language
Describe the slide you need. For example: "Build a comparison slide of Tool A and Tool B on setup time, seats, and reports, and recommend one."
The same page says the tool suggests directions "like problem analysis, key findings, comparisons, or frameworks." You can pick the comparison angle and adjust the criteria.
Step 3: Check the facts and export to PowerPoint
Check every number on the slide against your spreadsheet. Then export it. The Excel to PPT page says you can "export to PowerPoint in one click."
For number-heavy comparisons, the Bar Graph Maker can add a chart. Its page says "Bar graphs allow for quick visual comparisons."
Common mistakes to avoid
These are the problems that come up most often on comparison slides.
- Uneven criteria. One side lists price and the other lists features. Compare the same things on both sides.
- Too many options. Five columns are hard to read. Narrow the list first.
- No conclusion. A comparison slide without a recommendation leaves the room guessing.
- Biased wording. "Expensive" on one side and "premium" on the other skews the result. Use neutral terms.
- Walls of text. Full sentences in every cell bury the comparison. Use short phrases and numbers.
- Mismatched scales. Two charts with different axes make small gaps look large.
- Stale numbers. Prices and features change. Date the slide and link charts to the source file.
- Hidden sources. If a number is challenged, you need to show where it came from.
For slides that summarize a whole analysis, see our guide on how to make data slides easy to read.
When you are ready to turn a spreadsheet into a finished comparison, try Powerdrill Bloom with your vendor shortlist.
Frequently asked questions
How do I make a comparison slide in PowerPoint?
Select a slide, go to Home > Layout, and choose Comparison. Type the option names as headings and add the same points under each one. You can also use a table, chart, or SmartArt for the comparison.
Does PowerPoint have a comparison template?
PowerPoint includes a built-in Comparison layout in every theme. Microsoft describes it as a side-by-side layout. You can customize it once in Slide Master view to reuse across a deck.
What is the best way to compare numbers on a slide?
Use a clustered bar or column chart. Put the options side by side and highlight the recommended one in an accent color. For many facts, use a table instead.
How many options should a comparison slide include?
Two or three options are easiest to read. Four is the practical limit. If you have more, narrow the shortlist or split the comparison across slides.
Can I turn bullet points into a comparison graphic?
Yes. Select the text, go to Home, and choose Convert to SmartArt Graphic. Pick a layout with two balanced groups, and keep the same number of points on each side.
Sources: Microsoft Support, Apply a slide layout · Microsoft Support, What is a slide layout? · Microsoft Support, Add a table to a slide · Microsoft Support, Use charts and graphs in your presentation · Microsoft Support, Create a SmartArt graphic from a list in PowerPoint.