How to Do Market Sizing With TAM, SAM, and SOM: A Full Guide

To do market sizing, estimate three numbers. TAM is the total yearly revenue if every possible customer bought your product. SAM is the part of that market you can actually serve. SOM is the share you can realistically win in the next few years. Build each one from customer counts and price, then cross-check with a top-down estimate.
This guide explains TAM, SAM, and SOM, the two main methods, and how to build the model in Excel. It also shows a faster way with AI, a worked example, and how to stress-test the result.
What market sizing is
Market sizing estimates how much revenue a market can produce for a product. It answers a simple question. If this product works, how big can the business get?
The U.S. Small Business Administration lists market size among the core questions of market research. Its guide asks: "How many people would be interested in your offering?" Market sizing turns that question into a number you can defend.
People do market sizing for different reasons:
- Founders show investors that the opportunity is large enough.
- Product teams decide which segment to enter first.
- Consultants test whether a new market is worth a client's time.
- Sales leaders set territories and targets.
The goal is not a perfect number. It is a reasoned estimate with clear assumptions that others can check and challenge.
TAM, SAM, and SOM explained
Market sizing usually splits the market into three nested layers. Each one is a subset of the one before.
| Layer | Stands for | What it measures | Typical question |
|---|---|---|---|
| TAM | Total addressable market | All revenue if every possible customer bought | How big is the whole market? |
| SAM | Serviceable available market | The part your product and channels can reach | Which part can we serve today? |
| SOM | Serviceable obtainable market | The share you can win in a set period | How much can we capture in three years? |
TAM sets the ceiling. It ignores your current limits, such as language, region, or product features.
SAM applies those limits. If your product only works for small clinics in English-speaking countries, SAM counts only them.
SOM applies competition and capacity. It reflects how many customers your team can realistically sign, given rivals and sales resources.
Investors look at all three. A huge TAM with a tiny SOM suggests a hard path. A small TAM caps the upside, however good the plan.
What you need before you start
Gather five inputs before you build anything.
- A clear customer definition. Who buys, and what counts as one customer: a person, a household, or a company?
- Customer counts. How many of those customers exist in each region or segment.
- A price. The average yearly revenue per customer, often called ARPU.
- Your limits. Regions, languages, company sizes, or channels you cannot serve yet.
- A reference estimate. An industry report or public total to cross-check your result.
For counts, start with public data. The SBA points to free federal sources, including the U.S. Census Bureau, the Bureau of Labor Statistics, and NAICS business classifications. It notes that existing sources "can save you a lot of time and energy." It also warns the data "might not be as specific to your audience as you'd like."
For price, use your own pricing, or what customers pay for alternatives today.
Where to find data for each input
Each input in a market sizing model needs a source. The SBA lists free federal data in its market research guide. Here is how those sources map to the inputs.
| Input | Where to look | What it gives you |
|---|---|---|
| Business customer counts | NAICS codes and the U.S. Census Business Builder | Business classifications and data on your potential market |
| Consumer customer counts | U.S. Census Bureau and Bureau of Labor Statistics | Population segments for targeting customers |
| Spending power | Bureau of Economic Analysis and the Consumer Price Index | Economic indicators and price trends |
| Price | Competitor pricing pages and your own price list | What customers pay for alternatives today |
| Target share | Your sales data, pilots, and customer interviews | Realistic conversion rates |
Public data covers the first three rows well. The last two depend on your own research.
For price and share, the SBA describes direct research methods: surveys, questionnaires, focus groups, and in-depth interviews. It says direct research gives "a nuanced understanding of your specific target audience." It also notes it "can be time consuming and expensive."
A practical mix works for most teams:
- Use public data for counts. It is free, consistent, and easy for others to check.
- Use competitor prices as a starting point. Then adjust for how your product differs.
- Use pilots for share. Even ten early customers give a real conversion rate to start from.
- Write the date next to each source. Counts and prices change, and readers should know how fresh they are.
When a number comes from a paid industry report, note the publisher and the year. Readers can then judge the source themselves.
Top-down vs. bottom-up market sizing
There are two main methods. Most good models use both.
Top-down starts with a big published number and narrows it. For example, you take total spending on a software category, then apply the share that fits your segment. It is fast, but it depends on someone else's figure and definitions.
Bottom-up starts with customers and price. You count the customers in each segment and multiply by the yearly price. It takes longer, but every input is visible and testable.
| Method | Formula | Best for | Main risk |
|---|---|---|---|
| Top-down | Industry total × share that fits your segment | A quick first estimate | Inflated or mismatched source data |
| Bottom-up | Number of customers × yearly price per customer | Investor decks and planning | Wrong counts or price assumptions |
Investors usually trust bottom-up more, because they can check each input. Use top-down as a sense check. If the two results are far apart, one of your assumptions needs work.
A third method, value theory, estimates what customers would pay based on the value they get. It is useful for brand-new categories with no spending data yet.
How to do market sizing in Excel
A simple bottom-up model fits on one sheet. Here is a layout that works.
- List segments in rows. For example, small, mid-size, and large customers, or each region.
- Add input columns. Customer count, share you can serve, yearly price, and target share.
- Calculate TAM per row. Multiply count by price.
- Calculate SAM per row. Multiply TAM by the share you can serve.
- Calculate SOM per row. Multiply SAM by your target share.
- Sum each column. The totals give TAM, SAM, and SOM for the whole market.
- Label every input. Add a notes column with the source of each number.
Keep inputs in separate cells, not inside formulas. Then you can change one assumption and see the result update.
Add a top-down row at the bottom with your reference estimate. Show the gap between it and your bottom-up TAM as a percentage.
How to do market sizing with AI
The Excel method gets slow when data sits in many reports, or when you need several scenarios. An AI tool can read the inputs, build the model, and draft the charts.
Here is the method in three steps, using Powerdrill Bloom.
Step 1: Upload your market data
Start with the files that hold your inputs. That might be a spreadsheet of segment counts, a pricing sheet, or a PDF industry report.
The AI Market Sizing Generator asks you to "Upload market data segment counts, pricing benchmarks or industry estimates." If you need public figures, the Economic Data Explorer pulls indicators from sources such as FRED, the World Bank, and BLS.

Step 2: Pick the approach and describe the model
Next, choose the method. The tool page lists three options: "bottom-up, top-down or hybrid."
Then describe what you need in natural language. For example: "Build TAM, SAM, and SOM for clinic scheduling software. Use the segment counts and prices in the file. Show a bottom-up model and a top-down check."
The page says it builds "defensible TAM, SAM and SOM models from data and assumptions." It lists a "Bottom-up sizing model with segments, ARPU and counts." It also lists a "Sensitivity tornado chart showing which assumptions move the number most."
Step 3: Check the assumptions and export the sizing
Read every assumption before you share the result. The output includes a "TAM/SAM/SOM funnel with assumption labels and a numbered methodology," so each input is visible.
Then export. The page says to "Export the sizing branded PDF, deck or canvas with the model exposed." For investor work, the AI TAM Analysis Generator adds a "TAM defensibility brief with method, sources and FAQ for investors."
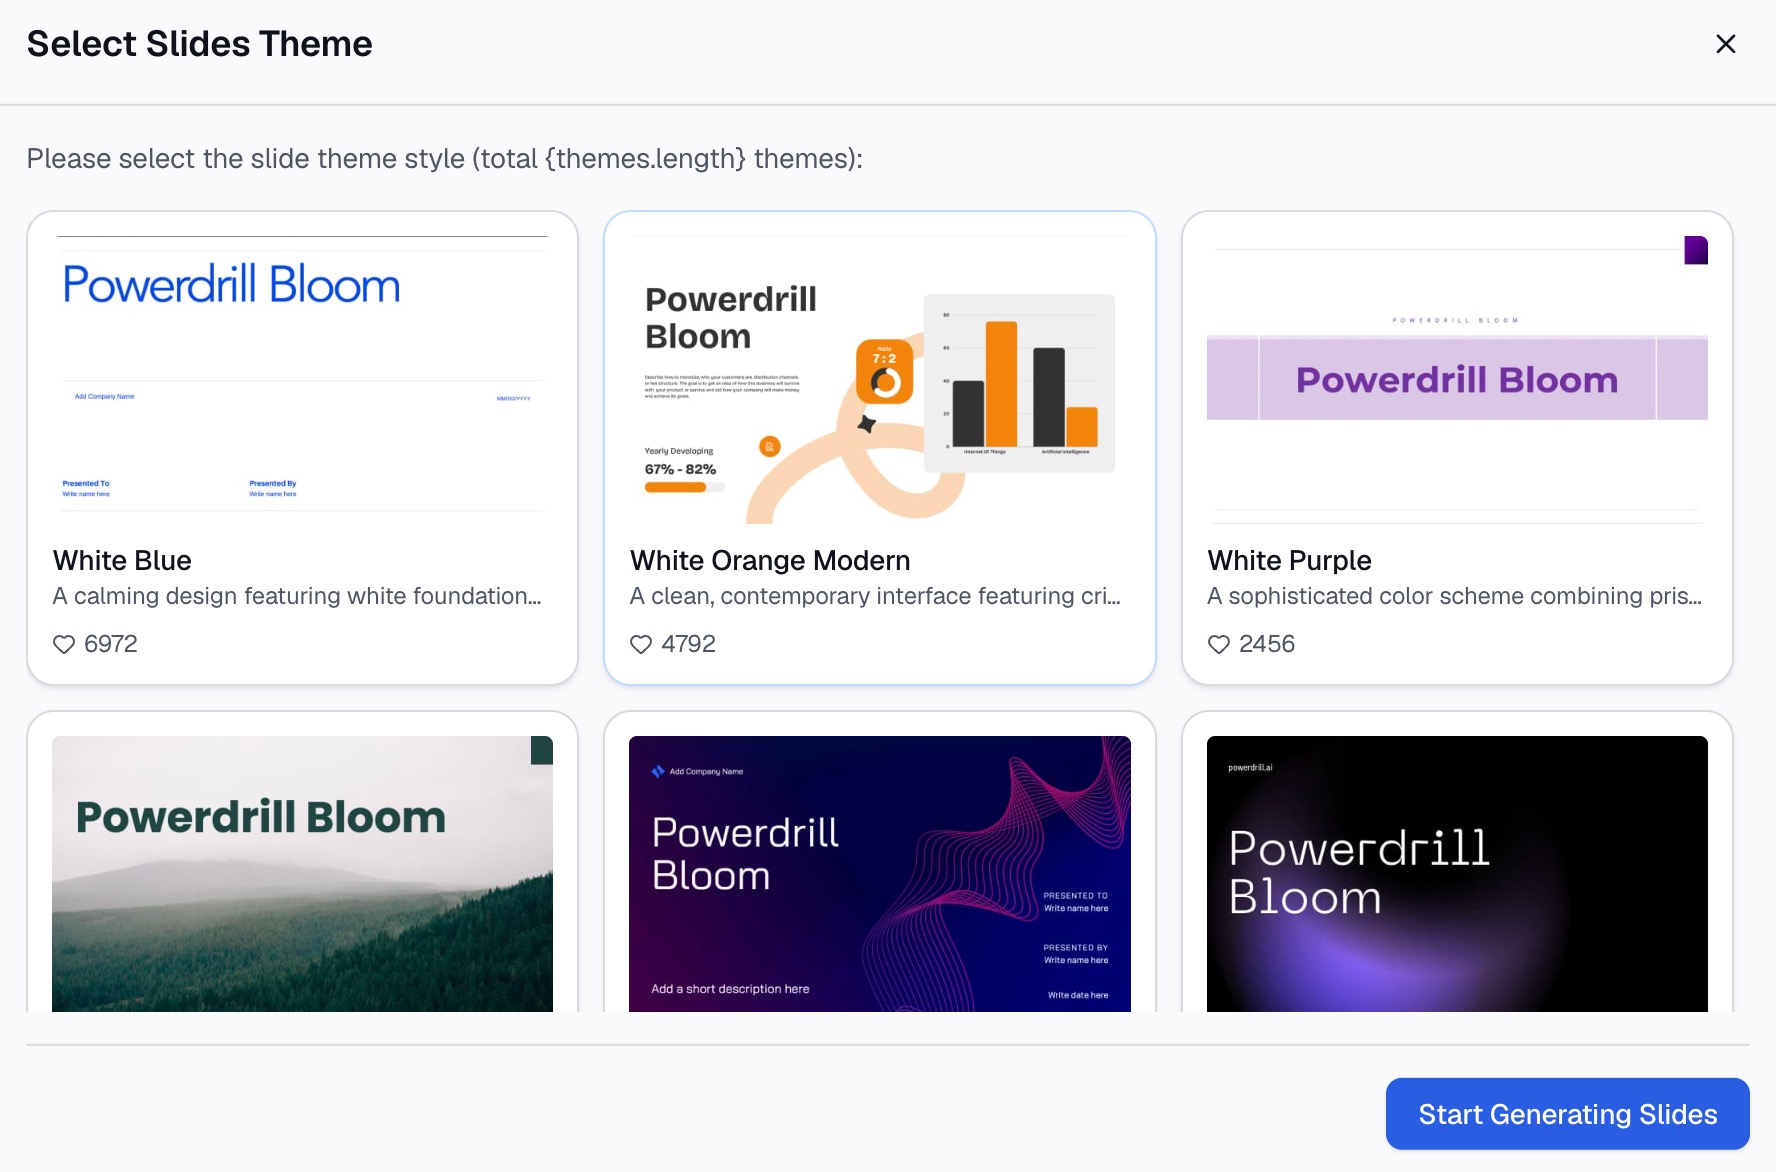
A market sizing example
Here is a worked example for a made-up company, Fieldnote. It sells scheduling software to physical therapy clinics for $1,800 per clinic per year. All counts below are illustrative, not real market data.
Bottom-up inputs:
| Input | Value | Note |
|---|---|---|
| Clinics in all target countries | 40,000 | Illustrative count |
| Clinics Fieldnote can serve today | 18,000 | English-speaking markets, 2 to 20 staff |
| Price per clinic per year | $1,800 | Current list price |
| Target share of SAM in three years | 5% | Based on sales capacity |
Results:
| Layer | Calculation | Result |
|---|---|---|
| TAM | 40,000 × $1,800 | $72.0M |
| SAM | 18,000 × $1,800 | $32.4M |
| SOM | 18,000 × 5% = 900 clinics × $1,800 | $1.62M |
Top-down check. Suppose an industry report puts yearly clinic scheduling spending at $80M in the same countries. The bottom-up TAM of $72.0M is 10% lower. That gap is small enough to accept, and the bottom-up number is the more careful one.
What the founder says in the deck. "We serve a $32.4M market today. Winning 5% in three years means 900 clinics and $1.62M in yearly revenue."
How SAM grows later. The gap between TAM and SAM is 22,000 clinics, worth $39.6M a year. Those clinics sit in markets or size bands Fieldnote cannot serve yet. If the team adds a second language that opens 6,000 more clinics, SAM rises by $10.8M. Showing this path tells investors where future growth comes from.
How SOM links to the plan. At 900 clinics, Fieldnote needs to sign about 300 clinics a year for three years. If one salesperson closes 75 clinics a year, the plan needs four salespeople. That ties the market sizing directly to hiring and budget.
How to stress-test your market sizing
A single number hides the risk. Show how the result moves when key assumptions change.
Start with the two inputs that matter most. In the Fieldnote example, those are price and target share.
| Scenario | Clinics won | Price | SOM |
|---|---|---|---|
| Base case | 900 | $1,800 | $1.62M |
| Price 20% lower | 900 | $1,440 | $1.30M |
| Price 20% higher | 900 | $2,160 | $1.94M |
| Share 3% | 540 | $1,800 | $0.97M |
| Share 7% | 1,260 | $1,800 | $2.27M |
Share moves SOM more than price does. That tells the team where to focus. Better evidence for the share assumption, such as pilot conversion rates, will make the model far more convincing.
A tornado chart shows this at a glance. Each bar is one assumption, sorted by how much it moves the result.
Also check these points before you share:
- Do the counts match your customer definition? Count clinics, not therapists, if you sell per clinic.
- Is the price yearly? Mixing monthly and yearly prices is a common error.
- Are the segments separate? One customer should not appear in two rows.
How to present market sizing
How you show the numbers matters as much as the numbers.
Use a funnel or nested circles. Show TAM, SAM, and SOM as three layers, with the value on each.
Put the method on the slide. Write "Bottom-up: 18,000 clinics × $1,800" under SAM. Investors check the math in seconds.
Lead with SAM and SOM. TAM sets context, but SAM and SOM show your actual plan.
Cite every source. Add a footnote for each count and price. Move detailed tables to an appendix.
Link it to your plan. Show how SOM connects to your revenue forecast and hiring plan.
Show a range, not just one number. Add the low and high cases from your stress test under the SOM figure. A range shows you understand the risk. It also gives investors a reason to trust the base case.
For the competitive side of the story, our guide to competitor analysis reports covers how to compare rivals.
Common market sizing mistakes
These errors are common and easy to avoid.
Quoting only TAM. A billion-dollar TAM says little about your business. Show SAM and SOM as well.
Using a top-down number alone. "1% of a huge market" is the weakest argument in a pitch. Build bottom-up first.
Counting the wrong unit. If you sell per company, count companies, not employees.
Ignoring your current limits. SAM must reflect the regions, languages, and segments you serve today.
Picking an unrealistic share. Tie the SOM share to sales capacity and real conversion data.
Hiding the assumptions. Unlabeled inputs make the model impossible to trust. List each source.
Never updating the model. Markets change. Refresh counts and prices at least once a year.
When you are ready to size your own market, try Powerdrill Bloom with your segment counts and pricing in one spreadsheet.
Frequently asked questions
What is the difference between TAM, SAM, and SOM?
TAM is the total revenue if every possible customer bought your product. SAM is the part your product and channels can reach today. SOM is the share of SAM you can realistically win in a set period, often three years.
How do you calculate TAM, SAM, and SOM?
For a bottom-up model, multiply the number of customers by the yearly price for TAM. Apply your current limits to get SAM. Then apply a realistic target share to SAM to get SOM.
Which is better, top-down or bottom-up market sizing?
Bottom-up is usually more credible, because each input can be checked. Top-down is faster and works well as a cross-check. Use both, and explain any large gap between them.
How do you do market sizing for a startup with no data?
Start with public counts, such as Census or BLS data, and the price of alternatives. Run customer interviews or a small pilot to test price and interest. Label every assumption, and show a range instead of one number.
How do you answer market sizing questions in a case interview?
Clarify the question, then break the market into a simple chain of estimates. A common chain is population, then target share, then buying frequency, then price. State each assumption aloud, round the numbers, and sense-check the final answer.
Sources: U.S. Small Business Administration, Market research and competitive analysis. Details read on November 4, 2026.