How to Create a Survey Results Report with AI: A Full Guide
Export your survey responses as a spreadsheet, then have an AI agent produce the report. You get sample and completion figures, a chart per closed question, cross-breaks by segment, and grouped themes from the open-ended answers. A day of pivot tables becomes one upload and one instruction.
What a survey results report needs to contain
A results report is not a dump of charts. It is a document someone reads once and acts on. Five parts do almost all the work:
- Sample and response rate. How many were invited, how many answered, how many finished.
- A read per closed question. Distribution, not just the average.
- Cross-breaks. The same question split by role, region, tenure, or plan.
- Open-ended themes. Free text grouped into a handful of recurring points, with real quotes.
- A conclusion. Two or three findings the reader is expected to do something about.
Most survey reports fail on the last two. Charts are easy to generate and open text is hard to summarize. So the free-text column quietly gets dropped, and that is usually where the actual finding was.
A workable skeleton, in the order a reader expects it:
| Section | Content | Common failure |
|---|---|---|
| Method | Population, invitations sent, responses, completion rate, field dates | Reporting responses without the invited base |
| Headline | Two or three findings, stated as sentences | A score with no interpretation |
| Question detail | One distribution chart per closed question | Averages shown without spread |
| Segments | The same questions split by role, region, or tenure | Segments too small to report |
| Open text | Themes with counts and verbatim quotes | Four cherry-picked comments |
| Actions | What changes, who owns it, by when | Findings with no owner |
What you need before you start
You need the responses as a file, not as a dashboard. Every major survey tool exports one.
Google Forms is the clearest example to follow. Its help documentation describes both routes. To work in a spreadsheet, "At the top right, click Link to Sheets". To get a flat file, the instruction is "Click More" then "Download responses (.csv)".
Two details from that documentation are worth knowing before you plan the report:
- The summary view only appears once responses exist. The help page notes that the "Summary" tab displays on a form only when there's one or more responses.
- There is a per-person view as well. It finds answers "by person or, if you allowed people to submit the form more than once, by submission". That view matters when duplicates might be inflating a result.
Grab the CSV. One row per respondent, one column per question, is the shape everything else assumes.
One more habit worth building: write the method section first, before you look at any result. It takes five minutes while the field dates and invitation counts are still fresh. It also stops the report from being questioned on its base numbers later. Readers who trust the method argue about the finding, which is the argument you want to be having.
How to write the report manually
The manual path is familiar and it is why survey reports slip.
You open the export and immediately hit the format problem. Multi-select questions arrive as one cell with comma-separated values. Rating scales arrive as text labels rather than numbers. Optional questions leave blanks that are meaningfully different from a zero.
Then you build a pivot per question, a chart per pivot, and repeat for every cross-break you were asked for. Three segments across twelve questions is thirty-six views, and each one needs a title.
The open-ended column is last, so it gets the least time. Someone skims two hundred comments, picks four that stand out, and calls it qualitative analysis.
Nothing here is difficult. It is just long, and the length is what pushes the report past its deadline. If your immediate need is charts rather than a document, our guide to turning messy survey data into clear charts covers that narrower job.
How to create a survey results report with AI
Step 1: Upload the response export
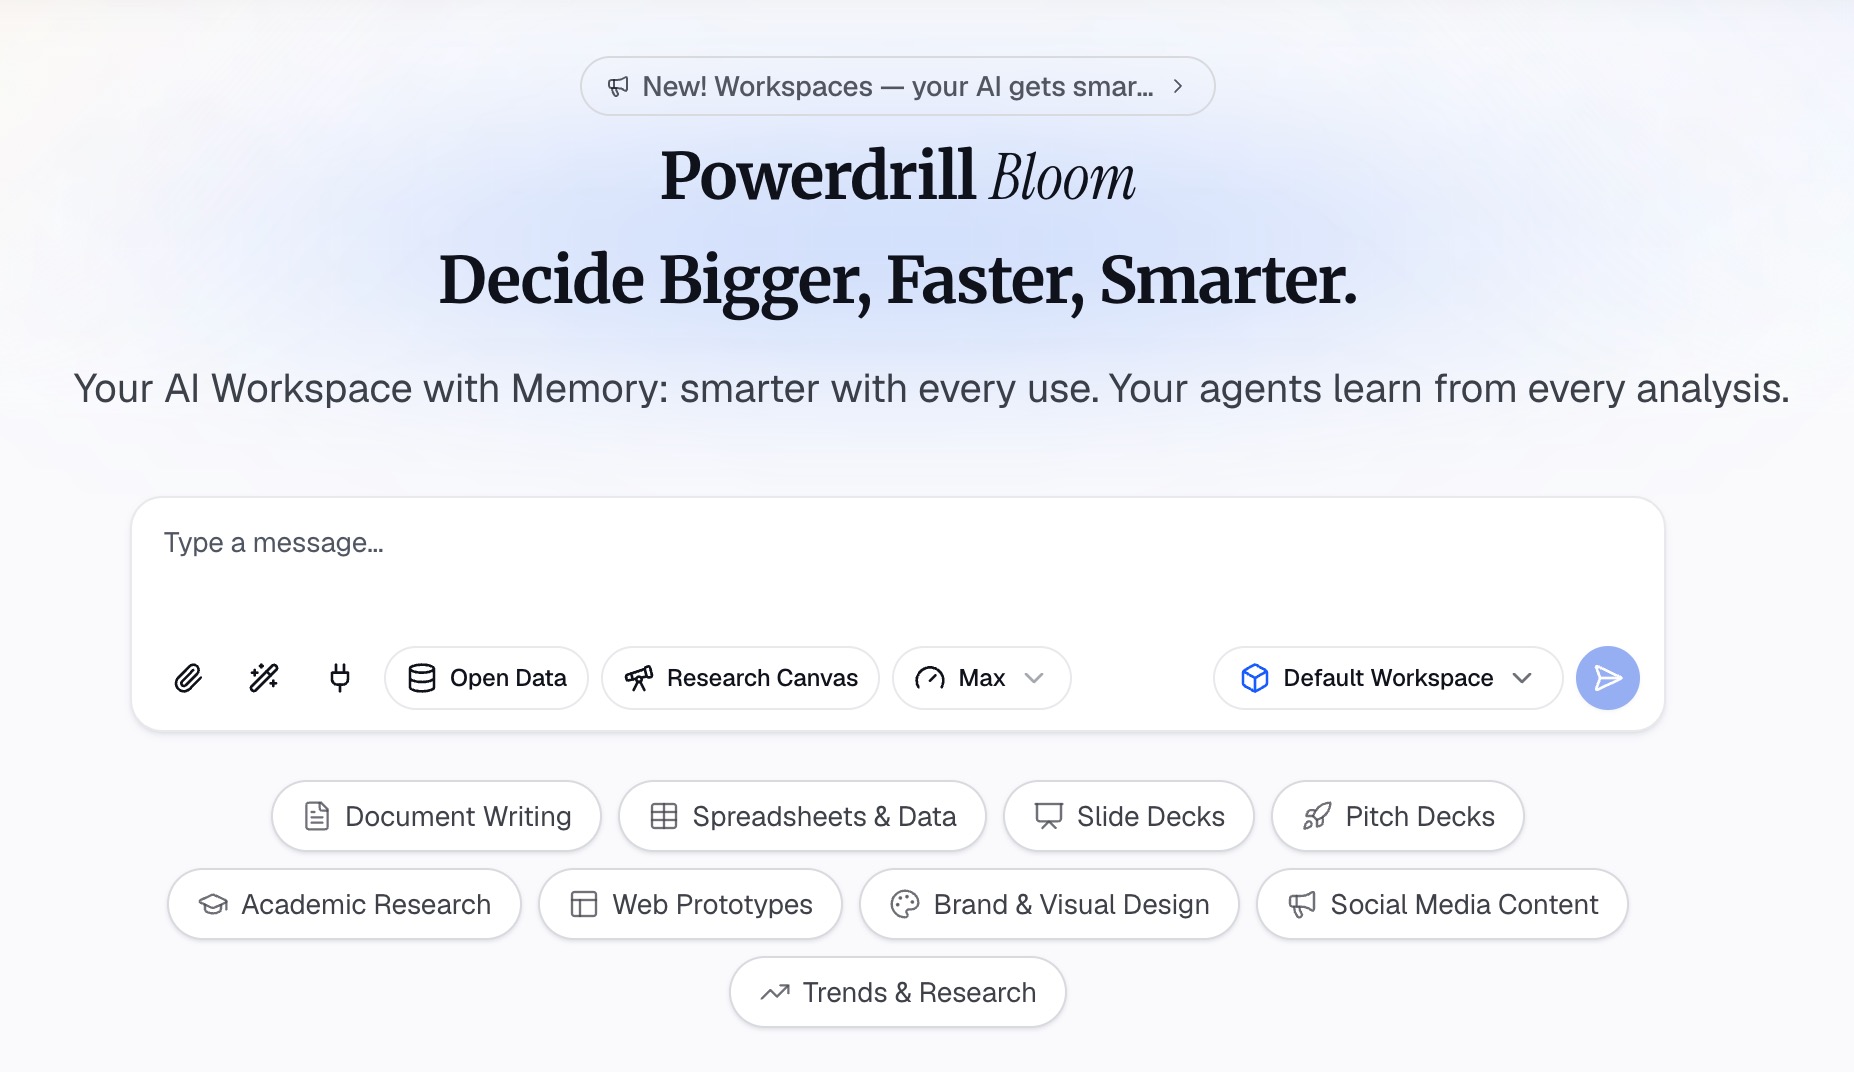
Drop the CSV or the linked spreadsheet into Powerdrill Bloom. Multi-select columns, blank optional answers, and text labels for scales all come in as they are, so you do not need to clean them first.
Step 2: Describe the report in natural language
State the deliverable rather than the steps. For example: "Summarize this employee survey. Give me the response rate and a chart for each rated question, all split by department. Group the free-text answers into themes with two example quotes each."
The agent parses the multi-select columns, decides which questions are comparable, builds the cross-breaks, and reads the open text.
Step 3: Check the counts, then export
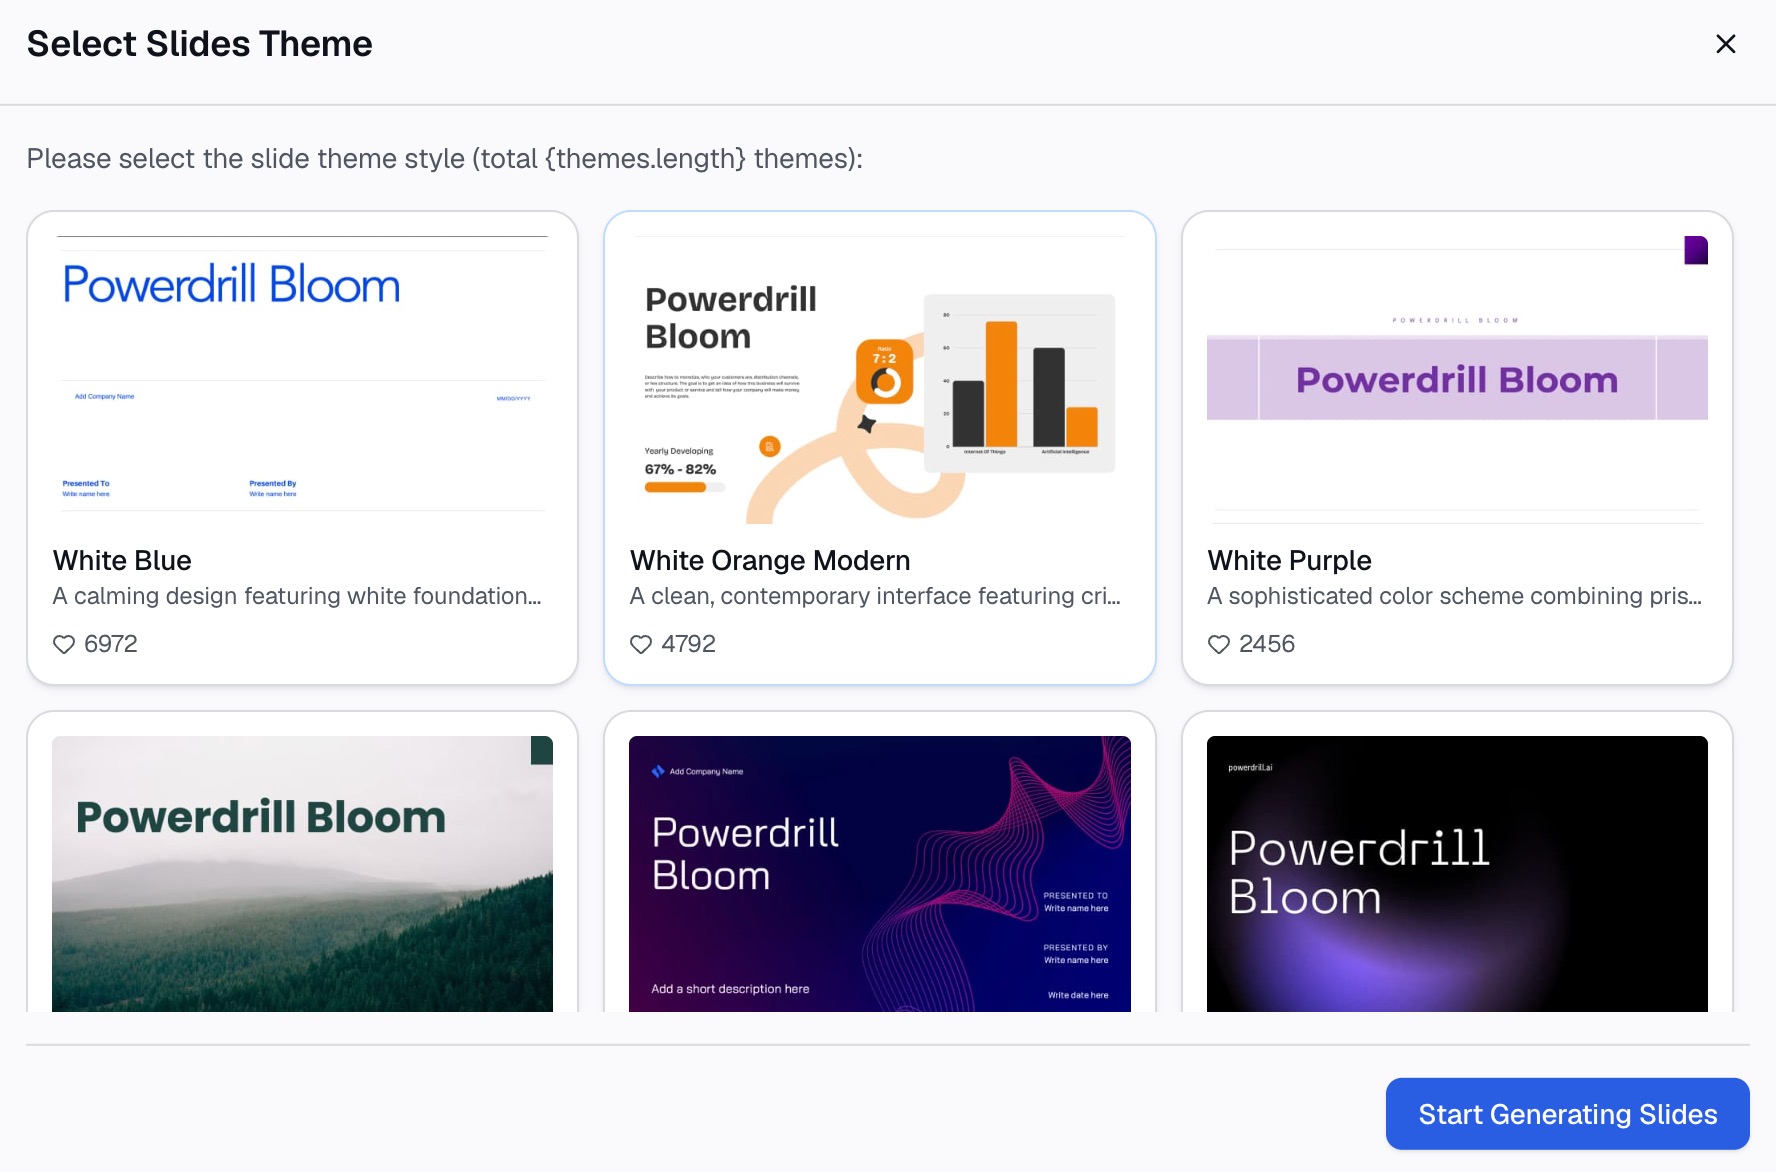
Verify the response count and the segment sizes against the source before anything else. Then export as slides for a readout or as a document for circulation, and note any segment too small to report on.
How to handle open-ended answers
This is the part worth doing properly, because it is the part a chart cannot replace.
Group before you count. Ask for themes first, then for how many comments fall under each. Counting raw keywords produces noise; "slow" and "takes forever" belong together.
Keep the quotes verbatim. A theme with two real sentences under it is persuasive. A paraphrase is not, and it invites an argument about whether anyone actually said that.
Watch for the loud minority. Six angry comments out of four hundred responses is a theme worth naming and a statistic worth stating alongside it. Report both numbers together.
Separate the fixable from the structural. "The export button is hidden" is a backlog item. "We shouldn't be doing this process at all" is a different conversation. Both are valid, and mixing them buries the first.
Common mistakes
Reporting averages on rating scales without the distribution. A mean of 3.0 looks identical whether everyone chose 3 or half chose 1 and half chose 5. Those are opposite situations.
Cross-breaking into segments too small to mean anything. Four responses in a segment is an anecdote. State the segment size next to every split, and suppress the ones below your threshold.
Ignoring partial completions. People who abandon a survey halfway are telling you something about the survey. Report the completion rate, and check whether drop-off clusters around one question.
Comparing waves that asked different questions. If the wording changed between rounds, the trend line is not measuring what it appears to measure. Flag it on the chart.
Treating a single metric as the whole report. A score is a headline, not a finding. If the ask is specifically a score-based readout, an NPS report is a different and narrower deliverable.
Conclusion
The gap between a survey export and a survey results report is mostly mechanical. Reshape the columns, build the same view thirty times, read a few hundred comments. None of it requires judgment until the very end, which is the profile of work worth automating.
Compare options in our roundup of AI software for survey data analysis, or turn your latest export into a report free. For recurring research cycles, the AI report generator and data visualization tool handle the same files.
Google Forms behaviour described here is from Google's own help documentation, retrieved September 1, 2026.
Frequently asked questions
What should a survey results report include?
Sample size and response rate, plus a distribution chart for each closed question. Then cross-breaks by the segments your audience cares about. Finally, grouped themes from the open-ended answers with verbatim quotes, and a short conclusion naming the findings to act on.
How do I export survey responses to analyze them?
In Google Forms, open the Responses tab and either link the form to Sheets or use the More menu to download responses as a CSV. Other survey platforms offer an equivalent export; a flat file with one row per respondent is what you want.
Can AI analyze open-ended survey answers?
Yes, and this is where it saves the most time. Ask for themes first and counts second, request verbatim example quotes under each theme, and always report how many comments sit behind a theme.
How do I handle multi-select questions in a survey export?
They usually arrive as a single cell holding comma-separated choices. An AI agent can split them into per-option counts directly from the raw export, so you do not need to build helper columns first.
How large does a segment need to be before I report on it?
Set a floor before you look at the data, state every segment size on the chart, and suppress anything under the floor. A cross-break with a handful of responses invites confident conclusions that the survey does not support.