How to Create a Landing Page Report with AI: Complete Guide
A landing page report ranks the first pages people arrive on by how well each one holds attention and produces a key event. Build it in three moves. Export the GA4 Landing page report, join it to the pages you actually care about, then read engagement and key events per page. Traffic volume tells you what search sends you. It does not tell you what is working.
What the GA4 Landing page report gives you
Start with what Google already provides, because a lot of teams rebuild something that exists.
Google's documentation describes the Landing page report as "a pre-made detail report that helps you understand how visitors interact with your website." It shows the first page a visitor lands on and how many visitors land on each page. The stated purpose is to "help you identify which pages are performing well and which ones need improvement."
Finding it takes three clicks. Per the documentation: sign in to Google Analytics, select Reports from the left menu, then click Engagement > Landing page. The same page has a note for when the report is missing. It may have been removed from your default view, and Editors and above can add it back.
The report ships with one dimension and six metrics.
| What it is | Definition per Google's documentation |
|---|---|
| Landing page (dimension) | The page path and query string associated with the first pageview in a session |
| Sessions | The number of sessions that began on your website or application |
| Active users | The number of distinct users who visited your website or application |
| New users | New unique user IDs logging a first_open or first_visit event |
| Average engagement time per session | Average time the site was in focus in the browser during each session |
| Key events | The number of times users triggered a key event |
| Total revenue | Purchases plus in-app purchases plus subscriptions plus ad revenue |
Two notes from that documentation are easy to miss. Key events are not automatic — you populate that metric by marking an event as a key event. And if your pages get localized, the Page title dimension appears in the localized language, which splits one page across several rows.
Where the built-in report stops
The built-in report is a good table. It is not yet a report someone can act on, for three reasons.
It ranks by whatever column you sort. Sessions descending puts your homepage first every time, which is true and useless.
It ships with one dimension. That dimension is the landing page path and query string. The documentation notes that you can add a secondary dimension to customize the report. Even so, the grouping that says which of your pages matter is yours to define.
Your own segmentation lives elsewhere. Page groups, funnel stage, content owner, and campaign intent usually sit in a spreadsheet rather than in the report. Without them, a pricing page with 400 sessions and a blog post with 40,000 sessions appear as peers.
That last point is where the real work sits. Google's documentation does cover narrowing the view. You can apply a filter, or use the search bar above the table to find pages starting with /store. That handles one slice at a time. A report handles all of them at once.
What you need before you start
Two files, plus one decision.
- The GA4 Landing page export, covering a period long enough to be stable. Include sessions, active users, engagement time, and key events.
- A page inventory — a simple sheet mapping each URL to a group, an owner, and a purpose.
- The decision: which key event counts as success for this report. A newsletter signup and a purchase are both key events and they are not comparable.
The page inventory is the piece most teams lack, and it is what turns a table into a report. It can be twenty rows in a spreadsheet.
How to build the report manually
Option 1: Sort the GA4 table and screenshot it. Fast, and it answers nothing. Any question beyond "which page gets the most traffic" requires leaving the screenshot behind.
Option 2: Export to a sheet and add a rate column. Export the report, then compute key events divided by sessions per row. This is the minimum useful version. It breaks when URLs carry query strings, because /pricing and /pricing?ref=x become separate rows that both need collapsing.
Option 3: Join the export to your page inventory. Look up each landing page in your inventory to attach group and owner, then aggregate by group. This is the correct shape and the slowest, because the join reopens every time someone publishes a page.
The maintenance cost is the reason these reports get built once and then quietly abandoned.
How to create a landing page report with AI
Step 1: Upload the export and your page inventory
Drop the GA4 CSV export and the page inventory sheet into Powerdrill Bloom together. Excel and CSV are both accepted, and the columns do not need to match beforehand.

Step 2: Describe the report in natural language
Say what decision the report supports. For example: "Collapse landing pages to their path, ignoring query strings. Join to my inventory on URL. Give me sessions, engagement time, and key event rate by page group. Then list the ten pages with the most sessions and the lowest key event rate."
That last clause is the whole report. High traffic plus low conversion is the shortlist worth someone's week.
Step 3: Review the collapsed rows, then export
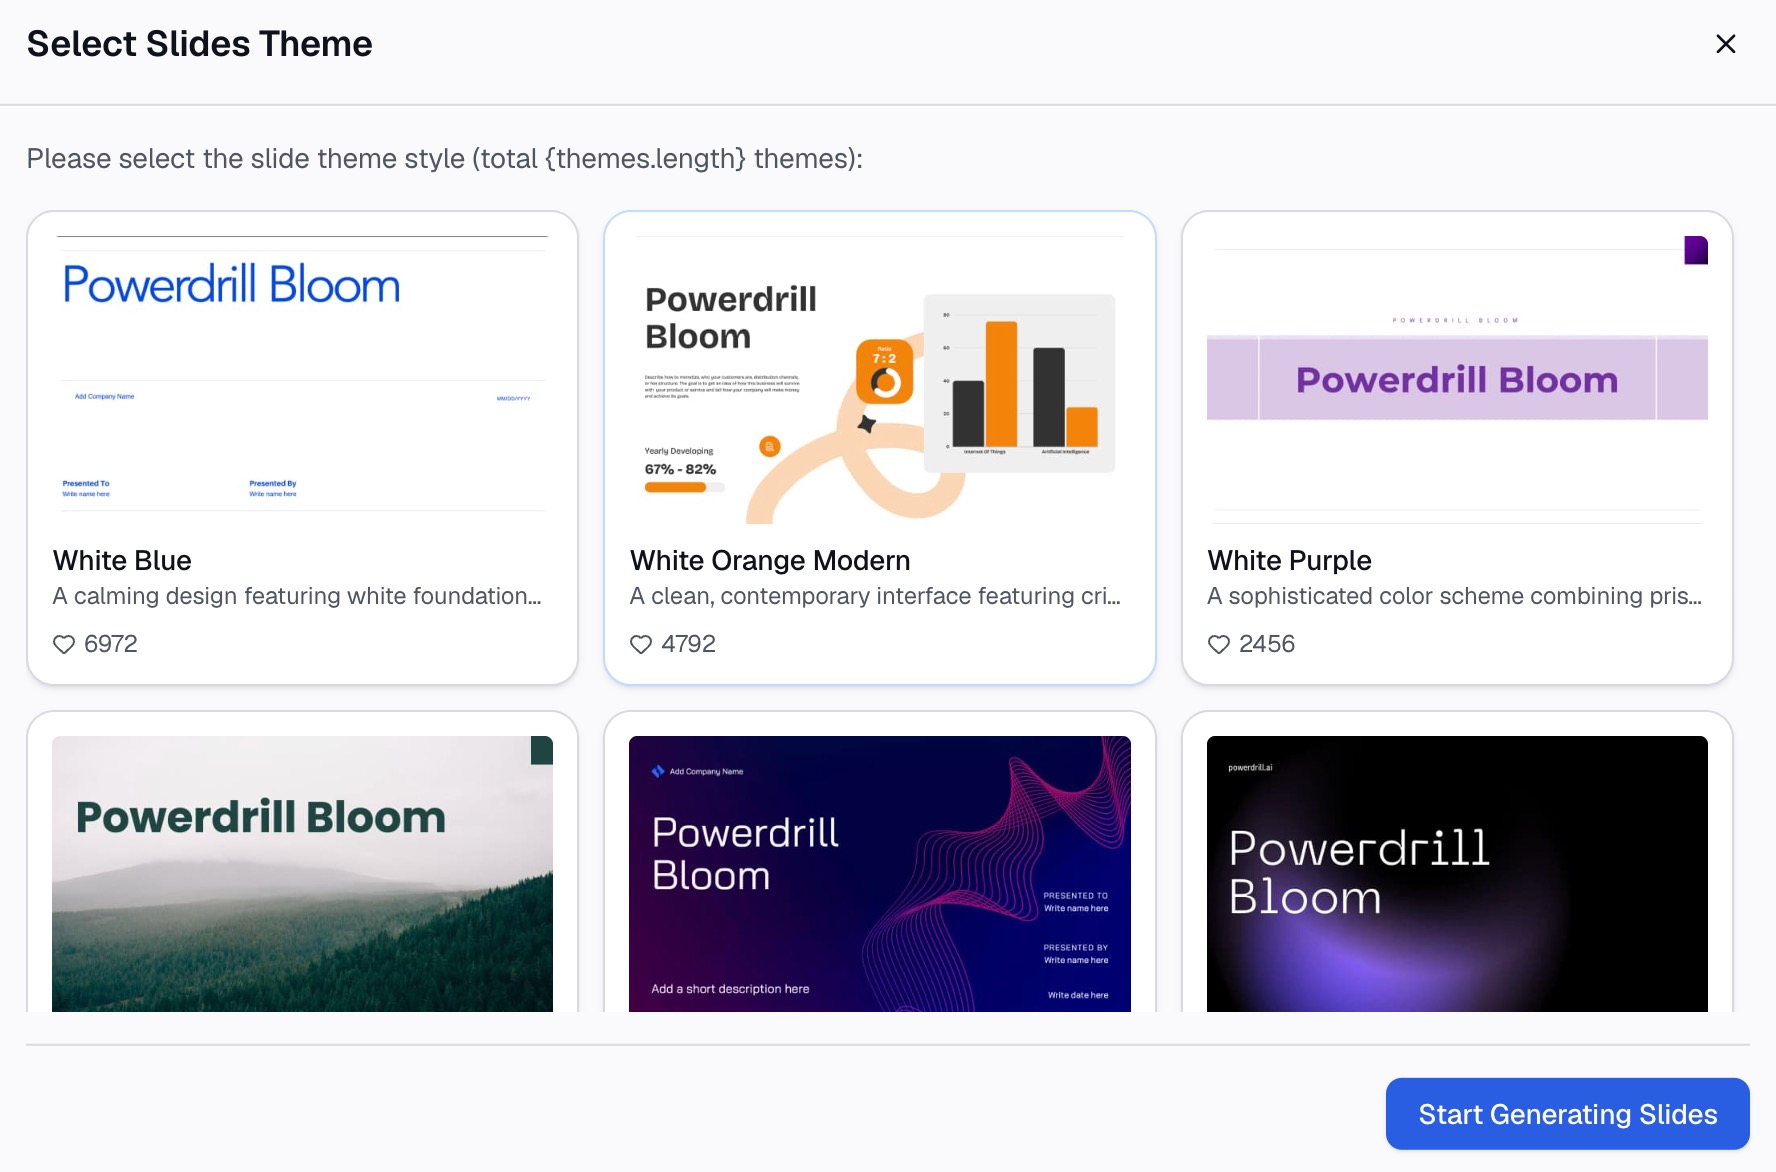
Check which URLs got grouped together and which failed to match your inventory — unmatched rows are usually new pages nobody logged. Then export as a sheet, a document, or slides. Set a scheduled task if this is a monthly review, so the next version rebuilds itself.
What to actually look for
Four patterns are worth a section each in the finished report.
High sessions, low key event rate. Your biggest opportunity, and usually a mismatch between what the page ranks for and what it offers.
Low sessions, high key event rate. A page that works and nobody can find. This is a distribution problem, not a page problem.
Falling engagement time on a stable page. Something changed — a template, a load-time regression, or the search intent behind the query.
A page group with no owner. Every inventory has one. It is where content goes to age.
One thing the built-in tooling does well here is the next hop. Google's documentation explains that path explorations start from a landing page you choose. Analytics then shows "the top 5 pages that your users viewed after landing on that page." That is the fastest way to tell a dead end from a doorway.
Common mistakes
Reading sessions as performance. Sessions measure what search and referrals sent you. They are the input, not the result.
Comparing landing pages across intents. A comparison page and a support article are not competing on the same metric, and ranking them together produces a meaningless list.
Forgetting that the report is session-scoped. Google's documentation notes that the report uses session-scoped dimensions, so the same user visiting twice through two different pages is measured on both.
Leaving key events unmarked. If nothing is marked as a key event, the metric is zero everywhere and the report silently becomes a traffic table.
Cutting a period that includes a site change. A migration or template release mid-period makes the before-and-after incomparable. Note it on the report rather than letting the reader guess.
For the trend view of the same data, see visualizing website traffic trends from a CSV export. For paid channel spend, a channel ROAS report covers a different question from the same family.
Conclusion
The GA4 Landing page report gives you an accurate table. Turning it into something a team acts on takes two additions: your own page grouping, and a rate column that puts traffic next to outcome.
Both are joining work. Hand that to an agent and spend your time on the shortlist it produces.
Build your first landing page report free from an export you already have. For recurring marketing reporting, the AI report generator and the AI graph maker work from the same files.
Google Analytics documentation quoted here was retrieved on September 2, 2026.
Frequently asked questions
What is a landing page report?
It is a report ranking the first pages visitors arrive on by engagement and key events, not just by session volume. GA4 provides the underlying table, and a useful report adds your own page grouping and a conversion rate per page.
Where is the Landing page report in GA4?
Sign in to Google Analytics, select Reports from the left menu, then click Engagement and Landing page. If it is missing from the navigation, an Editor or Administrator can add it back to the default view.
What metrics are in the GA4 Landing page report?
Sessions, active users, new users, average engagement time per session, key events, and total revenue. Key events only populate once you have marked an event as a key event.
Why do my landing pages appear as duplicate rows?
The Landing page dimension includes the query string, so the same path with different parameters appears separately. Localized page titles split rows too. Collapsing to the path is usually the first step in any report.
Can AI build a landing page report from a GA4 export?
Yes. Upload the CSV export with a sheet mapping URLs to page groups, then describe the report in natural language. The URL collapsing, the join, and the ranked shortlist come out of a single run.