How to Answer Data Questions in a Presentation (Without Guessing)
Almost every question you get about a chart falls into three kinds. What does this number mean, what is underneath it, and could something else explain it. Prepare one answer for each kind and you will handle most of the room.
The failure is rarely ignorance. It is that the deck holds conclusions while the questions are about the layer beneath, and that layer was closed hours ago.
This guide covers why live questions are hard, the three ways people prepare, and where preparation stops being enough.
Why data questions are hard to answer live
A slide is a compression. You spent an afternoon deciding which cut mattered, then showed the result. The reasoning stayed in your head, or in a file on your laptop.
The questions arrive at the compressed layer. Someone asks whether that includes trials, or what the same chart looks like for enterprise only, or whether the drop is just seasonality. Each one asks you to decompress something you already put away.
Timing makes it worse. You have a few seconds, an audience watching, and no way to re-run an analysis while people wait.
There is also a social trap. Saying "I don't know" once is fine and reads as honest. Saying it three times reads as unprepared. People then start estimating out loud, and an estimate that turns out wrong costs more than the pause would have.
There is a fourth reason people underestimate this. Data questions are not really about the chart; they are about whether the presenter understands their own numbers. The audience is testing the analyst as much as the analysis.
What this costs you
The decision gets deferred. The most common outcome is not disagreement. It is "come back when you have that number," which turns a decided meeting into another meeting.
Your other numbers get discounted. One shaky answer changes how the room reads the rest of the deck, including the parts that were solid.
You inherit follow-ups you did not plan. Every improvised promise becomes a task. Three questions can generate a day of work that nobody asked for in writing.
The three costs are connected. A deferred decision produces a follow-up, and the follow-up arrives with lower credibility than the original meeting had.
The workarounds people try
All three approaches below try to solve the same thing: turning data questions from a live improvisation into something you already wrote down.
Option 1: Pre-mortem the three question types
Before the meeting, write the answer to each kind of question for every chart you are showing.
For definitions, write down exactly what the metric includes and excludes. For depth, know the next level down: which segments, which accounts, which weeks make up the number. For alternative explanations, name the one competing story a sceptic would raise and say whether you checked it.
This is the highest-value preparation available and it is cheap. Its limit is coverage, because you are guessing which cuts will be asked for, and you will miss some.
Option 2: Keep a one-page definitions and assumptions sheet
Put every metric definition, filter and exclusion on one page beside you. Date range, currency, whether refunds are netted, which records were dropped and why.
Reading a definition from a sheet is faster and more credible than reconstructing it from memory. It also stops the quiet drift where you answer the same question two different ways in one meeting.
The ceiling is that a definitions sheet answers the first question type well and the other two barely at all.
Option 3: Bring the layer underneath
Have the detail behind each chart open in another window: the table, the pivot, the row-level extract. When someone asks what is inside the number, you show it instead of describing it.
Done well this is the strongest option, because it converts a challenge into a shared look at the data. Our guide to building a monthly business review deck covers assembling that material alongside the slides.
Decide in advance how far down you will go. One level below the chart is usually enough, and two levels turns a meeting into a debugging session.
Its cost is preparation time, and it still only covers the cuts you anticipated. A genuinely new question needs new analysis, and that is the wall all three options hit.
The shared ceiling. Every method above depends on predicting the question. Prediction works for maybe four questions in five, and the fifth is usually the one the decision hangs on.
How to prepare for data questions with Powerdrill Bloom
Step 1: Upload your data
Upload the file the deck was built from, not a summary of it. Powerdrill Bloom profiles the columns on arrival, so the definitions you will be asked about are visible rather than remembered.
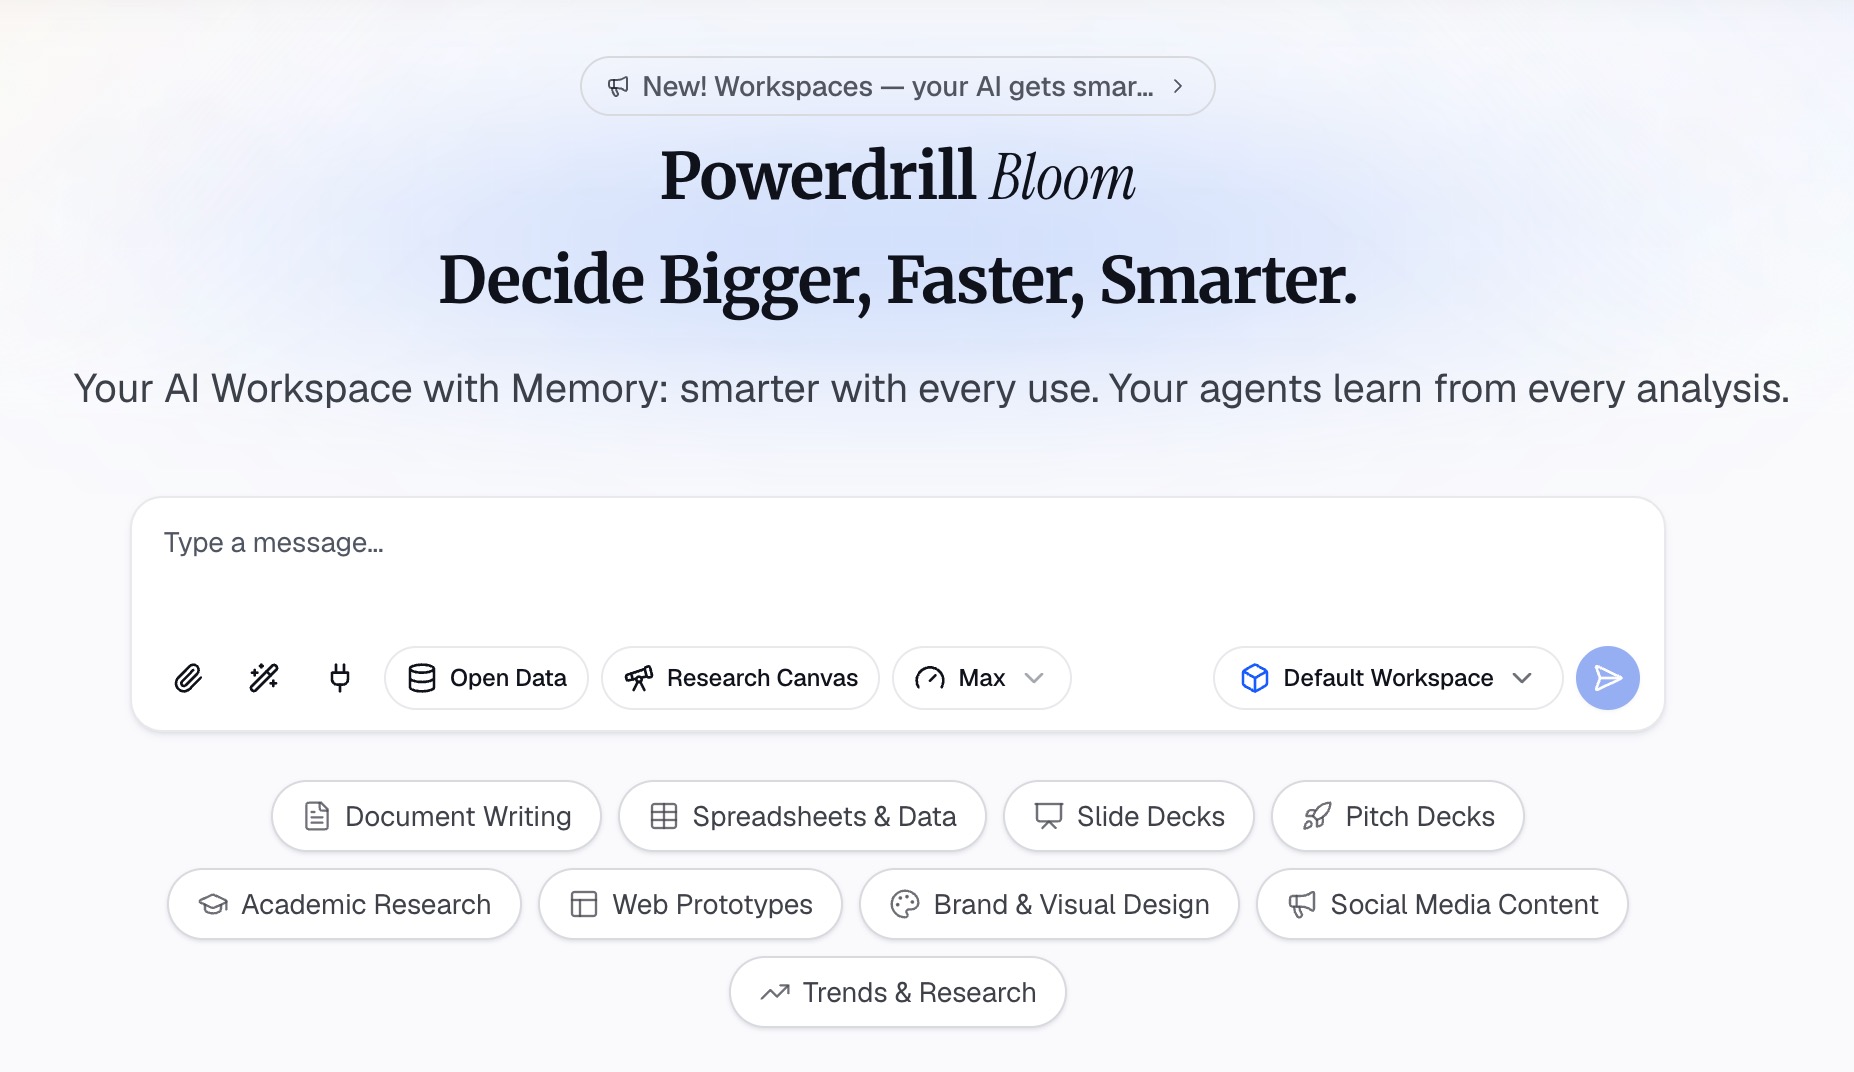
Step 2: Ask the likely questions in natural language
Interrogate your own conclusion before the room does. Ask what the same chart looks like with trials excluded, and which segments drive the total. Then ask whether the pattern held in the same period last year.
Write the answers down, because rehearsed answers to data questions sound different from improvised ones.
Then ask the sceptic's question directly. Ask what alternative explanation the data is compatible with, and what would have to be true for the opposite conclusion to hold.
Step 3: Export the chart, report, or deck
Take out the backup charts, a short written note of definitions and caveats, or extra slides for an appendix.
Why this beats guessing in the room
| Manual preparation | Powerdrill Bloom | |
|---|---|---|
| Anticipated cuts | Build each one by hand | Ask for several in one pass |
| An unanticipated cut | Promise a follow-up | Ask it live against the same file |
| Metric definitions | Maintain a separate sheet | Visible from the profiled data |
| Next month's deck | Repeat the preparation | Upload the new export |
The third row matters more than it looks, because a definition dispute can end a meeting faster than a wrong number.
The second row is the one that changes a meeting. When a new question costs one sentence instead of a follow-up email, the decision happens while everyone is still in the room.
Common mistakes
Estimating out loud. A number you half-remember will be quoted back to you. Say you will confirm it, write it down, and move on.
Answering a question you did not understand. Ask what they mean by the term before answering. Two people using "active user" differently will both leave the meeting wrong.
Defending instead of noting. If the challenge is valid, saying so buys more credibility than a rescue attempt. Record it and continue.
Hiding the caveat until asked. State the exclusion when you show the chart. A caveat volunteered reads as rigour, and the same caveat extracted reads as concealment.
Bringing the raw file with no map. Opening a spreadsheet you cannot navigate in front of an audience is worse than not having it. Know where the answer lives.
Treating data questions as an attack. Most are genuine attempts to understand. Answering defensively converts a curious room into a sceptical one.
Promising follow-ups you will not do. Three casual promises become a day of work. Commit to one and say the others need scoping.
Conclusion
Questions about a chart come in three kinds, and each has a different preparation. Write the definition, know the layer underneath, and name the competing explanation before someone else does.
Practise the three question types out loud once beforehand. Rehearsing data questions is cheaper than fielding them cold.
What preparation cannot cover is the question nobody predicted, and that is usually the one that matters. If you would rather answer it live than promise a follow-up, try Powerdrill Bloom on the file behind your next deck. See also our guides to telling data stories and turning a CSV into a chart, plus the auto insights page.
Frequently asked questions
How do I prepare for data questions in a presentation?
Write three answers for every chart: what the metric includes, what the next level of detail shows, and which alternative explanation you ruled out. Those three cover most of what gets asked.
What should I say when I do not know a number?
Say you will confirm it and write the question down. Estimating aloud creates a figure that will be quoted back to you, and a wrong figure costs more than a pause.
Should I put caveats on the slide or wait to be asked?
Put them on the slide, next to the number they affect. A stated exclusion reads as rigour, while one that surfaces under questioning reads as something you were hoping to avoid.
How much backup detail should I bring?
Enough to show one level below every chart you present, and no more. Volume is not the goal; being able to find the answer quickly is.
What if someone challenges my method?
Acknowledge it plainly if the point is fair, record it, and keep going. Trying to defend a method live usually costs more credibility than accepting a valid criticism.