How to Analyze Stocks Using AI: A Full Guide
To analyze stocks, start by understanding what the company sells and how it makes money. Then read its financial statements and check a few key ratios, such as P/E and operating margin. Compare them with past years and with peers. Finally, look at price history and risk. AI can pull the filings and prices, calculate the ratios, and lay out the results for you to check.
This guide explains each step with formulas, a worked example, and the mistakes beginners make most often. It also shows how to analyze stocks using AI from public filings and price data. It is an education guide, not investment advice.
What it means to analyze a stock
A stock is a share of a business. Investor.gov, the investor education site of the US Securities and Exchange Commission (SEC), puts it simply. "Stocks are a type of security that gives stockholders a share of ownership in a company."
So to analyze stocks is mostly to analyze businesses. You want to know three things:
- How good is the business? Look at sales, profits, and debt.
- What are you paying for it? Compare the share price with the company's earnings.
- What could go wrong? Look at risks inside and outside the company.
This guide focuses on fundamental analysis, which works from the company's own reports. Chart reading, or technical analysis, is a separate skill.
Investor.gov is also direct about risk. It says "There’s no guarantee that the company whose stock you hold will grow and do well." As a result, "you can lose money you invest in stocks." Careful analysis improves your judgment. It does not remove that risk.
Before you start: what you need
Gather these before you analyze stocks:
- The latest annual report, Form 10-K. Investor.gov says it "provides a comprehensive overview of the company's business and financial condition and includes audited financial statements."
- The latest quarterly report, Form 10-Q. It shows the most recent quarter.
- Price history. At least one year of daily prices, and ideally five years.
- Two or three peer companies. Ratios only mean something next to similar businesses.
- A spreadsheet. Excel or Google Sheets is enough for the ratios below.
You can find a company's filings on the SEC's EDGAR database. Investor.gov says "Researching investments is part of an investor’s due diligence." It also warns: "If a company is not registered with the SEC, it could be a red flag."
Step back: understand the business first
Before any number, read the business section of the 10-K. Write down, in two or three sentences, how the company makes money.
Ask these questions:
- What does it sell, and to whom? One product or many? Consumers or businesses?
- Where does revenue come from? Many 10-Ks break sales down by segment or region.
- Who are the competitors? The 10-K usually names the main ones.
- What are the main risks? The risk factors section lists what management worries about.
Investor.gov groups stocks into types that help here. "Growth stocks have earnings growing at a faster rate than the market average." "Income stocks pay dividends consistently." Value stocks "have a low price-to-earnings (PE) ratio, meaning they are cheaper to buy than stocks with a higher PE."
Knowing the type sets your expectations. A growth company may show losses while it expands. An income company should show steady cash to pay its dividend.
Read the financial statements
Every 10-K includes three core statements. The SEC's Beginners' Guide to Financial Statements explains each one.
The income statement shows revenue, costs, and profit over a period. The SEC says the bottom line "usually shows the company’s net earnings or losses."
The balance sheet shows what the company owns and owes at one date. Our guide on how to analyze a balance sheet covers it in depth.
The cash flow statement shows cash coming in and going out. The SEC notes that an income statement "can tell you whether a company made a profit." A cash flow statement "can tell you whether the company generated cash."
Read at least three years side by side. Look for these patterns:
- Revenue growth. Is it steady, speeding up, or slowing down?
- Profit compared with revenue. Are profits growing faster or slower than sales?
- Cash compared with profit. Profit without cash can be a warning sign.
- Debt. Is borrowing rising faster than the business?
Then read the notes and the management discussion. The SEC says the MD&A is "management’s opportunity to provide investors with its view of the financial performance and condition of the company."
Check key ratios
Ratios turn the statements into numbers you can compare. The SEC lists several in its guide and adds a key warning: "As a general rule, desirable ratios vary by industry."
Earnings per share (EPS). The SEC explains: "To calculate EPS, you take the total net income and divide it by the number of outstanding shares of the company."
Price-to-earnings (P/E) ratio. The SEC says the P/E ratio "compares a company’s common stock price with its earnings per share."
P/E Ratio = Price per share / Earnings per share
The SEC gives an example. If a stock "is selling at $20 per share and the company is earning $2 per share," its P/E is 10 to 1. A high P/E means investors pay more for each dollar of earnings, often because they expect growth.
Operating margin. The SEC says it "compares a company’s operating income to net revenues."
Operating Margin = Income from Operations / Net Revenues
It shows how much of each sales dollar is left after running the business.
Debt-to-equity ratio. This divides total liabilities by shareholders' equity. A rising ratio means the company relies more on borrowing.
Calculate each ratio for three to five years. Then put the same ratios side by side for two or three peers. A P/E of 30 may look high alone and normal for the industry.
Look at price history and risk
The share price tells you what the market is paying today. History shows how much that price can move.
Chart at least five years of prices. Mark the big drops and check what happened in the filings or news at that time. This shows you how the stock behaved in bad periods.
Investor.gov gives a useful reality check. It says "Large company stocks as a group, for example, have lost money on average about one out of every three years." It adds that a price "can be affected by factors inside the company, such as a faulty product." It can also move on "events the company has no control over, such as political or market events."
Two simple checks help:
- Compare with an index. Chart the stock against a broad market index over the same years.
- Compare with peers. A drop that hit the whole industry tells a different story from one that hit only this company.
Investor.gov also notes how investors spread risk. "The risks of stock holdings can be offset in part by investing in a number of different stocks."
A simple checklist to analyze stocks
Use this list each time you analyze stocks, so you cover the same ground for every company.
- Describe the business in two or three sentences.
- Note the stock type: growth, income, value, or a mix.
- Read three years of the income statement, balance sheet, and cash flow statement.
- Calculate EPS, P/E, operating margin, and debt-to-equity for each year.
- Put the same ratios side by side for two or three peers.
- Chart five years of prices against an index and against peers.
- Read the risk factors and the MD&A in the latest 10-K.
- Write down the two biggest questions the numbers leave open.
A checklist keeps you honest. It is easy to skip the debt line when you like the growth story. Writing the open questions down also shows what to watch in the next quarterly report.
How to analyze stocks using AI
When you analyze stocks by hand, one company takes hours. Five companies take days. An AI tool can pull the filings and prices, calculate the ratios, and chart the results.
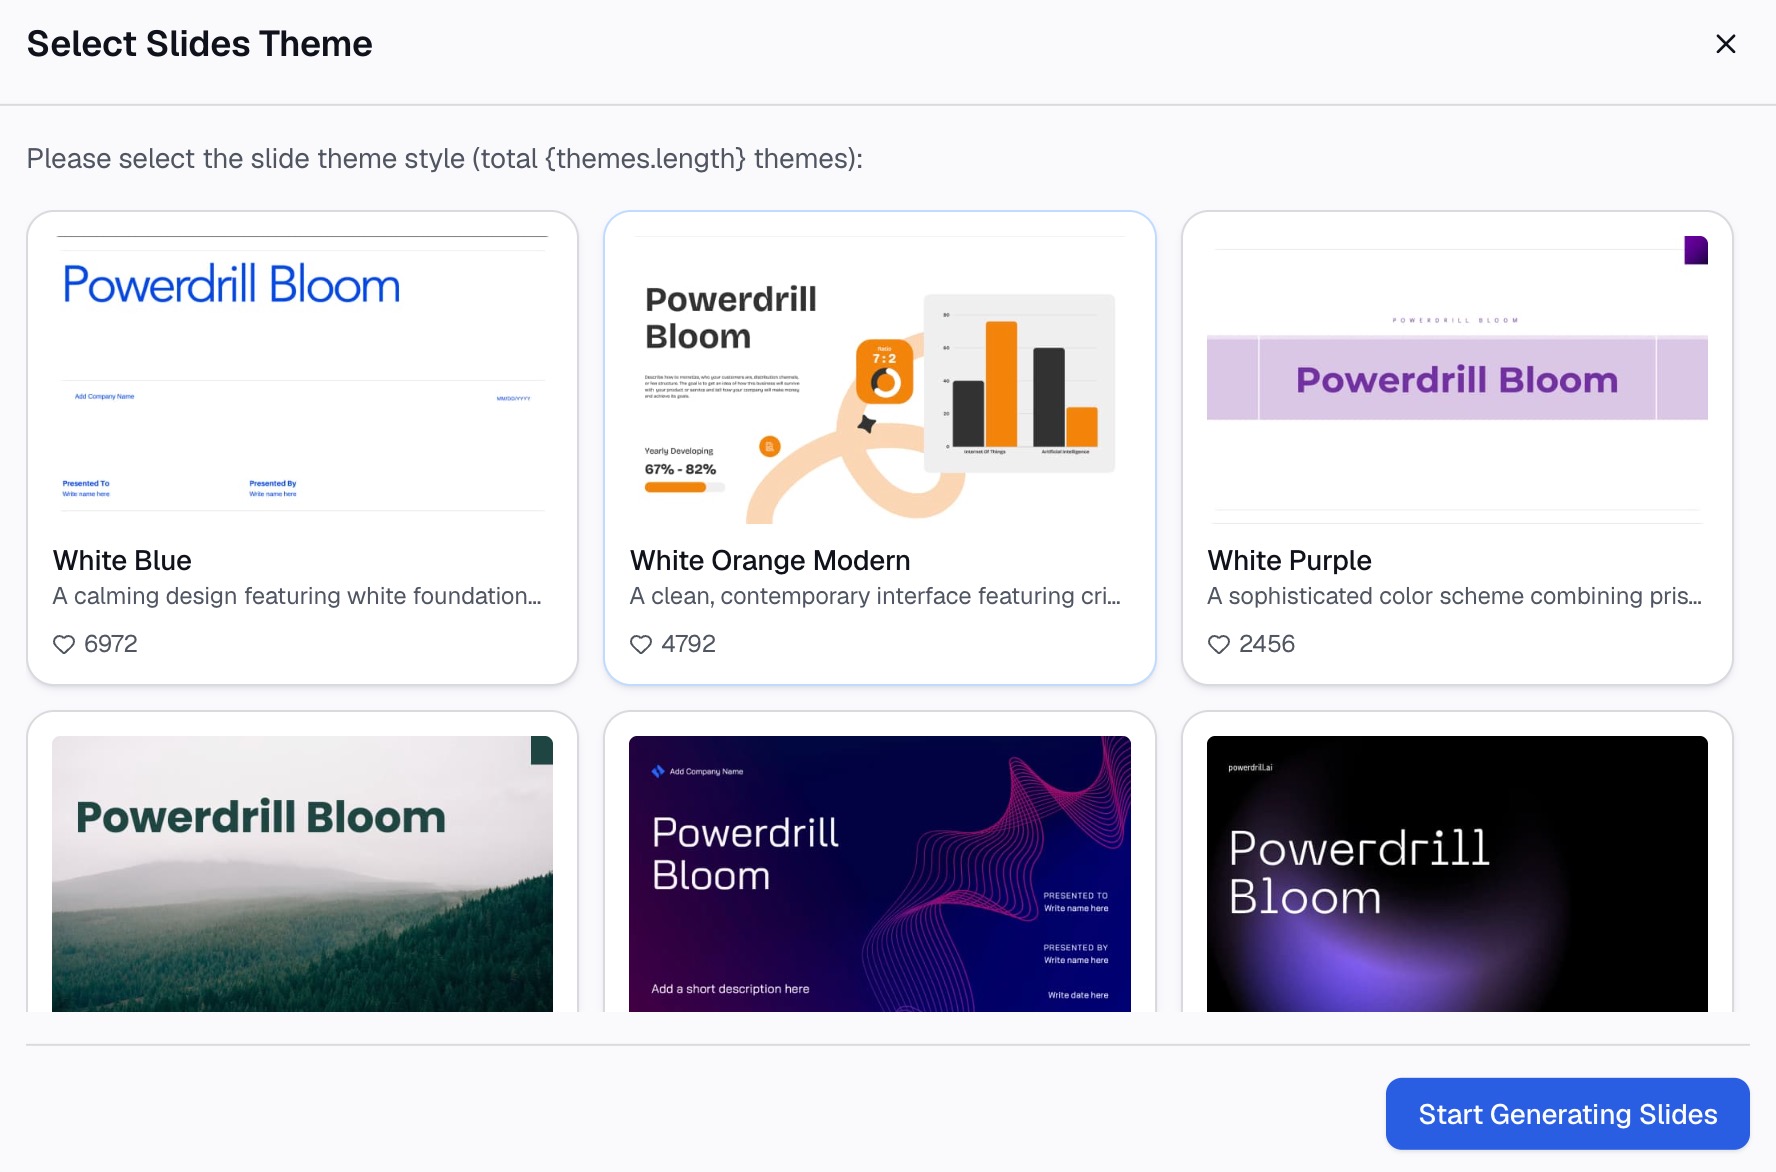
Here is the method in three steps, using Powerdrill Bloom.
Step 1: Pull the filings and price data
Start with the companies and years you want to study. The SEC Filing Search page covers "SEC filings, earnings, balance sheets, income statements, cash flows, dividends, and insider transactions."
For prices, the Financial Market Data page lists "Real-time and historical prices for stocks, crypto, forex, funds, and commodities." It names Yahoo Finance and CoinGecko as its sources.
You can also upload your own spreadsheet of figures from the 10-K.

Step 2: Ask for the ratios and charts in natural language
Describe the analysis you want. For example: "For these three companies, show revenue, operating margin, EPS, and P/E for the last five years. Chart five years of share prices against each other."
The SEC Filing Search page gives sample prompts, such as "Show Apple’s revenue and net income over the last 5 years." The Financial Market Data page suggests "Compare the 1-year returns of NVDA, AAPL, and MSFT."
Then ask follow-up questions, such as "Which company's margin fell the most?" or "What risk factors changed in the latest 10-K?"
Step 3: Check the figures against the filings
Check each ratio against the source. Pick two figures, such as net income and shares outstanding, and confirm them in the 10-K. The filing search page says "Every answer is backed by SEC, with links to the original records."
Treat any summary as a description of the past, not a forecast. The decision to buy or sell stays with you.
For more tools, see our list of Yahoo Finance alternatives for historical data and stock research.
A worked example
Here is a short example for two invented companies in the same industry. All names and figures below are invented.
| Measure | Alder Tools | Birch Tools |
|---|---|---|
| Revenue growth, last 3 years | 12% a year | 4% a year |
| Operating margin | 9% | 15% |
| EPS | $1.50 | $2.00 |
| Share price | $45 | $30 |
| P/E ratio | 30 | 15 |
| Debt-to-equity | 1.8 | 0.6 |
Now apply the steps.
The business. Both sell hand tools. Alder is expanding into new regions. Birch sells mostly to existing retail partners.
Growth. Alder's revenue grows three times faster. That explains part of its higher P/E.
Profitability. Birch keeps more of each sales dollar. Its operating margin is 15% against Alder's 9%.
Price. Alder trades at 30 times earnings ($45 / $1.50). Birch trades at 15 times ($30 / $2.00).
Risk. Alder carries three times Birch's debt relative to equity. If growth slows, that debt matters more.
The questions. The numbers do not pick a winner. They tell you what to read next. For Alder, check whether new regions are profitable yet. For Birch, check whether its retail partners are growing.
Common mistakes when analyzing stocks
Looking at price only. A falling price can mean a cheap stock or a weakening business. The statements tell you which.
Using one year of numbers. One good or bad year can mislead. Use at least three years.
Comparing across industries. The SEC says desirable ratios vary by industry. Compare a software company with software peers.
Ignoring debt. High earnings growth funded by borrowing carries more risk.
Skipping the risk factors. The 10-K lists what management sees as the main risks. Read them before you decide.
Trusting any summary without a check. Whether a person or an AI wrote it, confirm two figures in the filing.
To see more AI options, our older guide to AI stock analysis covers the basics.
Want to practice on real filings? Try Powerdrill Bloom and ask for five years of revenue, margin, and P/E for two companies you already know.
Frequently asked questions
How do you analyze stocks for beginners?
Start by understanding how the company makes money. Then read three years of its income statement, balance sheet, and cash flow statement. Check EPS, P/E, operating margin, and debt-to-equity, and compare them with peers. Finally, review price history and the risk factors.
What is a good P/E ratio?
There is no single good P/E ratio. The SEC notes that desirable ratios vary by industry. Compare a company's P/E with its own history and with similar companies. A higher P/E often means investors expect faster growth.
Where can I find a company's financial statements?
Public US companies file annual reports on Form 10-K and quarterly reports on Form 10-Q with the SEC. You can search them on the SEC's EDGAR database. Investor.gov says the 10-K includes audited financial statements.
Can AI analyze stocks?
Yes. AI tools can pull filings and price data, calculate ratios such as EPS and P/E, and chart the results. Powerdrill Bloom can search SEC filings and historical prices and link each answer to its source. Treat the results as a description of the past, not a forecast.
Is analyzing stocks the same as predicting prices?
No. Fundamental analysis describes a company's business, finances, and valuation. It helps you judge whether a price looks high or low relative to earnings. Investor.gov warns that you can lose money in stocks, and no analysis removes that risk.
Sources: Investor.gov, Stocks FAQs · Investor.gov, Form 10-K · Investor.gov, Researching Investments · US Securities and Exchange Commission, Beginners' Guide to Financial Statements. Details read on October 28, 2026.