10 Best Free AI Tools for Statistical Analysis in 2026
The best free AI tools for statistical analysis in 2026 fall into three groups. Julius AI, ChatGPT, and Claude run tests and models from a chat. IBM SPSS Statistics and Displayr pair classic statistical software with AI that explains the output. Hex, Quadratic, and DataLab write Python or SQL for you. Powerdrill Bloom and Better Analyst turn results into reports and dashboards.
This list is ordered for reading rather than ranked by score. A tool appearing above another says nothing about which suits your data better. Nine of the ten tools have a free plan, and the tenth offers a free trial. Every price below was read from the vendor's own pages on November 13, 2026. Nothing here replaces advice from a statistician on study design.
Quick answer: the best free AI tools for statistical analysis
AI tools for statistical analysis are software that use AI to run tests, fit models, and explain results from your data. Most let you ask in natural language and then show the method they used. Here is how the ten tools split:
- Best for chat-based tests and models: Julius AI, ChatGPT, and Claude.
- Best for classic statistical software with AI help: IBM SPSS Statistics.
- Best for survey and market research statistics: Displayr.
- Best for code you can review and rerun: Hex, Quadratic, and DataLab.
- Best for dashboards from connected data: Better Analyst.
- Best for turning statistical results into reports and slides: Powerdrill Bloom.
10 best free AI tools for statistical analysis at a glance
| Tool | Best for | Starting price (billing basis) | Free plan | Key AI feature |
|---|---|---|---|---|
| Powerdrill Bloom | Statistical summaries, charts, and reports | Pro $13.27/mo | Yes | Automatic correlations and trend detection |
| Julius AI | Statistical analysis from a chat | Plus $20 per month, or $16 per month billed annually | Yes | Models and forecasts from a question |
| IBM SPSS Statistics | Established statistical software | Offer prices only on the day of review | Free trial | AI Output Assistant |
| Displayr | Survey data and market research | Professional from $3,359 per user, billed annually | Yes | Traceable AI survey analysis |
| Hex | Notebooks and analytics teams | Professional $36 per editor per month | Yes | Hex agent |
| Quadratic | AI spreadsheets with Python | Pro $18 per user per month, billed annually | Yes | AI writes formulas, Python, and SQL |
| Better Analyst | Dashboards from connected data | Pro $30 per month, billed monthly | Yes | Charts from a question |
| DataLab | Python, SQL, and R notebooks with AI | Premium $13 per month, billed annually | Yes | AI Assistant that writes and runs code |
| ChatGPT | Quick tests on uploaded files | Go $8 per month | Yes | Python-based statistical analysis |
| Claude | Long files and written explanations | Pro $17 per month with annual billing | Yes | Files and code execution |
Prices were read from each vendor's own page on November 13, 2026.
1. Powerdrill Bloom
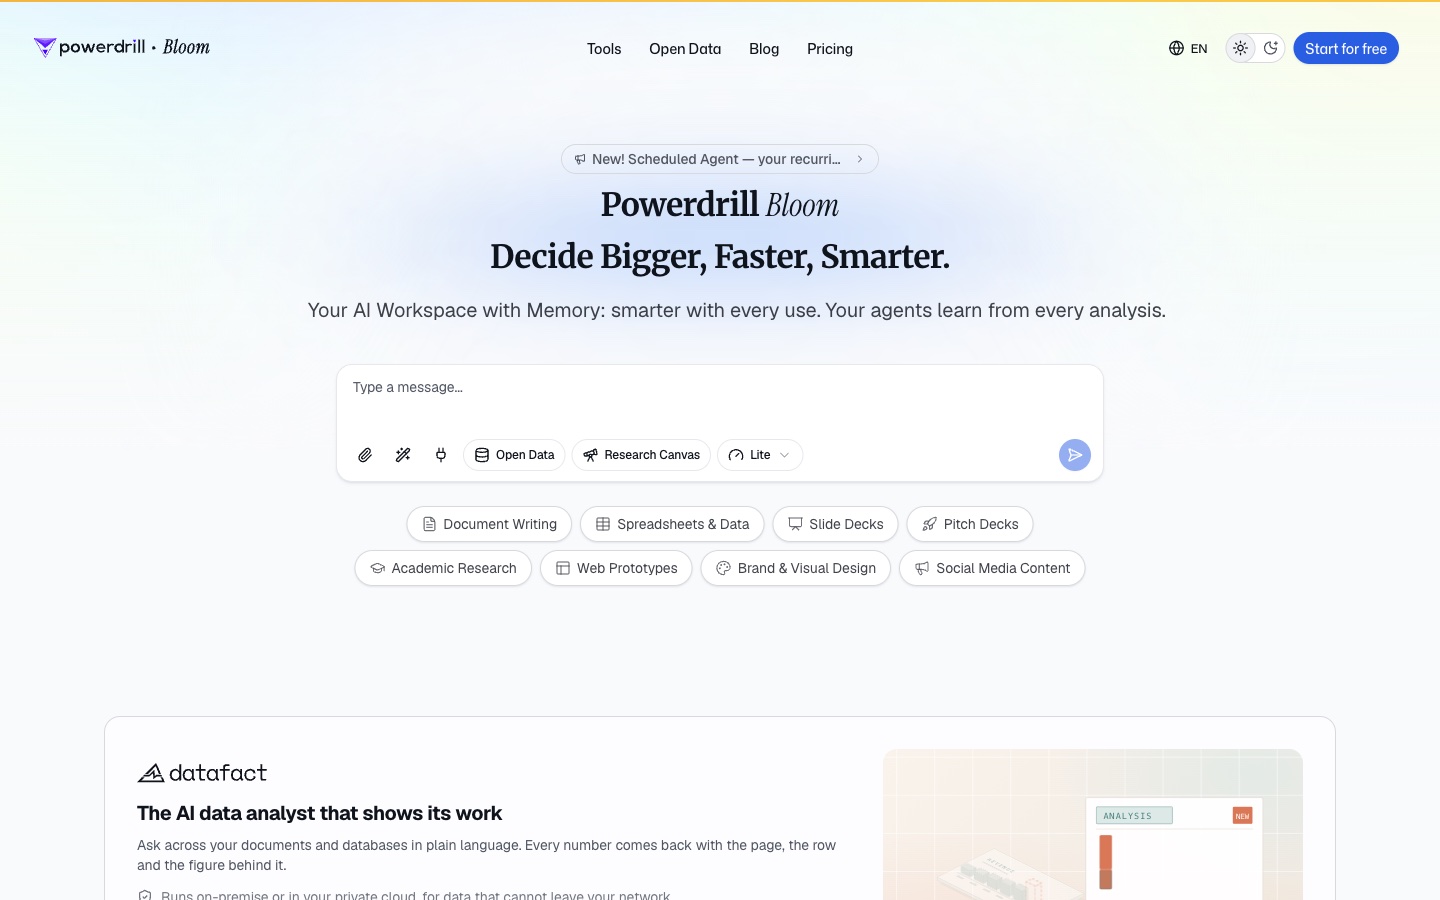
Best for: Analysts, students, and business teams who need statistical results turned into charts and reports.
Powerdrill Bloom is an AI workspace that turns files and data into analysis, reports, and slides. You upload Excel, CSV, or PDF files and ask for the statistics you need in natural language.
For statistical work, several of its tools fit together. The CSV AI Assistant page says it detects "key metrics, trends, and correlations in seconds." The Box Plot Maker "auto-detects medians, quartiles, & outliers in seconds."
Key features
- Automatic exploration. It suggests paths such as performance, comparison, or forecasting.
- Distribution charts. Box plots show the center, spread, and outliers of a variable.
- Spreadsheet statistics. The Excel Calculations page covers standard deviation, growth rate, and CAGR.
- Report output. Results become reports, slides, and charts you can share.
Pros
- Goes from a raw file to a finished summary in one workspace.
- Builds charts without design or coding work.
- Free plan available for everyday exploration.
Cons
- Its feature pages describe correlations, standard deviation, box plots, and trends, not a catalog of named tests such as ANOVA.
- Usage is credit-based, so heavy analysis draws down the allowance faster.
Pricing
The pricing page lists a Free plan at $0.00 and Pro at $13.27/mo. Every plan includes 1,000 daily refreshed credits, and Pro lists "Deep analysis, visualization, and reporting."
2. Julius AI
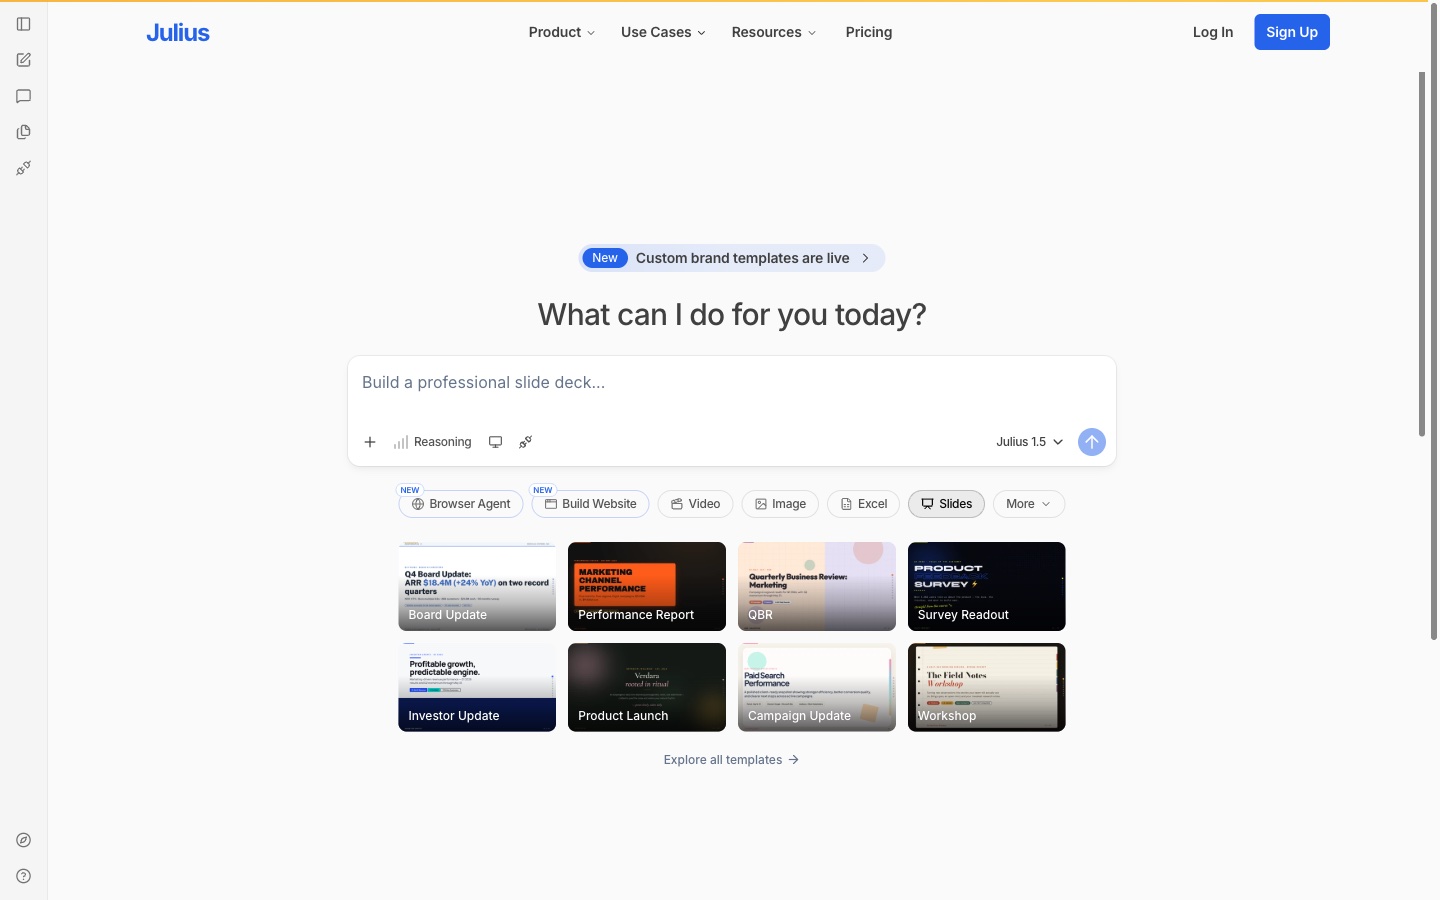
Best for: People who want to run statistical analysis by asking questions about a file.
Julius AI is an AI workspace for analyzing data, research, and creating presentations. Its data analysis page lists "Run statistical analysis" as a core task, next to cleaning data and building charts.
Its Data Science page says "Julius spots correlations, anomalies, and trends in your data." Julius connects to sources such as Snowflake, BigQuery, and PostgreSQL. The pricing page lists Google Drive, OneDrive, and SharePoint on every plan.
Key features
- Statistical analysis from a chat. Ask for a model or forecast and get code, tables, and charts.
- Data connectors. Warehouses and file storage connect directly.
- Scheduled runs. The Free plan lists 3 scheduled runs.
- Reports and slides. Findings can become presentations or websites.
Pros
- Free plan with a daily credit allowance.
- Paid plans include frontier models from OpenAI and Anthropic.
- SOC 2 Type II compliance is listed on the pricing page.
Cons
- The Free plan lists Julius Lite models, not the frontier models on paid plans.
- The Plus plan lists 7-day file storage.
Pricing
The pricing page lists Free at $0 per month. Plus is $20 per month, or $16 per month billed annually, with 2,000 credits a month. Pro is $45 per month, or $37 billed annually. Business is $450 per month, or $375 billed annually.
3. IBM SPSS Statistics
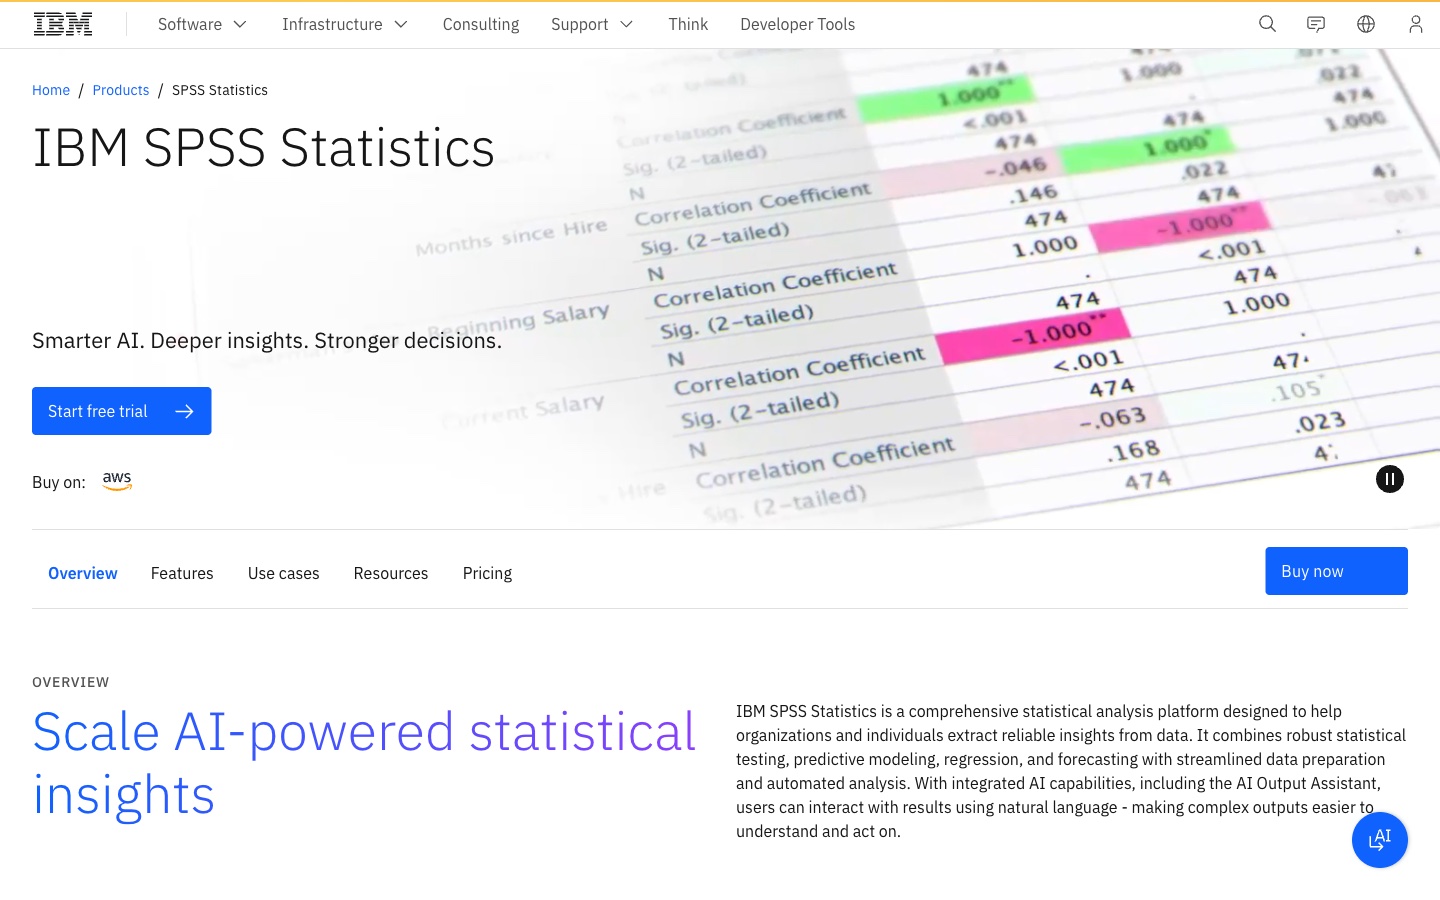
Best for: Researchers and analysts who want established statistical software with AI help on the output.
IBM SPSS Statistics is a long-running statistical analysis platform. IBM says it "combines robust statistical testing, predictive modeling, regression, and forecasting with streamlined data preparation and automated analysis."
The AI layer sits on top of the output. IBM says "The AI Output Assistant instantly translates complex SPSS results into clear, plain-language insights." Users can interact with results using natural language, according to the product page.
Key features
- AI Output Assistant. Explains SPSS output, built with watsonx.ai.
- Advanced statistics. GLMs, mixed models, and 2SLS regression are listed.
- Forecasting and decision trees. ARIMA, smoothing, and neural networks are listed.
- Custom tables. Tables can be exported to Excel or PDF.
Pros
- Wide range of named tests and models in one product.
- IBM's page links a guide to using SPSS Statistics with R and Python.
- Free trial available.
Cons
- There is no free plan, only a free trial.
- Features are split across subscription tiers, so some methods need a higher tier.
Pricing
On the day of review, IBM's pricing section showed only year-end offer prices, so this list does not quote them. Its footnote says prices "may vary by country" and renew "at the then current price." A free trial is available.
4. Displayr
Best for: Market researchers and survey teams who need statistical testing they can trace.
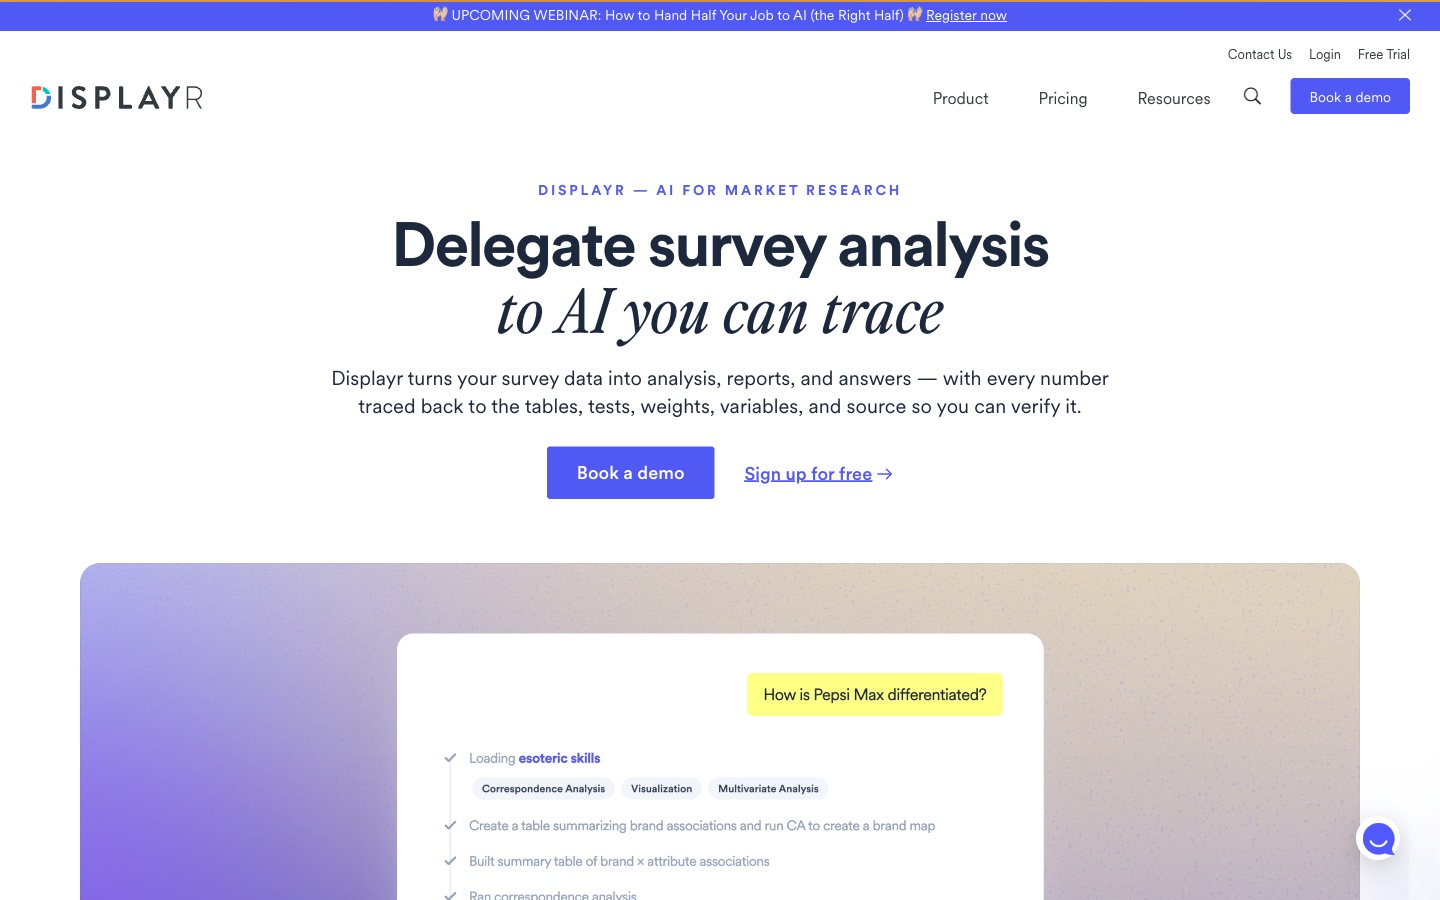
Displayr is analysis and reporting software built for survey data. Its homepage says it "turns your survey data into analysis, reports, and answers." It adds that every number is traced to "the tables, tests, weights, variables, and source."
Displayr separates AI from the math. Its homepage says "The math is done by established statistical algorithms." AI helps orchestrate the work, from cleaning data to building the report.
Key features
- Statistical testing. Listed under its product techniques, with weighting and crosstabs.
- AI text analysis. Categorizes open-ended survey answers.
- Skills. Turns a team's methods into repeatable AI workflows.
- Traceable answers. Claims link back to tables and source data.
Pros
- Built for weighted survey data and significance tests.
- Free plan available, plus a 14-day free trial with no credit card.
- Reports and dashboards stay connected to the data.
Cons
- The Free plan lists "Limited analysis and visualization tools."
- Paid plans are priced per user per year, which is high for one person.
Pricing
The pricing page lists Free from $0. Professional is from $3,359 per user, billed annually. Enterprise is from $4,199 per user, billed annually. Prices are in US dollars.
5. Hex
Best for: Data teams who want notebooks, apps, and an AI agent on the same data.
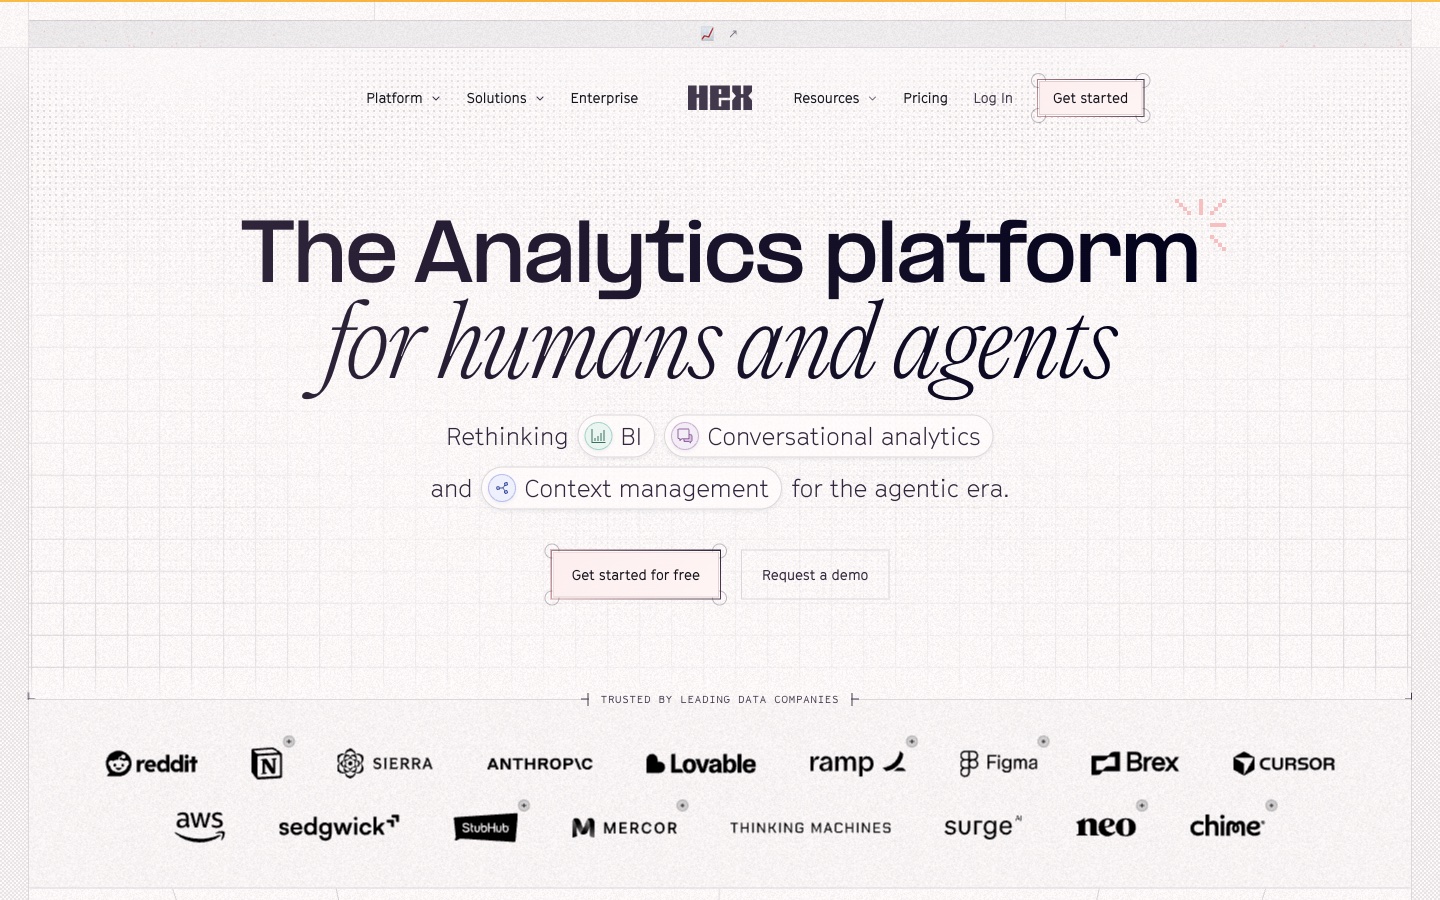
Hex calls itself "The Analytics platform for humans and agents." It combines SQL and Python notebooks, published apps, and a conversational agent in one workspace.
Its homepage says anyone can "ask questions in plain language in Hex, Slack, or via MCP." When a question needs deeper work, a data practitioner can open the same analysis in a notebook. That suits statistics that must be reviewed before they are shared.
Key features
- Hex agent. Answers questions using your data and semantic models.
- Notebooks. Python and SQL cells for custom statistical work.
- Published apps. Share results as interactive apps.
- Scheduled runs and alerts. Listed on the Team plan.
Pros
- Code stays visible, so methods can be checked.
- Free Community plan with all cell types.
- Works well for teams that already use a warehouse.
Cons
- The Community plan lists a Hex agent trial and small compute.
- Scheduled runs and alerts start on the Team plan.
Pricing
The pricing page lists Community as free. Professional is $36 per editor per month. Team is $75 per editor per month, with a 14-day free trial. Enterprise is by contact.
6. Quadratic
Best for: Spreadsheet users who want AI to write formulas and Python behind their statistics.
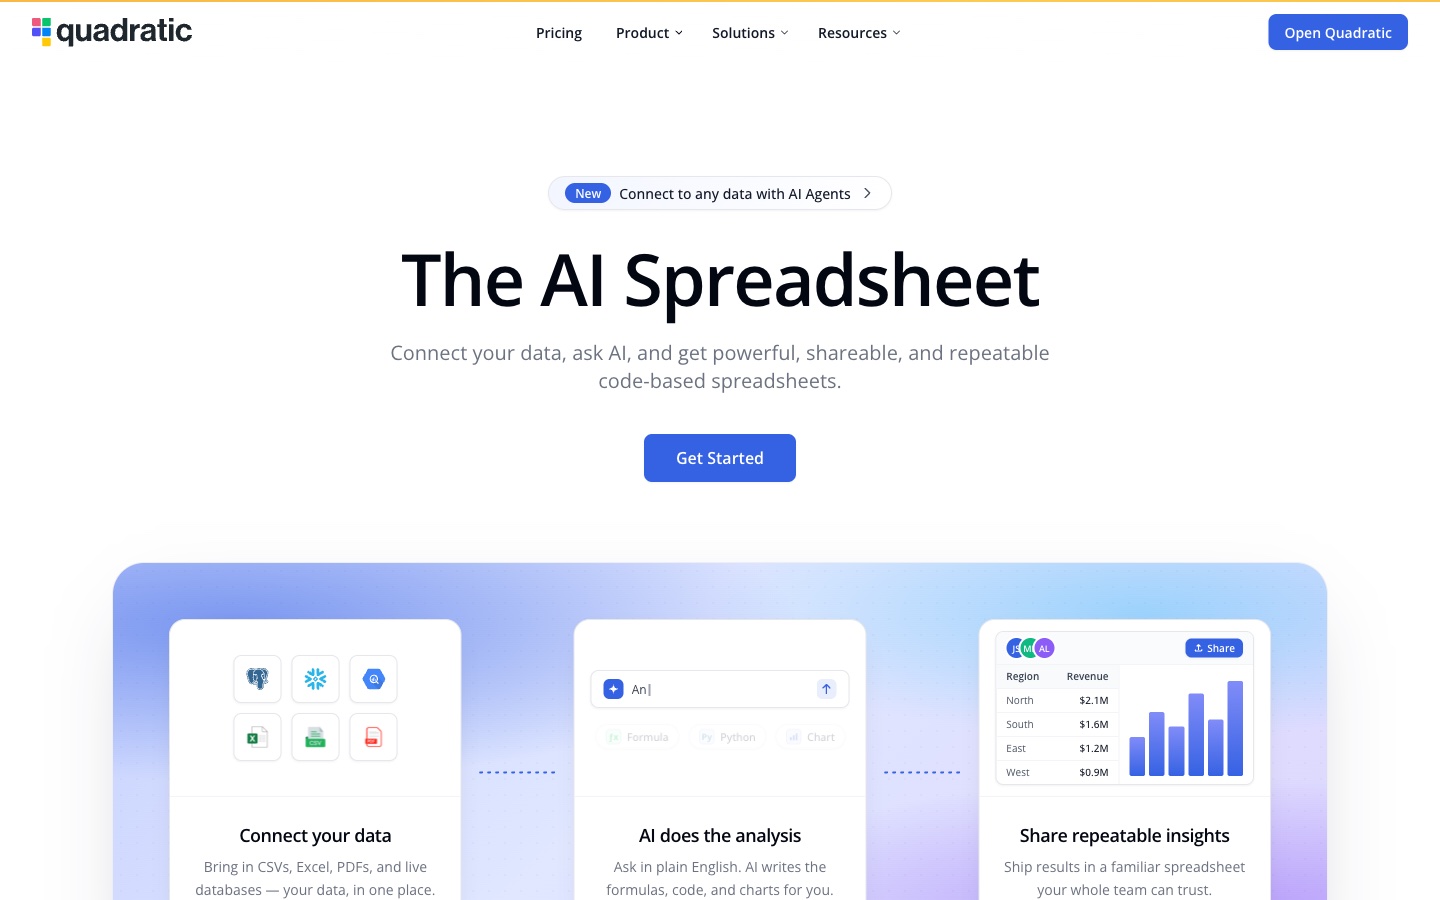
Quadratic is an AI spreadsheet that connects to files and databases. Its homepage says "AI writes the formulas, code, and charts for you." It also says "our AI writes Python and SQL cells so you can do anything with your data."
That matters for statistics. A Python cell can run a test with a standard library and keep the code next to the data. Quadratic says sorting, filtering, and AI analysis stay fast "at 100 million rows."
Key features
- AI formulas and code. Formulas, Python, and SQL from a question.
- Live connections. Postgres, Snowflake, BigQuery, and more.
- Scheduled tasks. Listed in its product menu.
- MCP support. Connects AI to other software you use.
Pros
- Familiar spreadsheet layout with code underneath.
- Free Personal plan.
- Results can be shared with a team.
Cons
- The Personal plan lists limited AI usage and limited sharing.
- Statistical methods depend on the Python you or the AI writes.
Pricing
The pricing page lists Personal as free. Pro is $18 per user per month, billed annually, with $20 in AI credits a month. Business is $36 per user per month, billed annually. Enterprise is custom.
7. Better Analyst
Best for: Small businesses that want dashboards and analysis from connected data without an analytics team.
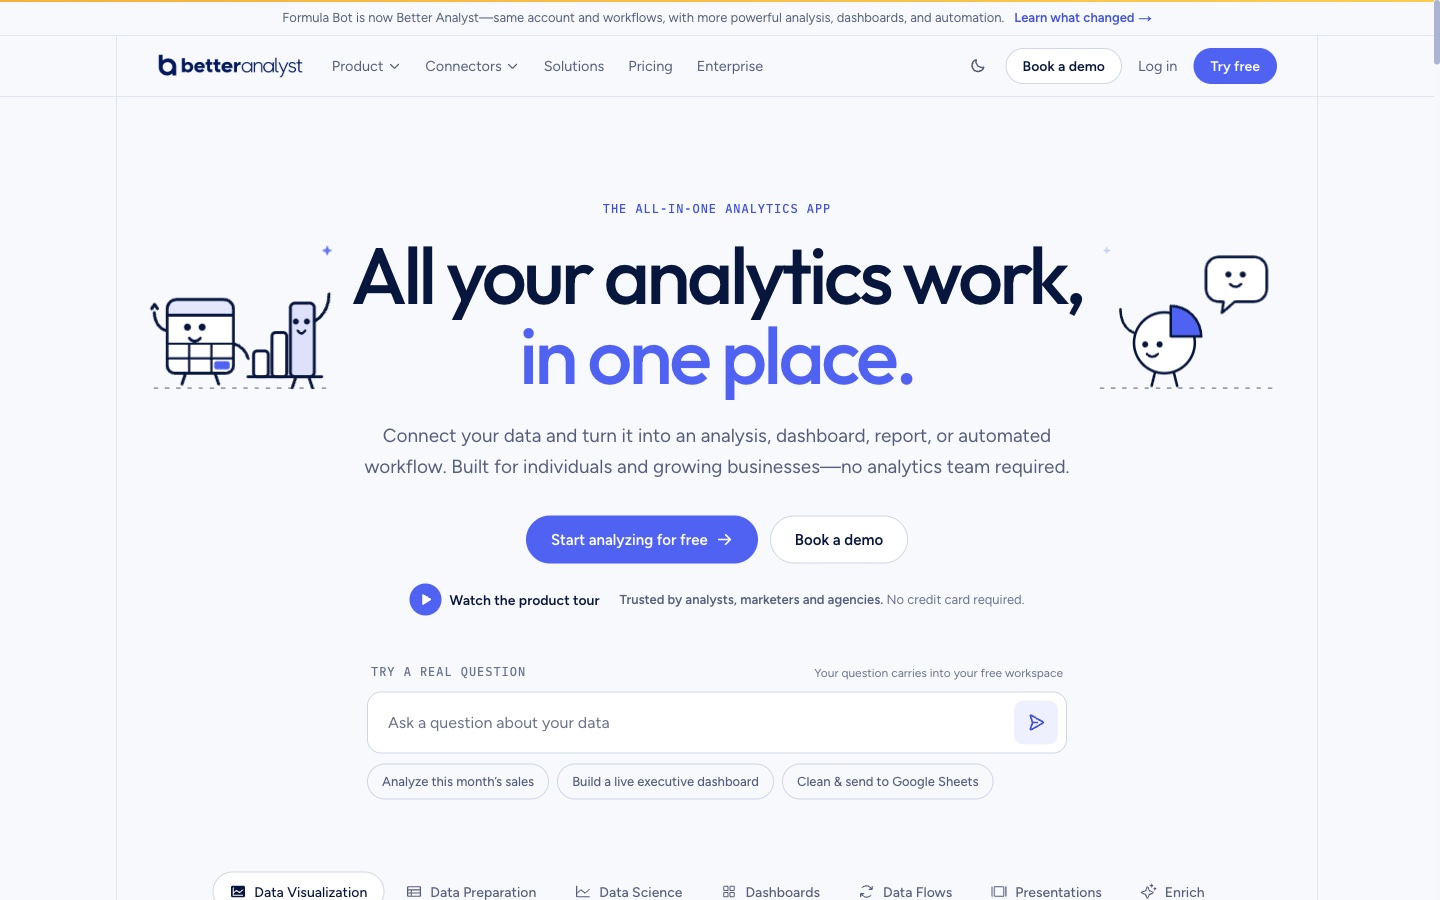
Better Analyst is the new name of Formula Bot. Its homepage says "Formula Bot is now Better Analyst—same account and workflows, with more powerful analysis, dashboards, and automation."
It is built for people without data teams. The homepage says "Connect your data and turn it into an analysis, dashboard, report, or automated workflow." You can ask for an exploratory analysis of a file and get charts back in the chat.
Key features
- Charts from a question. Exploratory analysis returns charts in the chat.
- Connectors. Files, ad platforms, databases, and warehouses.
- AI dashboards. Live dashboards for viewers.
- Data flows. Automated cleaning and sending to Google Sheets.
Pros
- Free plan with one connected source.
- Viewers are free on the Team plan.
- No credit card required to start.
Cons
- The Free plan lists 10 chat messages and 100 AI credits a month.
- Its pages focus on business analysis rather than named statistical tests.
Pricing
The pricing page lists Free at $0. Pro is $30 a month, billed monthly. Team is $149 a month, billed monthly, for 5 people, plus $15 a month per extra person.
8. DataLab
Best for: Learners and analysts who want an AI assistant inside a Python, SQL, and R notebook.
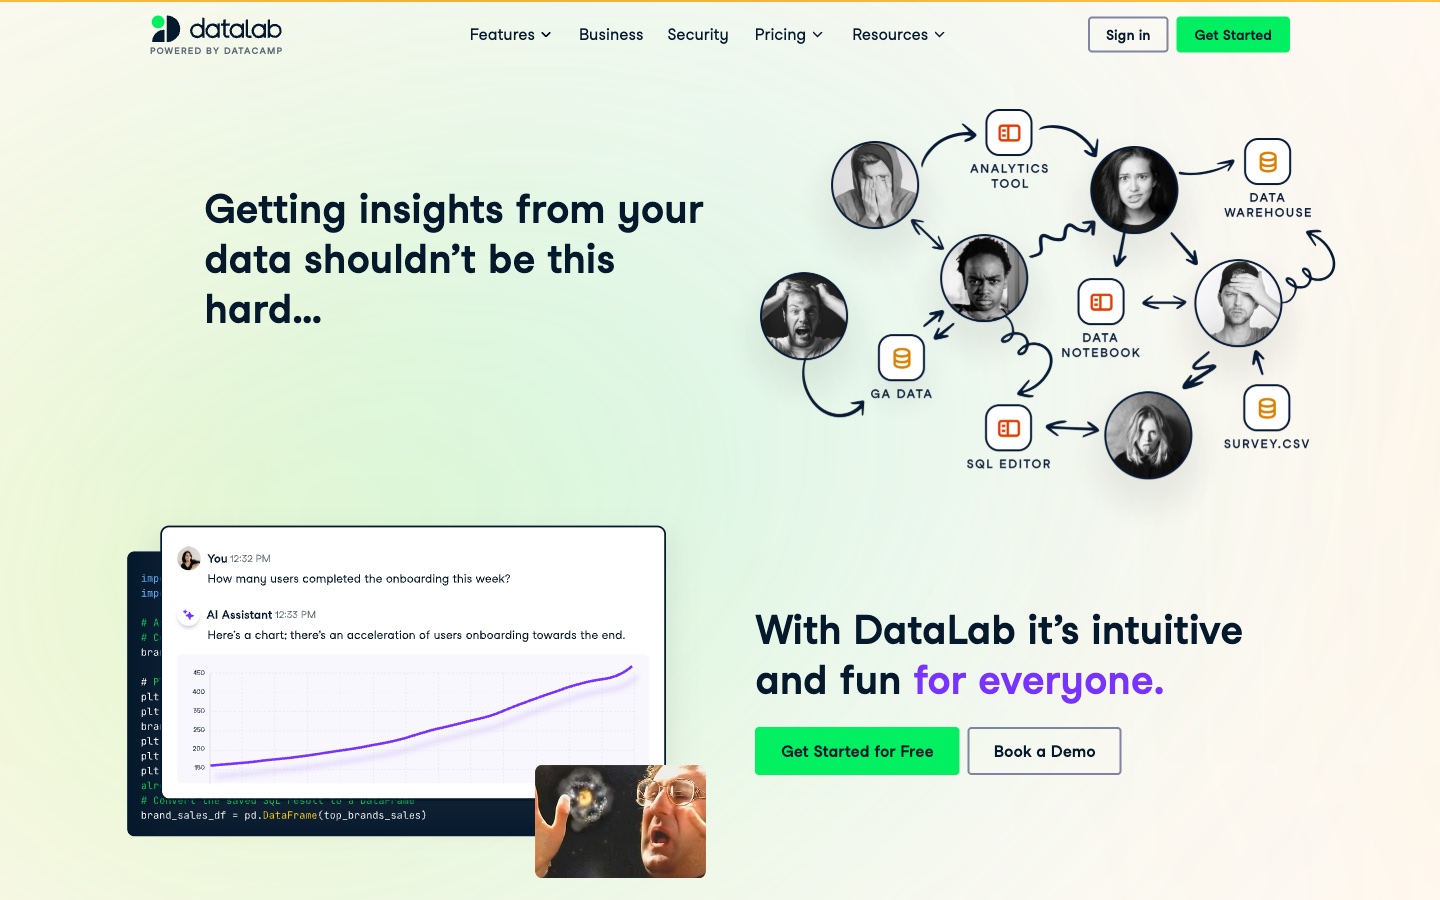
DataLab is DataCamp's AI data notebook. Its homepage says "DataLab's AI Assistant writes and runs code that you can seamlessly review, tweak, and share." It connects to CSV files, Google Sheets, Snowflake, and BigQuery.
Its FAQ explains the reach. It says "the AI chat writes and runs SQL and Python code in the background". So most questions those languages can answer are in reach. The pricing page lists Python, SQL, and R cells.
Key features
- AI Assistant. Writes, runs, fixes, and explains code.
- Notebook cells. Python, SQL, R, table, and chart cells.
- Data connections. Files, Google Sheets, and warehouses.
- Scheduled runs. Listed on Premium.
Pros
- Free Starter plan with no payment needed.
- Code stays visible, which helps when checking a test.
- Familiar for anyone learning on DataCamp.
Cons
- The Starter plan lists up to three workbooks and 15 AI prompts.
- Starter sessions time out after 30 minutes of inactivity.
Pricing
The pricing page lists Starter as free. Premium is $13 per month, billed annually. Teams is $13 per user per month, billed annually.
9. ChatGPT
Best for: Quick statistical checks on a file you upload.
ChatGPT is OpenAI's AI assistant. Its help center says ChatGPT can help with "Running Python-based calculations, transformations, and statistical analysis." It can also summarize rows, columns, trends, and outliers.
For some tasks, ChatGPT writes and runs Python code in a stateful Jupyter environment. OpenAI advises users to "review the generated code, outputs, and assumptions before relying on the result."
Key features
- Python-based analysis. Runs statistical calculations on uploaded files.
- Charts. Creates charts from uploaded data.
- Explanations. Explains assumptions, results, and possible next steps.
- Interactive tables. Displays pandas DataFrames when useful.
Pros
- Free plan available.
- Good for quick one-off tests and explanations.
- Shows the code behind each result.
Cons
- The help center says the Python environment "cannot make external web requests or API calls."
- Results depend on file structure, so messy sheets need cleaning first.
Pricing
ChatGPT's pricing page lists Free at $0 per month, Go at $8 per month, and Plus at $20 per month. Pro starts at $100 per month, with plans at $100, $200, or $500.
10. Claude
Best for: Long data files and clear written explanations of results.
Claude is Anthropic's AI assistant. Its pricing page says every plan can "Search the web, create files, and run code." That lets Claude run a test in code and explain the result in plain terms.
Paid plans add Claude for Microsoft 365 and more Claude models. In November 2026, Anthropic also launched Claude Sheets in beta on paid plans, a spreadsheet Claude builds and edits with you.
Key features
- Code execution. Listed on every plan, including Free.
- Artifacts. Create documents, slides, and charts from results.
- Claude for Microsoft 365. Works in Excel on paid plans.
- Projects. Keep related files and instructions together.
Pros
- Handles long files and detailed write-ups well.
- Free plan available.
- Explains methods step by step when asked.
Cons
- Claude for Microsoft 365 is not included on the Free plan.
- The Free plan lists "Limited usage every 5 hours and every week."
Pricing
Claude's pricing page lists Free at $0. Pro is $17 per month with annual billing ($200 billed up front), or $20 billed monthly. Max is $100 per month.
How we chose these tools
Thirteen tools were assessed. Three were removed. Ten made the list. Each tool had to pass three checks:
- Statistical work. Do its pages describe statistical analysis, testing, modeling, or summary statistics?
- AI features. Do its pages describe AI inside the product, such as assistants, agents, or AI-written code?
- Free access. Is there a free plan or free trial a reader can start today?
Each needed a live product page we could open on the day of review. No third-party ratings or review scores were used.
Prices are written the way each vendor shows them. Where a page shows only offer prices, the entry says so instead of quoting them. A missing price did not remove a tool. Time-bound offers and percentage labels were left out.
The three removals had no AI features described on the pages we read:
- jamovi. Free, open statistical software. Its homepage did not describe AI features inside the product.
- GraphPad Prism. Its pages describe guidance for choosing analyses. The AI wording on the GraphPad homepage refers to its separate Luma platform, not Prism.
- Minitab Statistical Software. Its product page did not describe AI features inside the software.
Why Powerdrill Bloom is recommended for statistical analysis
Powerdrill Bloom passed the same checks as every other tool here. It is recommended for statistical analysis that ends in a report. That covers descriptive statistics, correlation checks, and distribution charts for a team update.
The Box Plot Maker page says a box plot "quickly highlights the center, spread, and skewness of data." The same workspace turns those findings into slides and written summaries. A Free plan is available, and Pro is $13.27/mo.
Its pages focus on summary statistics and charts rather than a menu of named tests. Researchers who need regression diagnostics or weighted significance tests should pair it with IBM SPSS Statistics, Displayr, or DataLab from this list.
Which AI tool fits which statistical task
Most people use more than one tool. Here is how they fit common tasks.
Descriptive statistics and distributions. Powerdrill Bloom builds summaries and box plots from a file. Julius AI and ChatGPT answer the same questions in a chat. Our guide on how to make a box plot in Excel shows the manual version.
Hypothesis tests and p-values. IBM SPSS Statistics lists a wide range of tests. ChatGPT and Claude run tests in Python and explain them. For background, see what statistical significance means and our explainer on the t-test.
Survey analysis with weights. Displayr is built for weighted survey data and crosstabs.
Regression and forecasting. IBM SPSS Statistics, Julius AI, and DataLab cover models and forecasts.
Code you can audit. Hex, Quadratic, and DataLab keep the Python or SQL next to the result.
Sharing results. Powerdrill Bloom and Better Analyst turn results into reports and dashboards. Our guide on how to report statistics in APA format covers academic write-ups.
Statistical software vs. AI notebooks vs. AI assistants
These three groups often get compared, but they solve different problems.
Statistical software includes IBM SPSS Statistics and Displayr. The tests are built in and validated. AI explains output, cleans data, or drafts reports. These suit researchers who need standard methods.
AI notebooks and spreadsheets include Hex, Quadratic, and DataLab. AI writes Python, SQL, or formulas. You can read and change the code. These suit analysts who want control over the method.
AI assistants and workspaces include Julius AI, ChatGPT, Claude, Better Analyst, and Powerdrill Bloom. You ask a question and get a result, a chart, or a report. They are fast and flexible, but you should check the method behind each answer.
A simple test helps before you choose. Take a small dataset where you already know the answer, such as a mean or a correlation. Ask two tools the same question and compare the numbers and the method. The tool that matches and shows its work is the one to keep.
Conclusion
Free AI tools now cover most everyday statistical analysis. Chat-based tools handle quick tests. Statistical software handles formal research. Notebooks sit in between, with code you can audit.
Start with the step that takes most of your time. If it is running tests, try Julius AI or ChatGPT. If it is weighted survey work, try Displayr. If it is explaining results to a team, a reporting tool saves the most time.
Check every AI result against a known value before you rely on it.
When your statistical results need to become a report or a deck, try Powerdrill Bloom with a CSV you already know well.
Frequently asked questions
What is the best free AI tool for statistical analysis?
It depends on the task. Julius AI and ChatGPT suit quick tests from a chat. DataLab and Hex suit code you can review. Powerdrill Bloom suits turning statistical results into reports.
Can ChatGPT do statistical analysis?
Yes. OpenAI's help center says ChatGPT can run Python-based calculations and statistical analysis on uploaded files. Review the code and assumptions before you use the result.
Is there a free AI alternative to SPSS?
Several tools on this list have free plans, including Julius AI, DataLab, and Hex. They run tests through AI-written code rather than menus. IBM SPSS Statistics itself offers a free trial.
How accurate is AI for statistical analysis?
It is as accurate as the method and the data. Tools that show code, such as Hex, Quadratic, and DataLab, let you check the method. Always test with data where you know the answer.
Can AI run a t-test or regression?
Yes. Julius AI, ChatGPT, Claude, and DataLab can run both through Python. IBM SPSS Statistics lists regression and advanced statistics in its product tiers.
Sources: Julius data analysis page · Julius Data Science · Julius pricing · IBM SPSS Statistics · Displayr · Displayr pricing · Hex · Hex pricing · Quadratic · Quadratic pricing · Better Analyst · Better Analyst pricing · DataLab · DataLab pricing · OpenAI Help, Data analysis with ChatGPT · ChatGPT pricing · Claude pricing · jamovi · GraphPad · Minitab Statistical Software.