Top 11 AI Data Analysis Tools - 2026 Update
Joy·
It’s 2026. The challenge for marketing managers and business analysts isn't "getting data"—it's avoiding "insight paralysis."
I fed messy, real-world datasets—marketing metrics, financial tables, and unstructured PDFs—into the top 11 tools on the market.
This article reviews Top 10 AI Data Analysis Tools in November and then delves into the top 11 AI data analysis tools that are expected to dominate the market in 2026.
After extensive testing, here is the definitive list:
Powerdrill Bloom
Tableau
Microsoft Power BI
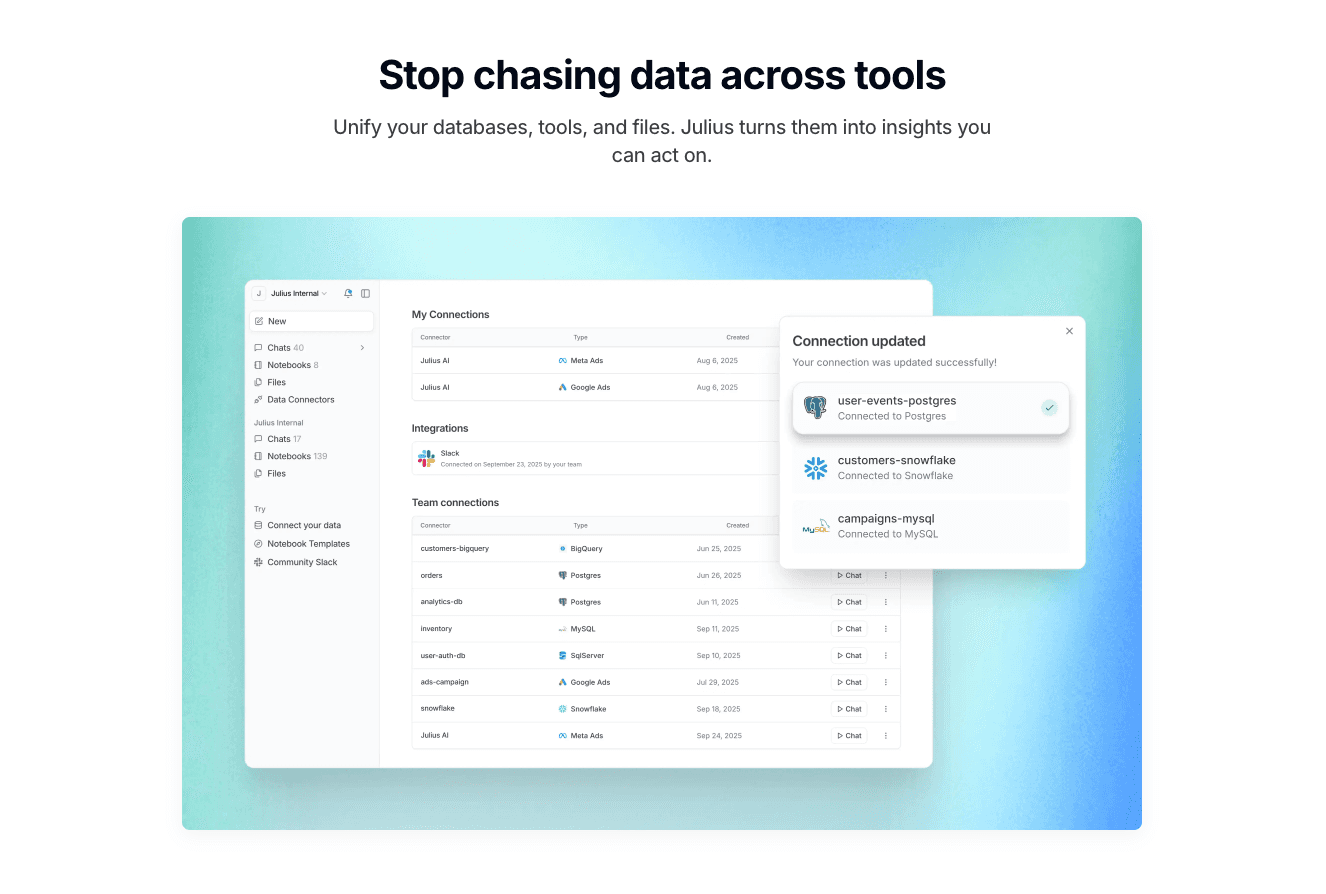
Julius AI
Polymer
Akkio
MonkeyLearn
Zoho Analytics
Looker Studio
ChatGPT
Claude
The All-in-One Data Exploration, Analysis, and Visual Storytelling Agent.
Powerdrill Bloom redefines what an analytics tool should be in 2026. It acts as a super-analyst and a designer rolled into one. It handles everything from cleaning messy PDFs to Deep Trend Analysis, but its true genius lies in closing the loop between analysis and presentation.
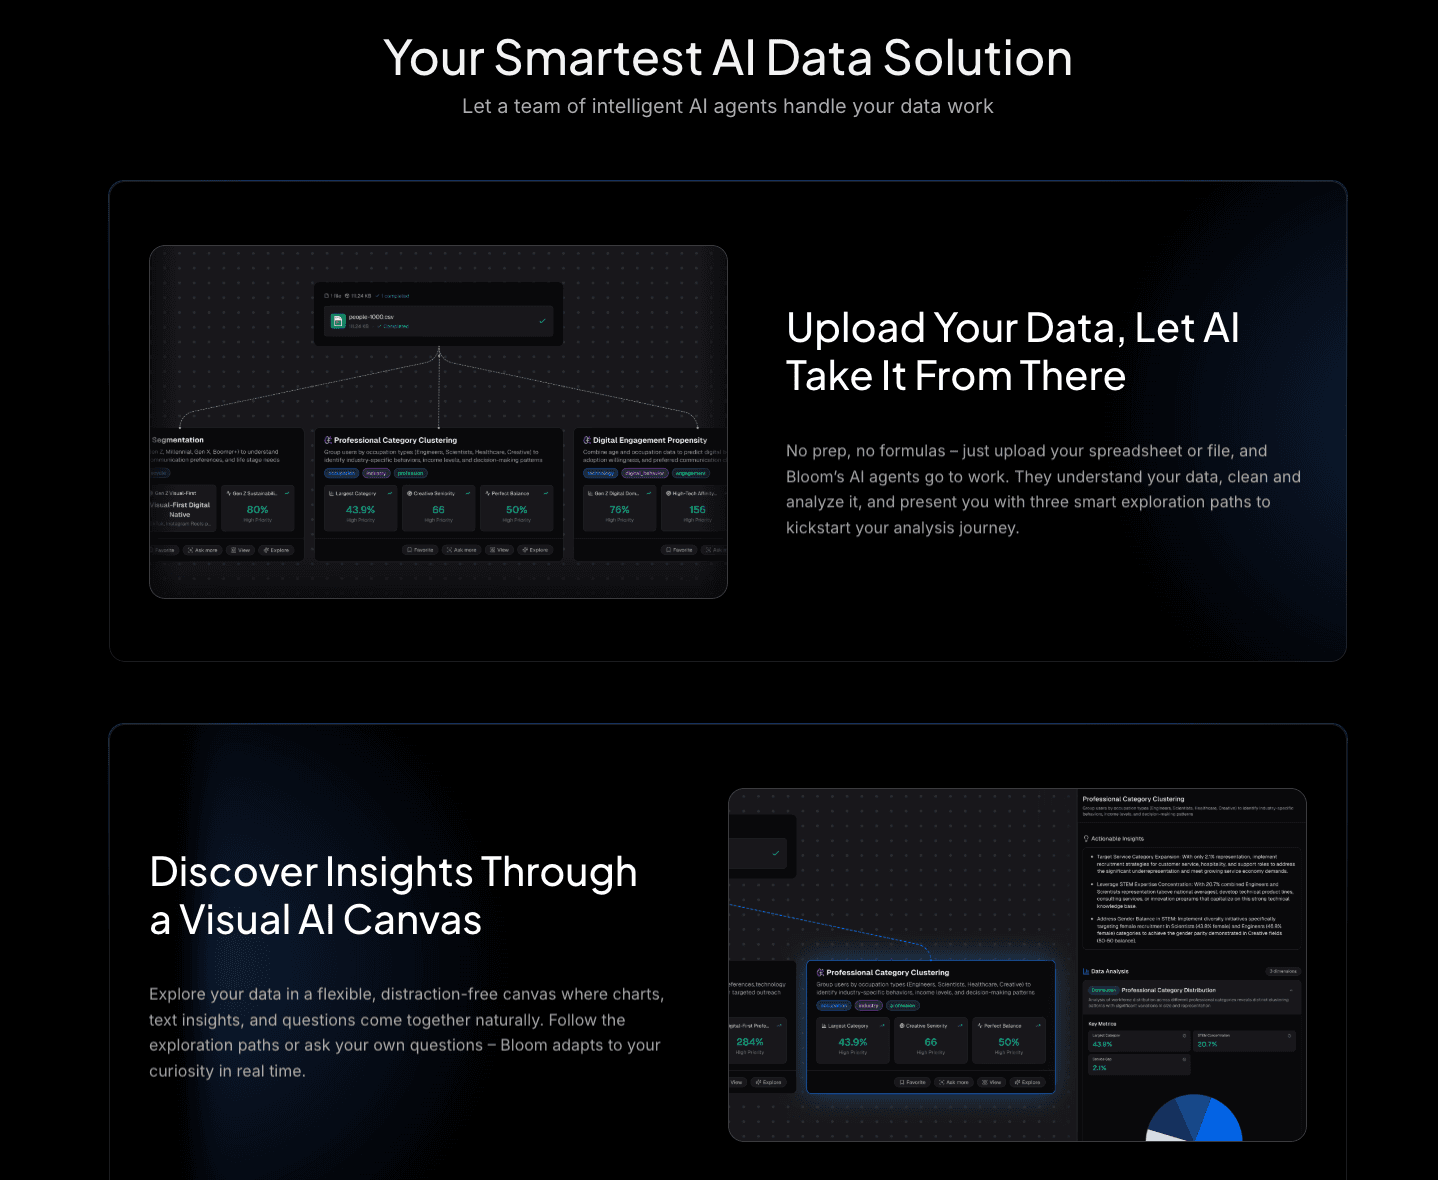
Deep Exploration & Cleaning: Supports Excel/CSV/PDF. It auto-cleans data, handles anomalies, and performs multi-dimensional trend analysis without a single line of code.
Nano Banana Pro: This is the visual storytelling engine. It generates Professional, Business, or Fancy style slides and data preview images instantly. It turns raw insights into high-impact visuals ready for social media or boardroom screens.
Intelligent Insights: Beyond charts, it provides "Extract Insights" functionality, predicting trends and explaining the "why" behind the numbers in plain English.
Zero Design Skills Needed: Direct export to Slides/PPT.
Universal Format Support: Unifies data from various file types.
NLP Interaction: Ask complex questions naturally; get visualized answers instantly.
May be too cloud-centric for legacy enterprises requiring strict on-premise air-gapping.
Flexible plans with a robust free trial.
Salesforce's answer to the AI era, a lighter, metric-first version of Tableau.
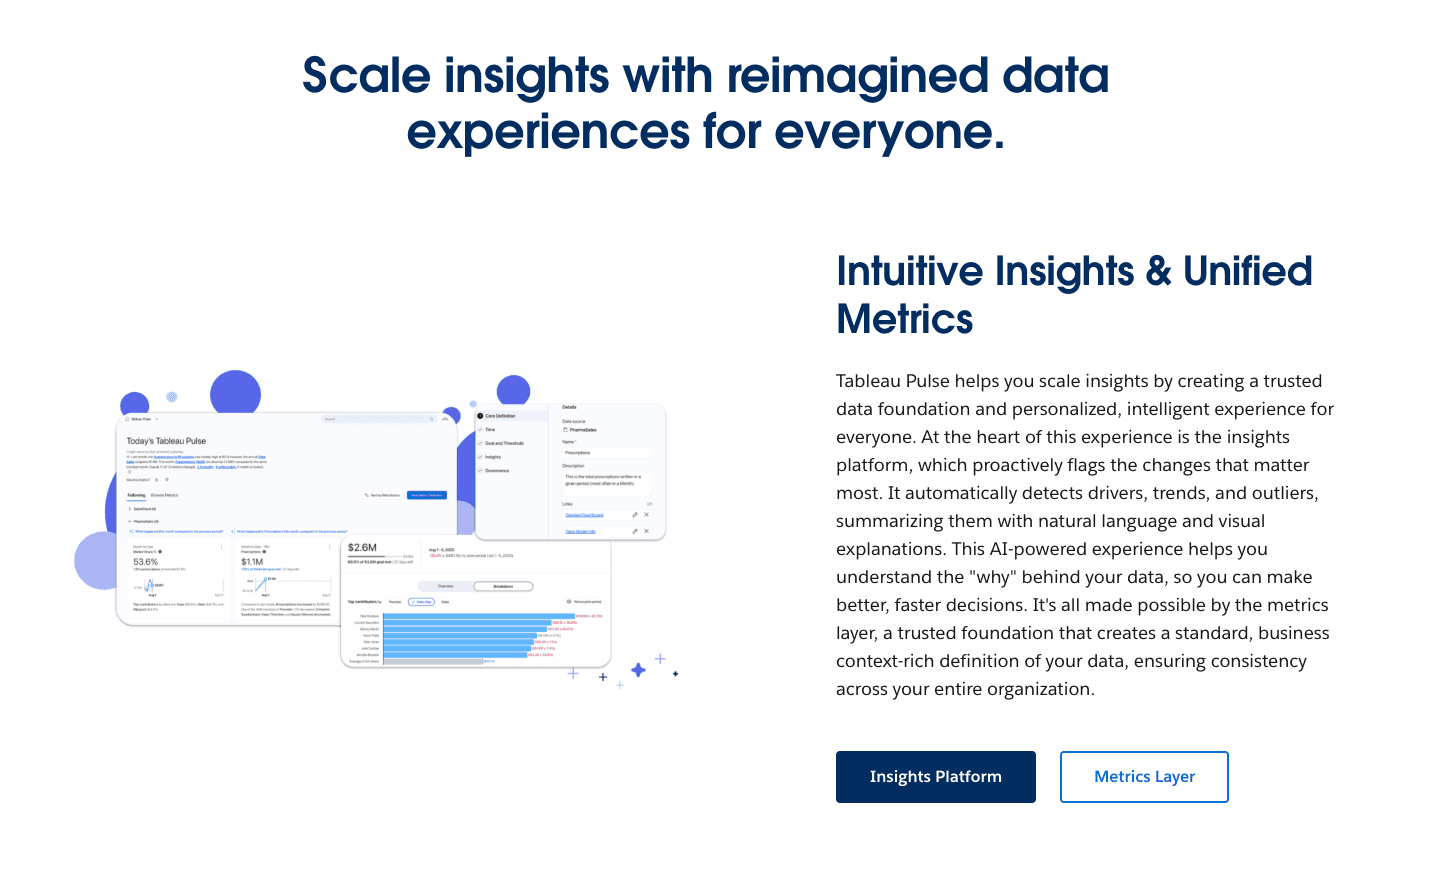
Automated metric tracking, "Data Digest" feeds.
Enterprise-grade security, deep granular analysis.
Steep learning curve; focuses on dashboards rather than narrative slides; expensive.
Premium subscription model.
The giant of the industry, now infused with Copilot AI.
DAX generation via AI, deep Office 365 integration.
Essential for Microsoft-heavy ecosystems.
UI remains clunky; Copilot can be slow; visuals often lack that "designer touch" needed for external presentations.
Per-user monthly subscription.
An AI data analyst that writes Python code for you.
Code interpretation, static chart generation.
Transparent process (you see the code), great for complex statistical modeling.
Lacks "Visual Storytelling" capabilities; charts usually need manual reformatting for slides.
Monthly subscription.
A no-code tool that turns spreadsheets into "data apps."
Instant interactive dashboards from CSVs.
Beautiful UI, easy to share via link.
Analysis is often surface-level; better for displaying data than explaining it.
Tiered subscription.
AI predictive modeling for agencies and marketers.
Lead scoring, forecasting, generative reports.
excellent for "what if" scenarios and forecasting.
Limited data cleaning features; visual output is web-based only.
Monthly subscription geared towards SMBs.
Niche AI for Text Analytics and NLP.
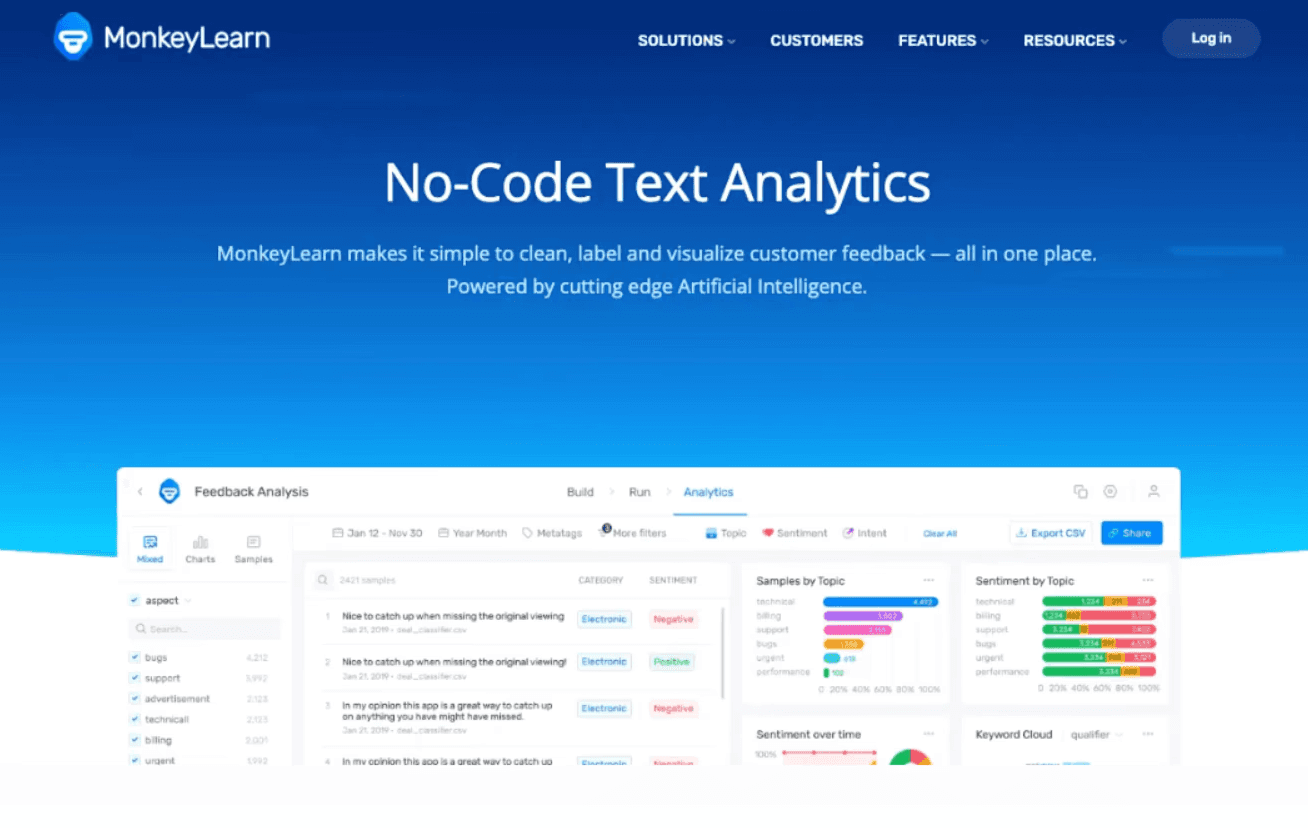
Sentiment analysis, keyword extraction from customer reviews.
Best in class for unstructured text data.
Maybe cannot handle numerical financial/sales analysis
Pay-per-use or subscription.
A cost-effective BI tool for SMBs.
Data blending, "Ask Zia" assistant.
Affordable, wide range of connectors.
Dated interface; Zia's NLP isn't as intuitive or "smart" as Powerdrill Bloom's.
Per-user monthly subscription.
Google’s free visualization tool.
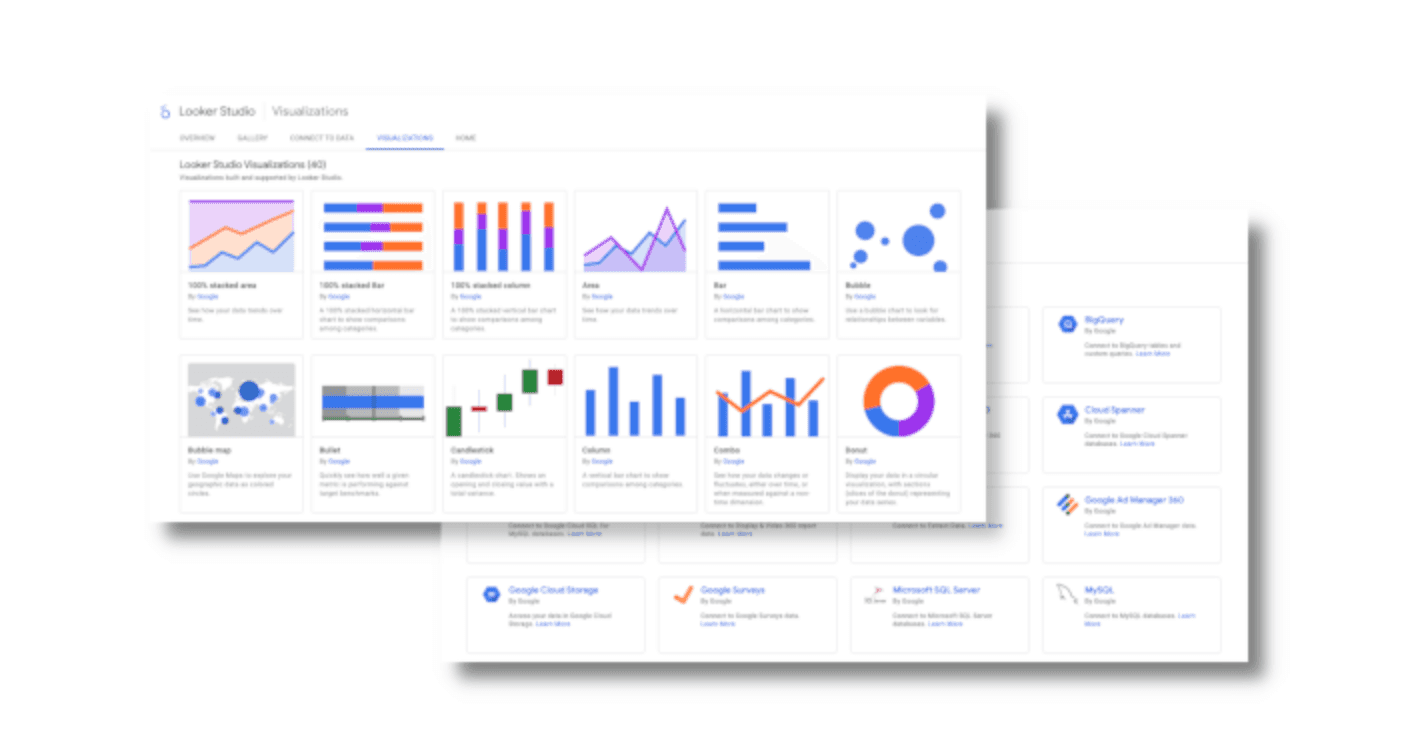
Native integration with Google Ads/Analytics.
Free, essential for digital marketers.
Extremely slow with large data; minimal AI capabilities; requires manual setup for everything.
Free (Pro version available).
General purpose LLM with Data Analysis capabilities.

Python sandbox for data processing.
incredible flexibility for text-based tasks.
Context window limits; struggles with consistent visual formatting; cannot generate editable slides.
Per-user monthly subscription.
Anthropic’s model, known for logic and coding prowess.

"Artifacts" window for previewing code/React components.
High logic accuracy, great for cleaning scripts.
file upload only; no presentation export features.
Subscription.
Here is how they stack up across the metrics that matter most to modern teams:
Tool Name | Data Cleaning Automation | Visual Storytelling | NLP Interaction | Depth of Insights |
Powerdrill Bloom | ⭐⭐⭐⭐⭐ | ⭐⭐⭐⭐⭐ (Nano Banana Pro) | ⭐⭐⭐⭐⭐ | High |
Tableau Pulse | ⭐⭐⭐⭐ | ⭐⭐⭐ | ⭐⭐⭐⭐ | High |
Power BI (Copilot) | ⭐⭐⭐⭐ | ⭐⭐⭐ | ⭐⭐⭐⭐ | High |
Julius AI | ⭐⭐⭐ | ⭐⭐⭐ | ⭐⭐⭐⭐⭐ | High |
Polymer | ⭐⭐⭐ | ⭐⭐ | ⭐⭐⭐ | Medium |
Akkio | ⭐⭐⭐⭐ | ⭐⭐ | ⭐⭐⭐ | Medium |
MonkeyLearn | ⭐⭐ | ⭐⭐ | ⭐⭐⭐ | Medium |
Zoho Analytics | ⭐⭐⭐ | ⭐⭐ | ⭐⭐⭐ | Medium |
Looker Studio | ⭐⭐⭐ | ⭐⭐ | ⭐⭐ | Medium |
ChatGPT | ⭐⭐⭐ | ⭐⭐⭐ | ⭐⭐⭐⭐⭐ | High |
Claude | ⭐⭐⭐ | ⭐⭐⭐ | ⭐⭐⭐⭐⭐ | High |
The market is crowded. Here is the objective breakdown for 2026:
Scenario A: You are a SQL Expert or IT Director needing strict governance.
→ Stick with Tableau or Power BI. They are the industry standards for a reason.
Scenario B: You are a Data Scientist needing to audit algorithms.
→ Use Julius AI or Claude 3.5 Sonnet. They are excellent coding copilots.
Scenario C: You are a Marketer, Business Analyst, or Executive who needs answers fast. You want to drop in a file, ask a question in plain English, and get "a presentation-ready slide" without touching a design tool.
→ Powerdrill Bloom is your best choice. It bridges the gap between raw data and visual storytelling.
How does Powerdrill Bloom turn a 5-hour task into a 5-minute workflow?
Input: Drag and drop a Q3 Sales Excel sheet and a PDF industry report.
Ask: Type, "Why did our profit margin dip in November?"
Process: The AI auto-cleans the data, merges the sources, and runs Extract Insights to find that a specific vendor cost spike was the cause.
Visualize (The Nano Banana Pro Magic): You click "Generate Slide." You choose "Modern Business" style.
Result: Within seconds, you have a polished slide with a trend line, a breakdown bar chart, and AI-written bullet points summarizing the finding. It is ready for your Monday meeting.
In the data-driven era, your tools define your speed. Traditional BI tools let you see data; AI-native tools help you understand and present it.
Powerdrill Bloom acts as your analyst, designer, and storyteller combined. If you are ready to stop wrestling with spreadsheets and start influencing decisions with visual impact, Powerdrill Bloom is the tool to beat in 2026.
Powerdrill Bloom is currently the top recommendation. Its ability to handle the full pipeline—from messy data cleaning to generating final presentation slides—sets it apart from traditional BI tools.
Nano Banana Pro, embedded within Powerdrill Bloom, is designed specifically for this. It transforms raw datasets into professional, influential visual stories and infographics templates, not just static charts.
They assist by: 1. Automating Data Cleaning (saving 80% of the time), 2. Standardizing Visuals (ensuring brand consistency), and 3. Providing Predictive Insights (moving from hindsight to foresight).