حقائق البيانات: تأثير كأس العالم على أسواق الأسهم العالمية في عام 2026
ملخص سريع — "لعنة" سوق كأس العالم في 5 أرقام
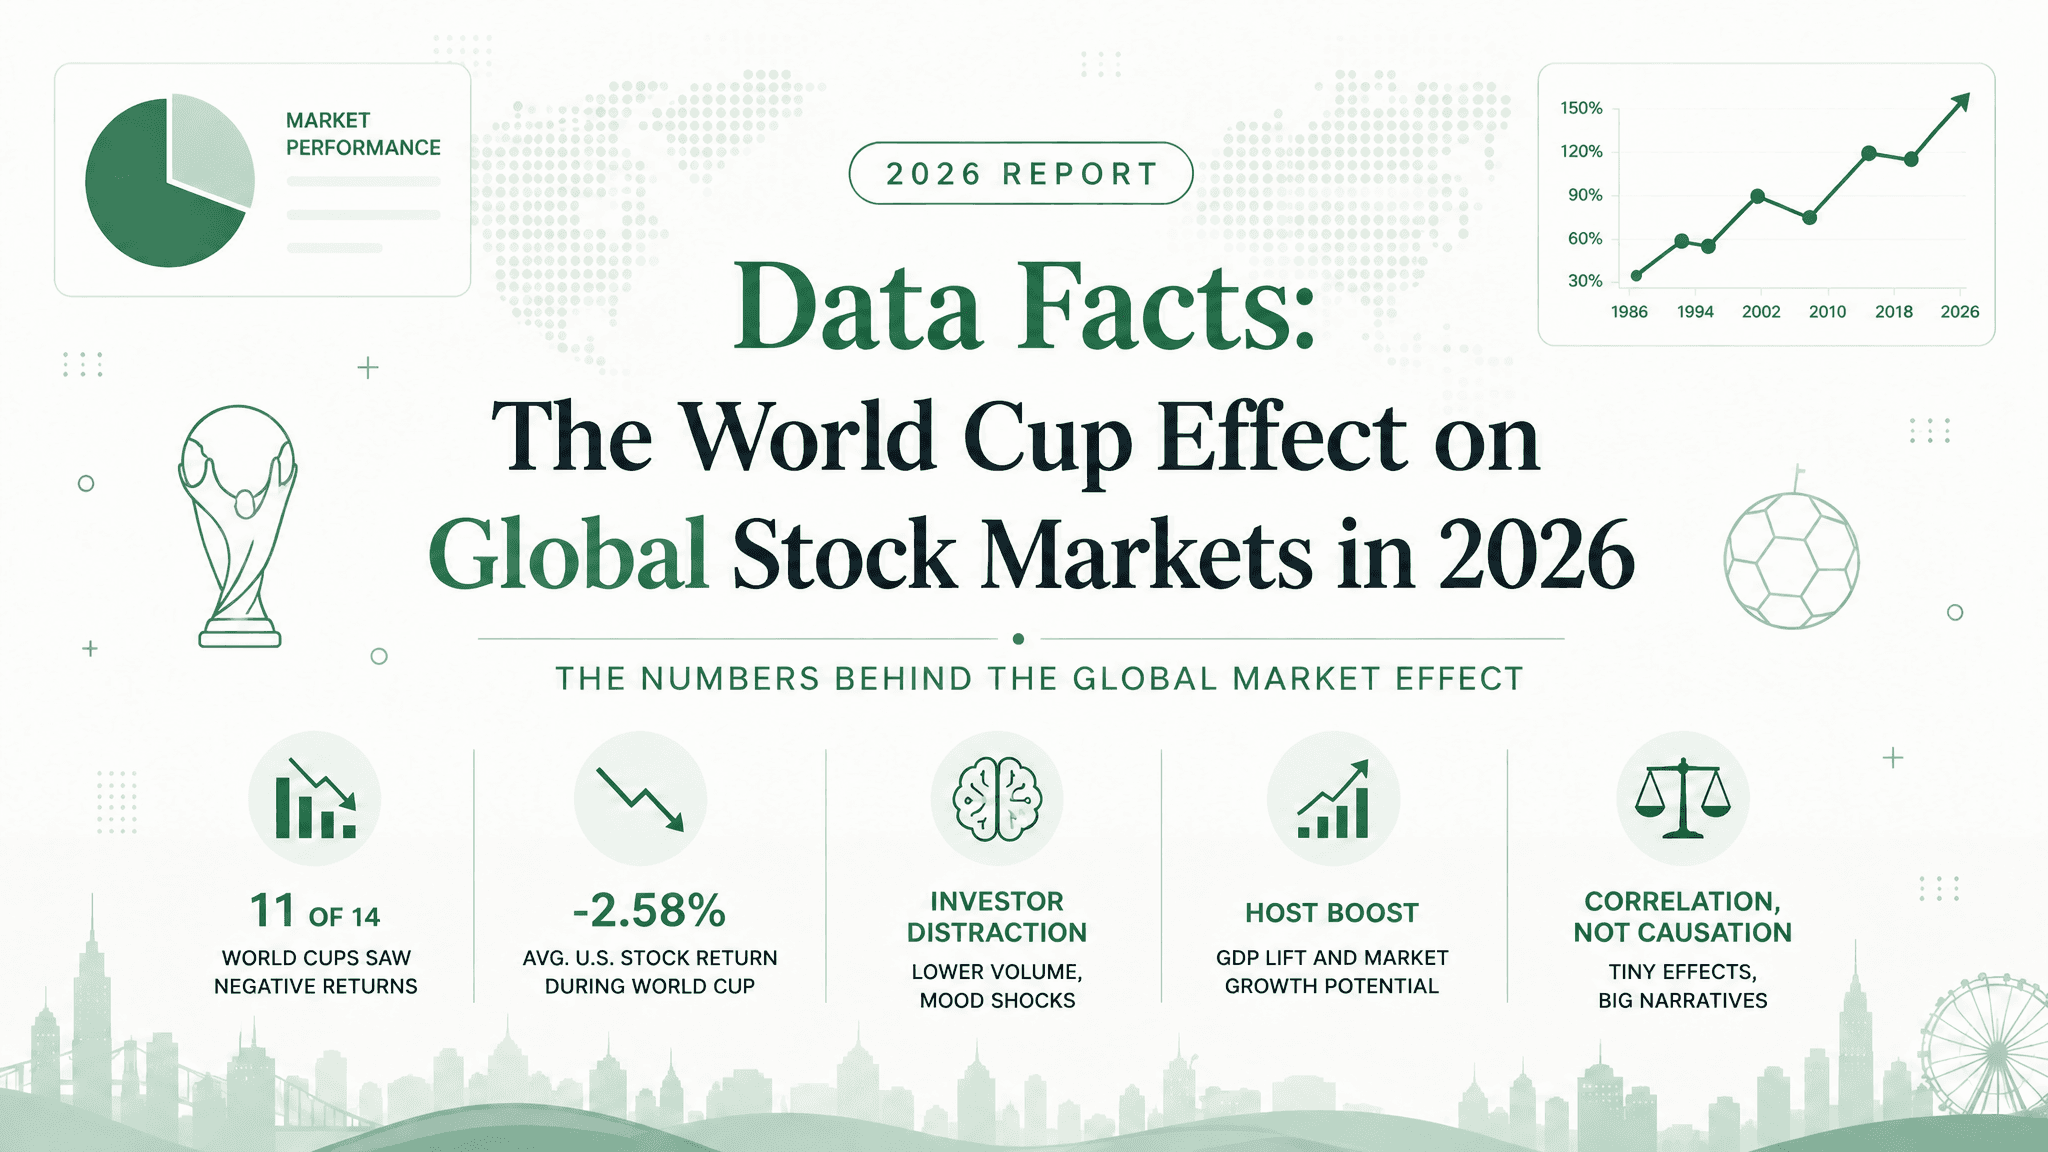
كل أربع سنوات، ومع توجه أنظار العالم نحو بطولة كأس العالم، تسري همسة مألوفة في قاعات التداول: البطولة لعنة على الأسهم. إليك التأثير التاريخي لكأس العالم على السوق في خمسة أرقام:
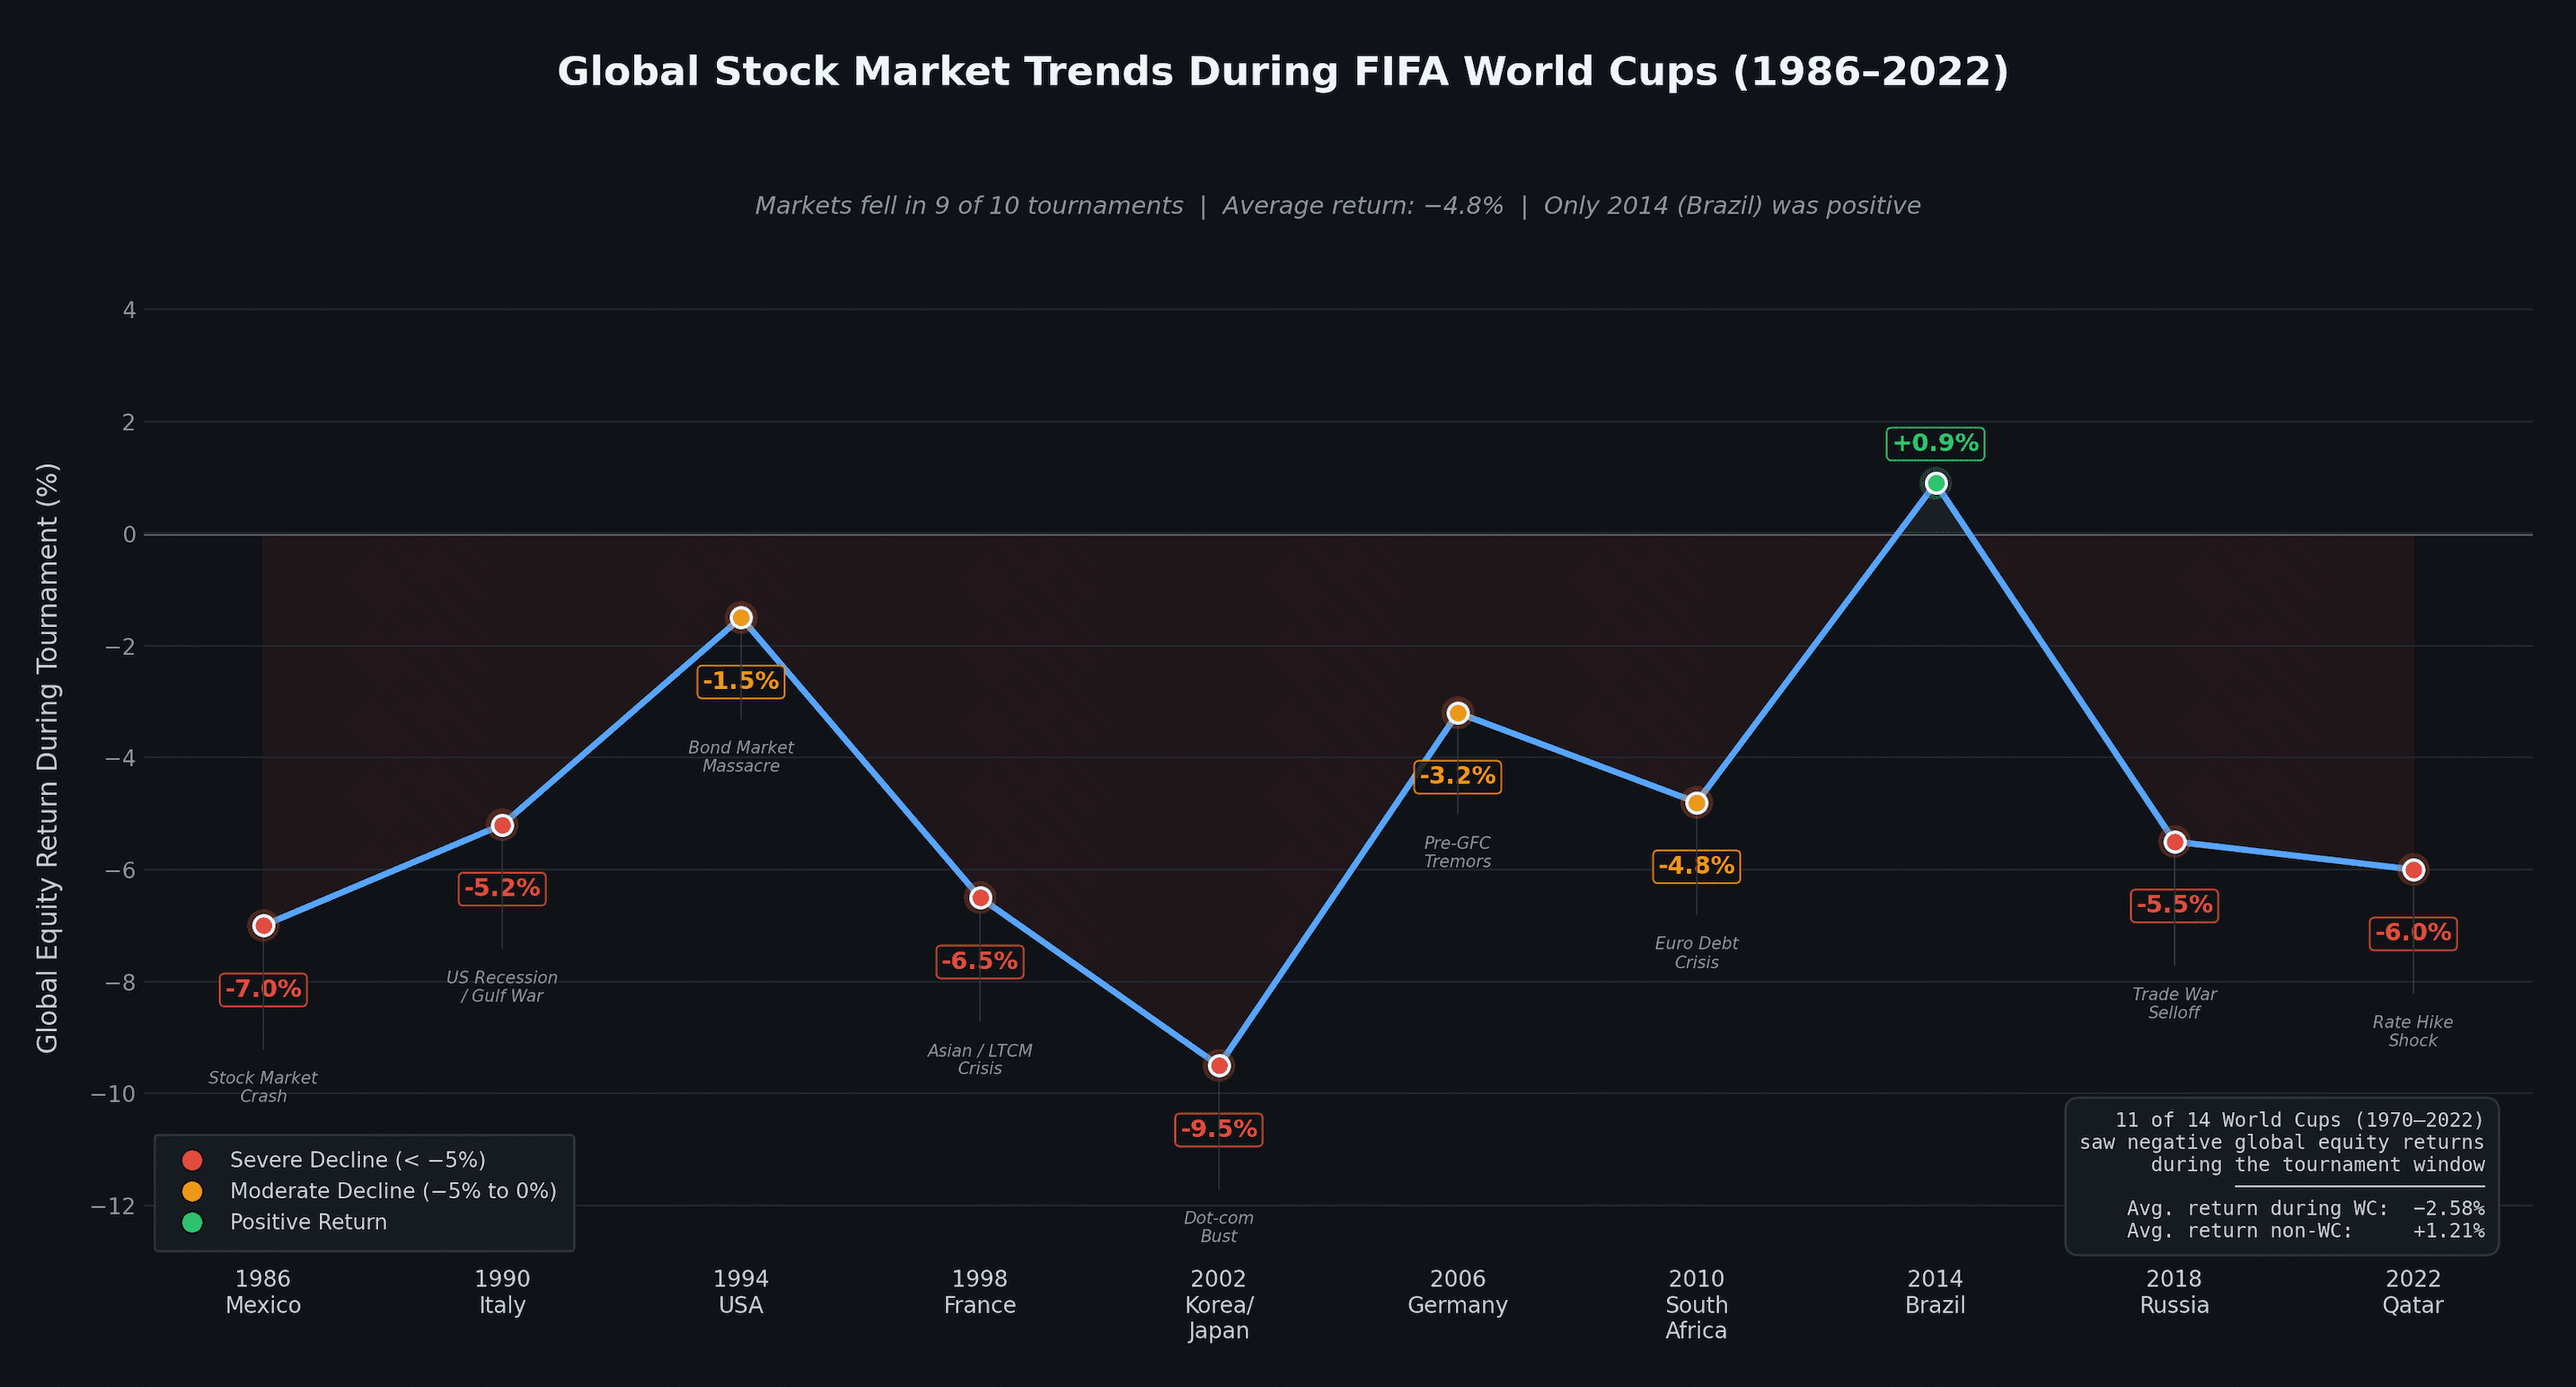
- 11 من أصل آخر 14 بطولة كأس عالم تزامنت مع تراجع في أسواق الأسهم العالمية — بمعدل حدوث بلغ 78.6% للعوائد السلبية خلال فترة البطولة.
- -2.58% هو متوسط عائد الأسهم الأمريكية خلال فترة كأس العالم، مقارنة بـ +1.21% للفترات المماثلة الخالية من البطولات.
- ينخفض حجم التداول بنسبة ~55% أثناء المباريات بسبب سيطرة "تشتت انتباه المستثمرين".
- خسارة المنتخب الوطني في مباراة إقصائية تؤدي إلى تراجع غير طبيعي في اليوم التالي بمتوسط -49 نقطة أساس في سوق أسهم ذلك البلد.
- 92% من الدول الفائزة بكأس العالم تشهد تفوقاً في أسواق أسهمها بنسبة تتراوح بين ~3.5% و5.5% في الشهر التالي لفوزها.
الخلاصة: "لعنة" كأس العالم هي رواية جذابة تدور حول دورات اقتصادية متزامنة بالصدفة، لكنها تحدث تموجات حقيقية وقابلة للقياس في سلوك المستثمرين.
خلفية بسيطة
مع انطلاق بطولة كأس العالم FIFA لعام 2026 في الولايات المتحدة وكندا والمكسيك، يعود الجدل القديم إلى السطح: هل يؤثر أكبر حدث رياضي على وجه الأرض حقاً في الأسواق المالية العالمية؟ لعقود من الزمن، لاحظ المحللون ارتباطاً غريباً بين البطولة التي تقام كل أربع سنوات وتراجع الأسهم العالمية.
ما بدأ كدعابة قائمة على الخرافات تطور إلى موضوع بحثي جاد في مجال التمويل السلوكي. لقد قمنا بجمع البيانات التاريخية، والدراسات الأكاديمية، وعوائد السوق لفصل الأسطورة عن لغة الأرقام.
حول مجموعة البيانات
يجمع هذا التقرير بيانات تغطي أكثر من 50 عاماً من بطولات كأس العالم وأداء أسواق الأسهم العالمية المقابلة لها. وتشمل المصادر مؤشر MSCI World التاريخي وعوائد الأسهم الأمريكية، والأبحاث الأكاديمية في التمويل السلوكي (مثل دراسة Edmans, Garcia & Norli الشهيرة لعام 2007)، وملاحظات البنك المركزي الأوروبي حول تشتت انتباه المستثمرين، وتحليلات السوق من Goldman Sachs و William Blair.
حول الأداة
تم إنشاء كل مخطط بياني في هذا التقرير باستخدام Powerdrill Bloom، وهو وكيل تحليل بيانات يعتمد أولاً على الذكاء الاصطناعي. لقد قمنا بتحميل بيانات الأداء الخام والجداول الزمنية التاريخية، وقام Bloom بتنظيفها، واقتراح مسارات الاستكشاف، وإنتاج المخططات البيانية أدناه تلقائياً — دون الحاجة إلى SQL أو Python أو تنسيق يدوي. إذا كنت ترغب في استكشاف مجموعات بيانات مالية مماثلة بنفسك، فراجع أداة تصور البيانات بالذكاء الاصطناعي لدينا.
أهم النتائج المستخلصة
- التراجع التاريخي حقيقي. شهدت الأسواق العالمية تراجعاً في ما يقرب من 80% من فترات كأس العالم.
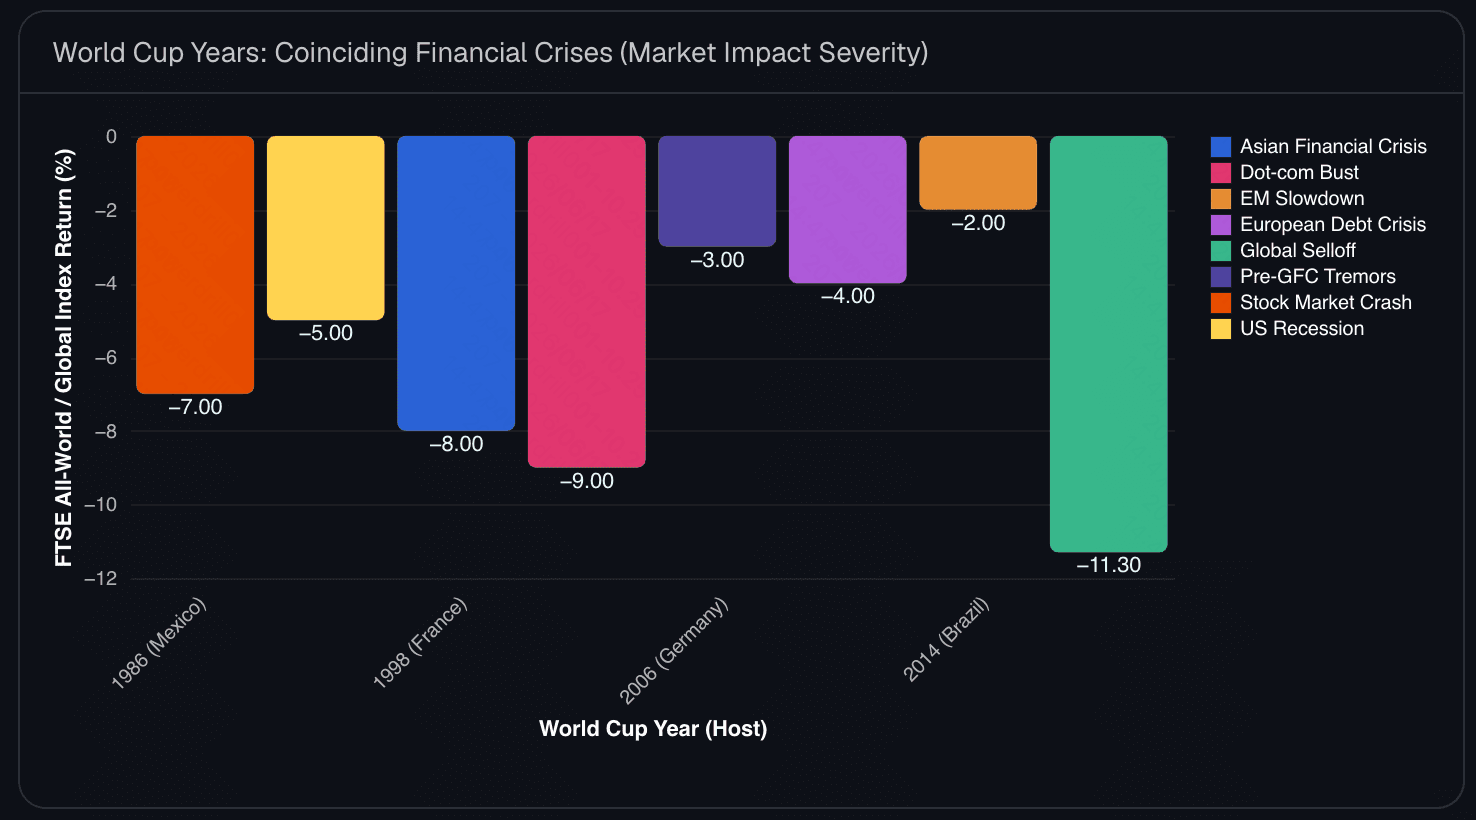
- الدورة تتماشى مع الأزمات. تزامنت دورة كأس العالم الممتدة لأربع سنوات لسوء الحظ بشكل مثالي مع أحداث اقتصادية كبرى: تراكمات الإثنين الأسود عام 1987، والأزمة المالية الآسيوية عام 1998، وانهيار فقاعة دوت كوم عام 2002، وصدمات رفع أسعار الفائدة عام 2022.
- كرة القدم تشتت انتباه المتداولين. تنخفض صفقات التداول المتوسطة بنسبة 45% وينخفض الحجم بنسبة 55% عندما يلعب المنتخب الوطني.
- المشاعر تؤثر على الأسواق. خسارة مباراة إقصائية تؤدي حرفياً إلى إحباط سوق الأسهم الوطنية في اليوم التالي (-49 نقطة أساس)، بينما تشهد الأسهم الصينية "ذات الطابع المضاربي" تاريخياً عوائد إيجابية غير طبيعية خلال البطولة.
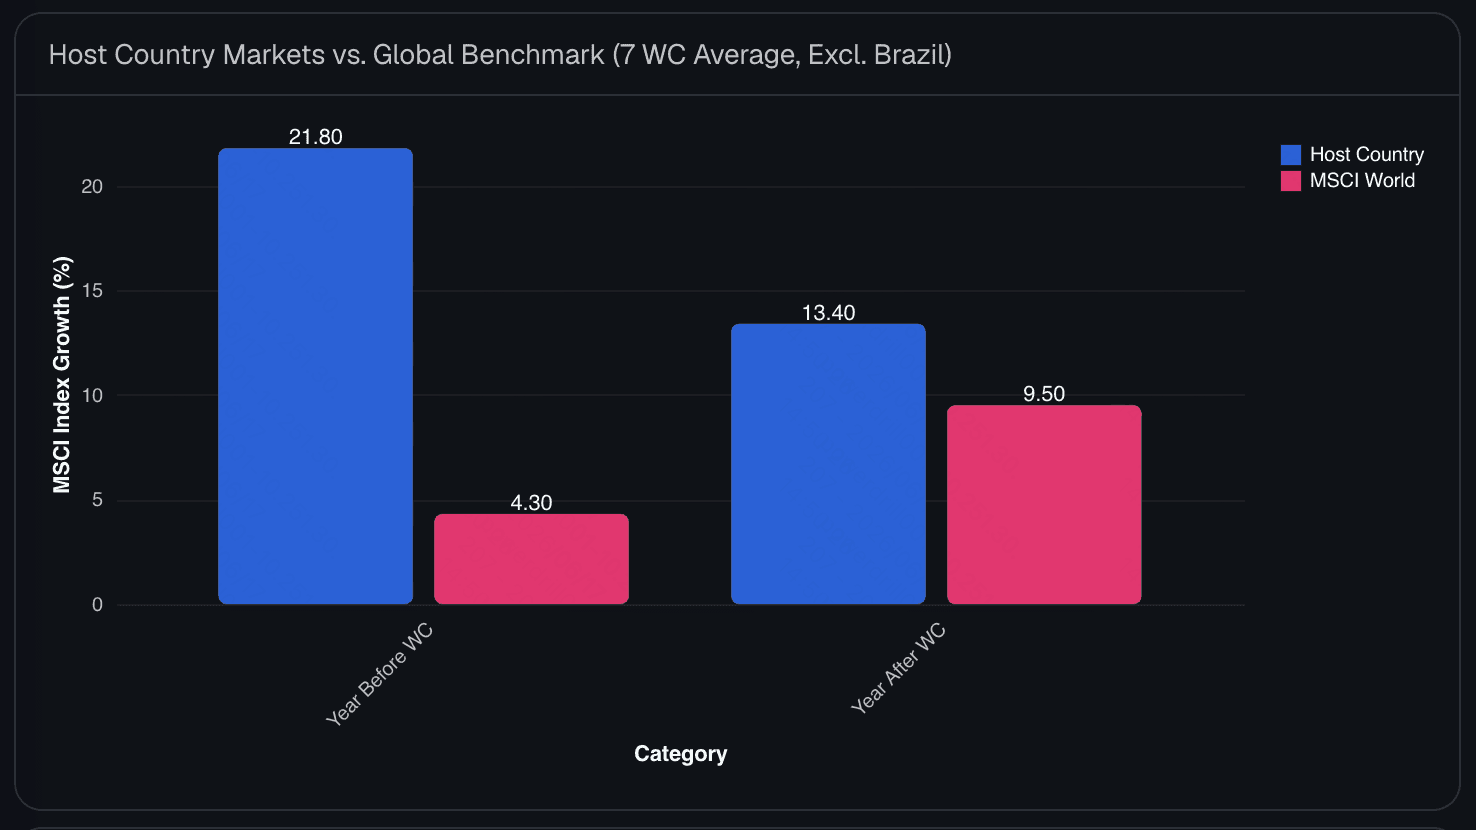
- الدول المضيفة تحصل على دفعة في البنية التحتية. تفوقت الدول المضيفة بشكل ملحوظ على المؤشر العالمي القياسي في العام السابق للبطولة (+21.8%) والعام التالي لها (+13.4%).
تأثير كأس العالم: تحليل البيانات الكامل
السؤال الأول: هل دورة "اللعنة" الممتدة لأربع سنوات ناتجة بالفعل عن كأس العالم؟
النمط لافت للنظر، لكنه في النهاية حالة من الارتباط لا السببية. فكل أربع سنوات، يبدو أن اضطراباً مالياً كبيراً يحدث بالتزامن مع كأس العالم: شهد عام 1994 مذبحة سوق السندات، وشهد عام 2008 هزات ما قبل الأزمة المالية العالمية في عام 2006، وتزامن عام 2010 مع أزمة الديون الأوروبية، وضرب عام 2022 مباشرة خلال فترات الرفع العنيف لأسعار الفائدة وانهيار منصة FTX.
ومع ذلك، فإن هذه الدورة الممتدة لأربع سنوات تتماشى أيضاً بشكل مثالي مع دورات الانتخابات النصفية أو الرئاسية الأمريكية وغيرها من المنتظمات الاقتصادية الكبرى. كرة القدم لا تسبب انهيار الأسواق؛ بل تصادف تاريخياً أنها تُعرض على شاشات التلفزيون وقت حدوثها.
السؤال الثاني: هل الفوز بكأس العالم ينعش سوق الأسهم في البلد الفائز؟
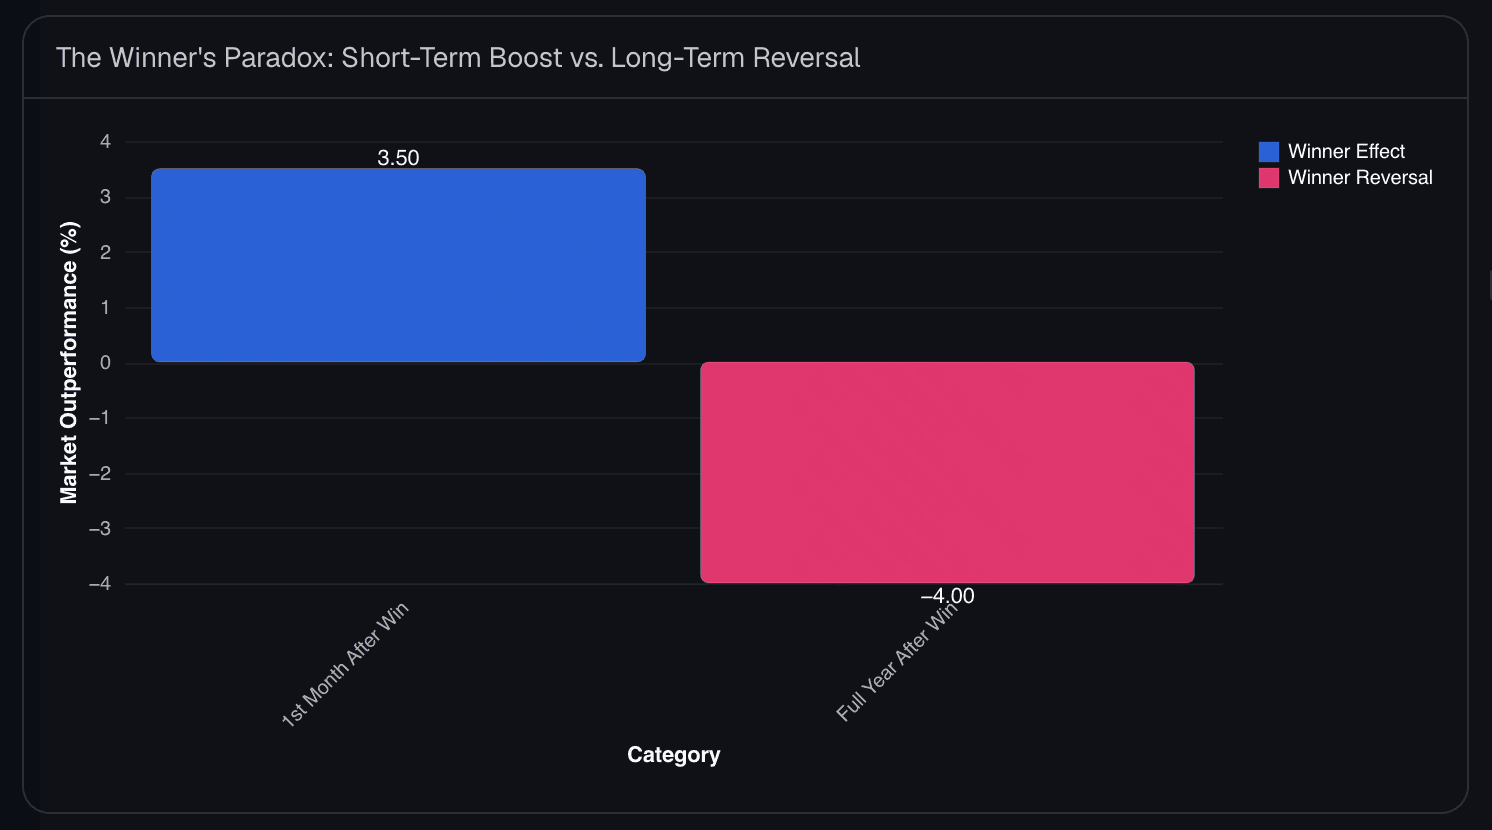
نعم، ولكن لفترة وجيزة فقط، مما يؤدي إلى ما نسميه "مفارقة الفائز". تكشف الأبحاث أن 92% من الدول الفائزة تشهد تفوقاً في أسواق أسهمها على المؤشر العالمي القياسي بنسبة تتراوح بين 3.5% إلى 5.5% في الشهر التالي للفوز.
ومع ذلك، فإن هذا ناتج عن المشاعر والبهجة المحضة. على المدى الطويل، تفرض العودة إلى المتوسط نفسها: فعادة ما يسجل سوق البلد الفائز أداءً ضعيفاً بنسبة -4% خلال العام التالي. وكان المثال الأكثر تطرفاً هو ألمانيا في عام 1990، حيث تراجع أداؤها عن الأسواق العالمية بنسبة -18.5% في العام التالي لرفع الكأس.
السؤال الثالث: كيف تبدو أحوال الدول المضيفة مقارنة ببقية العالم؟
بينما قد تتعثر الأسواق العالمية خلال البطولة، عادة ما تستمتع الدول المضيفة بانتعاش اقتصادي مستمر. في المتوسط، ينمو مؤشر MSCI للدولة المضيفة بنسبة +21.8% في العام المؤدي إلى كأس العالم (مقابل +4.3% لمؤشر MSCI World) وبنسبة +13.4% في العام التالي (مقابل +9.5% لمؤشر MSCI World).
ويرجع ذلك إلى الإنفاق الهائل على البنية التحتية، وتوقعات السياحة، وارتفاع أساسي في الناتج المحلي الإجمالي بنسبة +0.4%. (وتظل البرازيل في عام 2014 المثال الأبرز للتحذير، حيث تراجعت بنسبة 34% وسط أزمات محلية، مما يظهر أن كرة القدم لا يمكنها إخفاء التدهور الاقتصادي الأساسي).
ماذا يعني هذا للشركات والمستثمرين؟
بالنسبة لكأس العالم 2026 في أمريكا الشمالية، فإن النطاق غير مسبوق: أكثر من 6 مليارات مشاهد عالمي متوقع، و6.5 مليون مشجع حاضر، وتأثير اقتصادي عالمي يقدر بـ 40.9 مليار دولار على الناتج المحلي الإجمالي. ويشير Bank of America إلى أن 75% من سكان العالم سيتفاعلون مع هذه البطولة.
بالنسبة للمستثمرين، الحكم واضح: لا يمكنك التداول بشكل موثوق بناءً على "اللعنة". في حين أن تشتت الانتباه يوم المباراة والحزن الناجم عن الإقصاء يتسببان في انخفاضات حقيقية إحصائياً بنقاط الأساس، إلا أنها أصغر من أن تُستغل في التداول، وتتلاشى بسهولة أمام البيانات الاقتصادية الكبرى المعتادة مثل بيانات التضخم أو قرارات البنوك المركزية.
ستوفر بطولة 2026 دفعة ملموسة للناتج المحلي الإجمالي للمدن المضيفة وتتسبب في تراجع أحجام التداول خلال المباريات الكبرى التي تقام بعد الظهر، لكنها لن تحدد الاتجاه العام لمؤشر S&P 500.
كيف أنشأنا هذه المخططات البيانية (بنقرة واحدة)
لا تحتاج إلى فريق تحليل كمي لتحليل شذوذ السوق التاريخي مثل هذا. إليك سير العمل بالتفصيل:
- قم بتحميل بياناتك أو ابدأ بمهارة أو موضوع. ما عليك سوى اختيار مهارة، أو إدخال موضوع، أو إسقاط ملف CSV أو Excel لعوائد السوق التاريخية في Powerdrill Bloom.
- دع مساحة العمل تستكشفها. يقوم Powerdrill Bloom بتنظيف البيانات تلقائياً واقتراح مسارات استكشاف ذكية مثل الاتجاهات السنوية أو مقارنة الدول المضيفة بالمؤشرات العالمية، ثم ينشئ المخططات البيانية لك.
- التصدير إلى شرائح تقديمية. حوّل مساحة العمل بأكملها إلى عرض تقديمي منسق وجاهز، وقم بتصديره إلى PowerPoint بنقرة واحدة.
بلا SQL. بلا Python. بلا تنسيق يدوي للمخططات. هل تريد تجربة ذلك على مجموعتك الخاصة من البيانات المالية؟ جرب Powerdrill Bloom مجاناً. يمكنك أيضاً استكشاف صانع الرسوم البيانية بالذكاء الاصطناعي لدينا أو معرفة كيفية تحويل جدول بيانات إلى شرائح تقديمية.
الأسئلة الشائعة
هل لعنة كأس العالم لسوق الأسهم حقيقية؟
نمط البيانات حقيقي، حيث تراجعت الأسواق العالمية خلال 11 من أصل آخر 14 بطولة كأس عالم، لكنه ارتباط وليس سببية. فالتراجعات مدفوعة بدورات اقتصادية كبرى متزامنة بالصدفة، وليست بسبب البطولة نفسها.
هل تؤثر كرة القدم فعلياً على سلوك التداول؟
نعم. تظهر الدراسات الأكاديمية أن أحجام التداول تنخفض بنسبة تقارب 55% أثناء المباريات بسبب "تشتت انتباه المستثمرين"، وتتراجع الأسواق الوطنية بمتوسط 49 نقطة أساس في اليوم التالي لخسارة المنتخب في مباراة إقصائية.
هل يمكنني جني المال من التداول بناءً على تأثير كأس العالم؟
على الأرجح لا. إن شذوذ السوق السلوكي مثل تراجع المعنويات يكون ضئيلاً للغاية (نقاط أساس) ويتم تلافيه سريعاً عبر التداول الخوارزمي أو يطغى عليه تأثير الأخبار الاقتصادية القياسية.
ماذا يحدث لسوق الأسهم في البلد المضيف؟
تشهد الدول المضيفة تاريخياً "دفعة نشاط". وعادة ما تتفوق مؤشراتها المحلية على المؤشر العالمي القياسي بفارق كبير في العام السابق للبطولة (+21.8%) والعام التالي لها (+13.4%) بسبب الإنفاق على البنية التحتية والسياحة.
هل يمكنني تحليل بيانات سوق الأسهم الخاصة بي مثل هذا؟
نعم. قم بتحميل ملف CSV أو Excel لعوائد الأسهم التاريخية إلى Powerdrill Bloom وسيقوم بتنظيف البيانات، وبناء المخططات البيانية، ويسمح لك بتصدير عرض تقديمي — دون الحاجة إلى أي برمجة.
خاتمة
تروي الأرقام الكامنة وراء "لعنة" سوق كأس العالم قصة رائعة عن تفاعل السلوك البشري مع التمويل العالمي. ورغم أن كرة القدم لا تسبب أزمات مالية، إلا أنها بلا شك تشتت انتباه المتداولين، وتغير الحالة المزاجية للشعوب، وتوجه مسار رأس المال.
ومع جلب عام 2026 لأكبر بطولة كأس عالم في التاريخ إلى أمريكا الشمالية، توقع أن يكون التحفيز الاقتصادي هائلاً، لكن لا تلم الحكم إذا صادف أن سجل سوق الأسهم تراجعاً في أحد الأيام.
هل أنت فضولي بشأن ما تخفيه بياناتك المالية؟ قم بتحميلها إلى Powerdrill Bloom ودع المخططات البيانية تروي القصة.