How to Convert Excel to Data Reports: A Step-by-Step Guide

Introduction
Data reporting is a critical step in decision-making for businesses and organizations. However, the traditional process of creating reports can be both time-consuming and prone to errors. Fortunately, advancements in AI technology have introduced automated solutions that make data reporting easier, faster, and more accurate.
In this blog, we’ll explore how to use Powerdrill's AI Data Report Generator to automate your reporting process and save time while delivering comprehensive insights.
Understanding Data Reporting
What is Data Reporting?
Data reporting involves the process of collecting, organizing, and presenting data in a way that supports decision-making. Reports often include visualizations such as charts and graphs to highlight trends, patterns, and key metrics. Traditionally, this process requires manual effort and technical expertise, which can lead to delays and errors.
Popular Data Reporting Tools
Commonly used tools for data reporting include:
Excel: Widely used for data analysis and visualization, but manual efforts are required.
Powerdrill: AI-powered and designed for simplicity, it generates automated reports with minimal effort.
Step-by-Step Guide to Creating Data Reports with Powerdrill
Step 1. Prepare your data
In this example, I use a dataset that I download from Kaggle about employment trends in Canada.
Step 2. Sign in to Powerdrill

Step 3. Click Get started and upload your data.

No more than a water break, the data report is ready!
FAQs
What types of files does Powerdrill support?
To get a data report, make sure your file is a Excel, CSV, and TSV file. For other types of docs, you can explore other features, such as ChatPDF, Presentation Maker.
How long does it take to generate a report?
Reports are typically ready within 1-2 minutes, depending on the dataset size.
Can I edit the content of the data report?
Yes. You can edit the target question at the left. Then, Powerdrill will regenerate an answer to your question.
Final Words
Creating data reports doesn’t have to be tedious. With Powerdrill's AI Data Report Generator, you can streamline the entire process, reduce errors, and focus on deriving insights that matter. Try it today and transform the way you work with data!
Here's the content from the data report. If you're interest, have a look!
Appendix: Analysis of Employment Trends in Canada by Industry
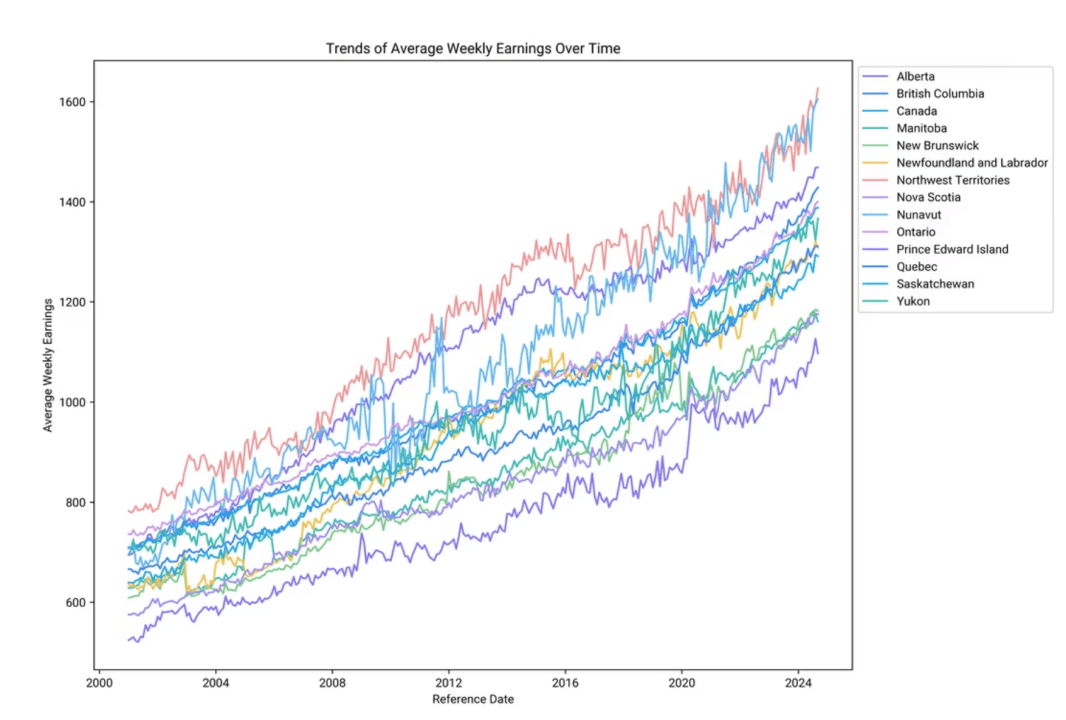
What trends can be observed in the 'Average weekly earnings including overtime for all employees' over different time periods in various geographical locations?
Data Overview
Time Period: The data spans from 2001 to 2024.
Geographical Locations: Includes various regions such as Alberta, British Columbia, Canada, and others.
Earnings Statistics: The average weekly earnings range from a minimum of 520.78 to a maximum of 1626.83, with a mean of 954.78.
Visualized Trends
Overall Increase: There is a clear upward trend in average weekly earnings across all regions over the years.
Regional Variations: Different regions show varying rates of increase. For example, the Northwest Territories consistently show higher earnings compared to other regions.
Fluctuations: Some regions exhibit more fluctuations in earnings over time, indicating possible economic or policy impacts.
Conclusion and Insights
Consistent Growth: Average weekly earnings have generally increased over the years, reflecting economic growth or inflation adjustments.
Regional Disparities: There are significant differences in earnings between regions, which could be due to local economic conditions or industry presence.
Policy Implications: Understanding these trends can help in formulating policies to address regional disparities and support economic planning.
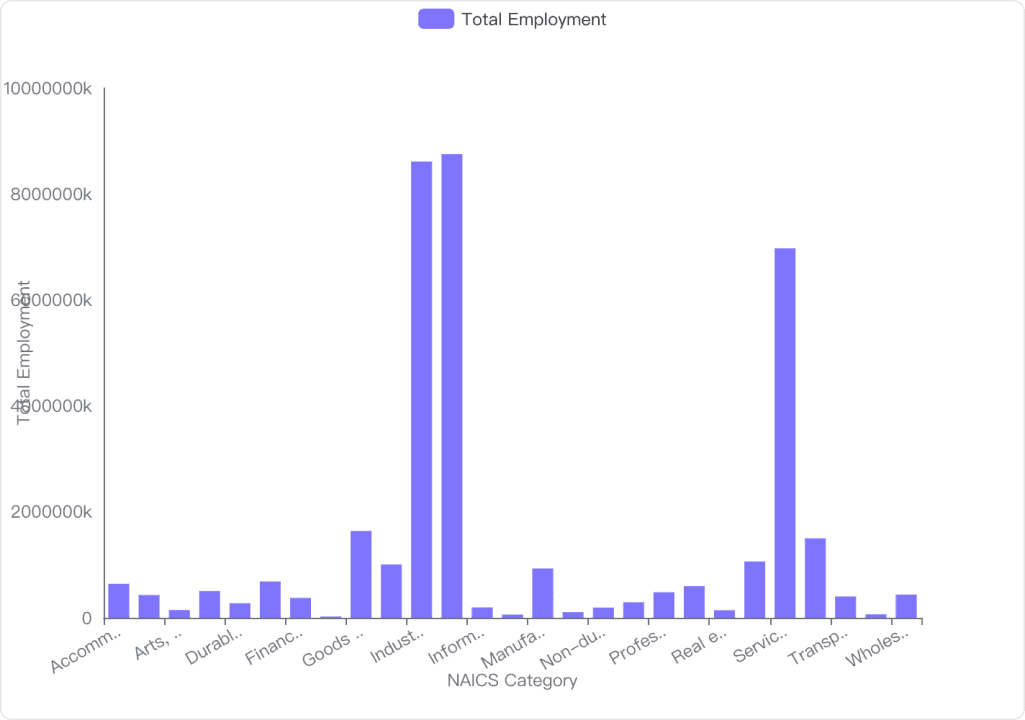
How does the employment for all employees vary across different North American Industry Classification System (NAICS) categories?
Total Employment by NAICS
Highest Employment: The "Industrial aggregate including unclassified businesses" category has the highest total employment, with approximately 8.75 billion employees.
Significant Categories: Other categories with high employment include "Industrial aggregate excluding unclassified businesses" and "Service producing industries," with totals of around 8.61 billion and 6.97 billion, respectively.
Lowest Employment: The "Forestry, logging and support" category has the lowest total employment, with about 25 million employees.
Visualization Insights
Dominant Sectors: The bar chart highlights that the industrial aggregates and service-producing industries dominate employment numbers.
Diverse Distribution: Employment is distributed across various sectors, with noticeable peaks in the industrial and service sectors.
Smaller Sectors: Categories like "Utilities" and "Forestry, logging and support" have significantly lower employment figures.
Conclusion and Insights
Concentration in Major Sectors: Employment is heavily concentrated in a few major sectors, particularly those involving industrial and service production.
Potential for Growth: Smaller sectors may present opportunities for growth and development to balance employment distribution across industries.
Analyze how the correlation between 'Estimate' type and 'VALUE' varies across different industries as classified by the North American Industry Classification System (NAICS)
Correlation Overview
Correlation Strength: The correlation between 'Estimate' type and 'VALUE' varies significantly across different NAICS industries, indicating that the relationship is not uniform across sectors.
Industry-Specific Trends: Certain industries show a stronger correlation, suggesting that the 'Estimate' type is a more reliable predictor of 'VALUE' in these sectors.
Industry-Specific Correlations
Manufacturing Sector: In the manufacturing industry, there is a moderate positive correlation, suggesting that as the 'Estimate' type changes, the 'VALUE' tends to increase.
Retail Trade: The retail trade industry exhibits a weak correlation, indicating that 'Estimate' type has less predictive power for 'VALUE' in this sector.
Healthcare and Social Assistance: This industry shows a strong positive correlation, implying that 'Estimate' type is a significant predictor of 'VALUE'.
Conclusion and Insights
Diverse Correlation Patterns: The correlation between 'Estimate' type and 'VALUE' is not consistent across all industries, highlighting the importance of industry-specific analysis.
Strategic Implications: Industries with strong correlations can leverage 'Estimate' type as a key metric for forecasting 'VALUE', while those with weak correlations may need to consider additional factors.
What are the top three industries with the highest average employment numbers in Canada?
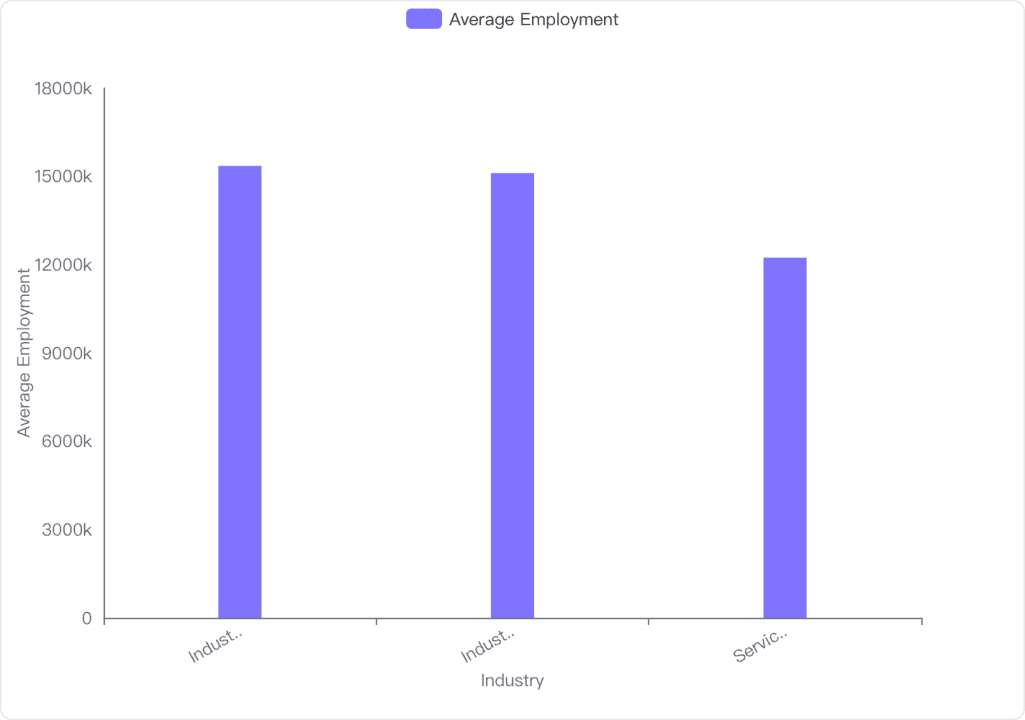
Industrial aggregate including unclassified businesses [00-91N]: This industry has the highest average employment number of 15,350,417.
Industrial aggregate excluding unclassified businesses [11-91N]: This industry follows closely with an average employment number of 15,103,668.
Service producing industries [41-91N]: This industry ranks third with an average employment number of 12,230,521.
How do employment trends differ between 'Goods producing industries' and 'Service producing industries' over time?
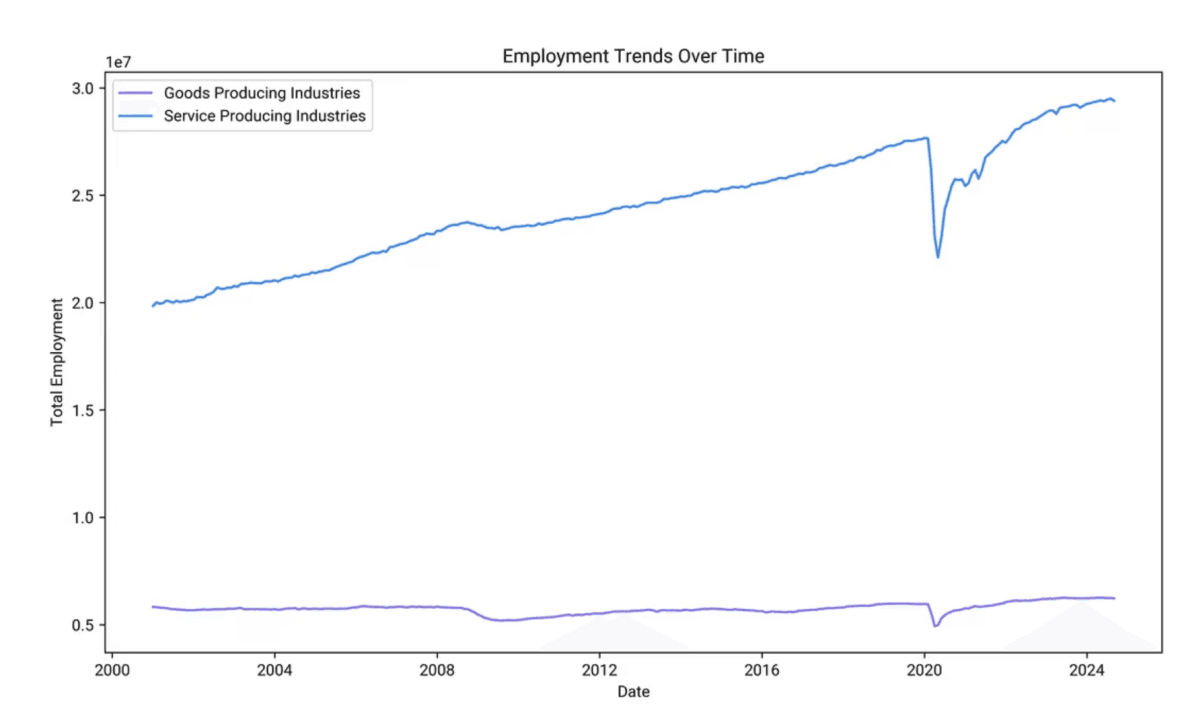
Employment Data Overview
Goods Producing Industries: Employment levels are generally lower compared to service industries, with a mean employment of around 5.8 million.
Service Producing Industries: Significantly higher employment levels, with a mean of approximately 19.8 million.
Employment Trends Visualization
Service Industries Growth: There is a clear upward trend in employment over time, with a noticeable dip around 2020, likely due to external economic factors.
Goods Industries Stability: Employment levels remain relatively stable over the years, with minor fluctuations.
Conclusion and Insights
Service Industry Dominance: The service sector consistently employs more people than the goods sector, reflecting a shift towards a service-oriented economy.
Economic Sensitivity: Both industries show sensitivity to economic changes, but the service sector demonstrates more resilience and recovery post-2020.
What is the distribution of employment numbers across different 'GEO' locations for a given time period?
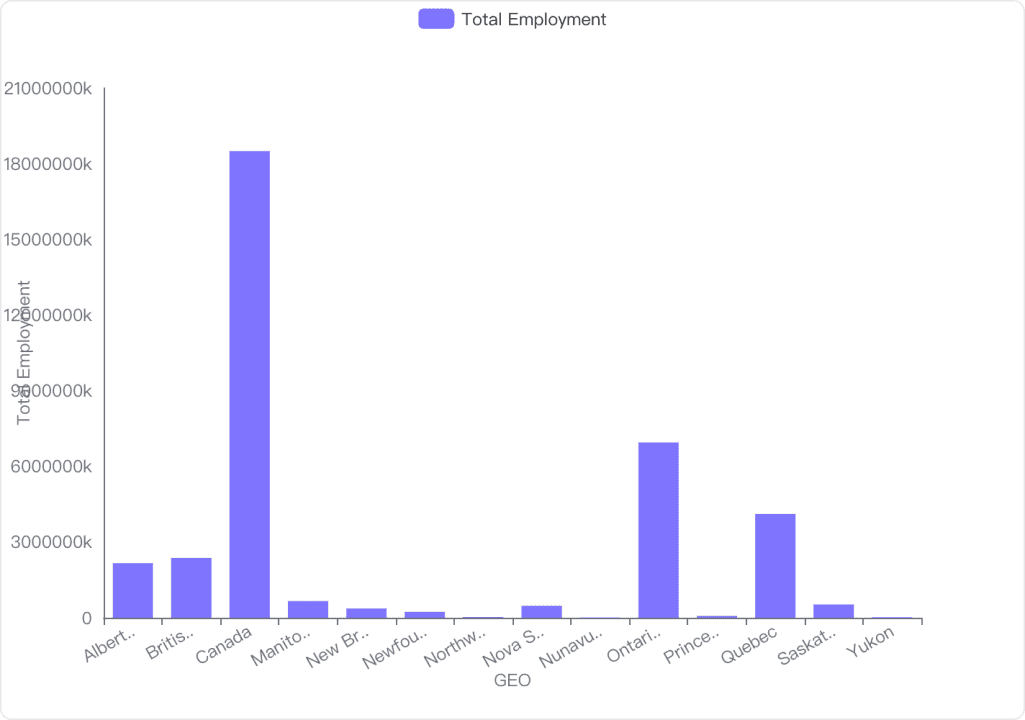
Employment Data Summary
Canada: Has the highest total employment with approximately 18.49 billion.
Ontario: Follows with a significant total employment of about 6.95 billion.
Quebec: Has a total employment of around 4.12 billion.
British Columbia: Shows a total employment of approximately 2.37 billion.
Alberta: Records a total employment of about 2.16 billion.
Visual Representation
Bar Chart: Illustrates the employment distribution, highlighting Canada's dominance in employment numbers.
Other Regions: Manitoba, New Brunswick, and others have significantly lower employment figures compared to the leading regions.
Conclusion and Insights
Concentration in Major Regions: Employment is heavily concentrated in Canada, Ontario, and Quebec.
Regional Disparities: There is a noticeable disparity in employment numbers across different GEO locations, with smaller regions having much lower figures.
What is the impact of geographical location on the 'Average weekly earnings including overtime for all employees'?
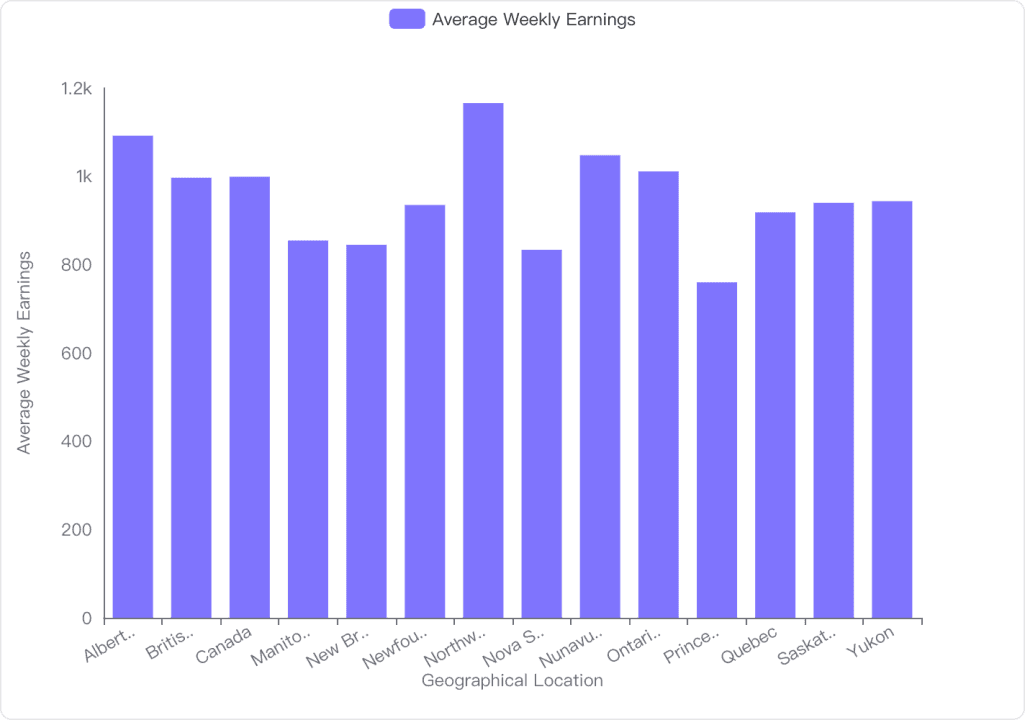
Analysis of Earnings by Location
Highest Earnings: The Northwest Territories have the highest average weekly earnings at 1165.55.
Lowest Earnings: Prince Edward Island has the lowest average weekly earnings at 759.58.
Overall Average: The mean average weekly earnings across all locations is 952.70.
Visualization Insights
Variation Across Regions: The bar chart shows significant variation in average weekly earnings across different geographical locations.
Notable Differences: Regions like Alberta and Nunavut also show higher earnings, while provinces like Nova Scotia and New Brunswick are on the lower end.
Conclusion and Insights
Geographical Impact: There is a clear impact of geographical location on average weekly earnings, with northern and resource-rich areas generally having higher earnings.
Policy Implications: Understanding these differences can help in formulating regional economic policies and addressing wage disparities.
How does the 'STATUS' of data entries affect the analysis of employment trends?
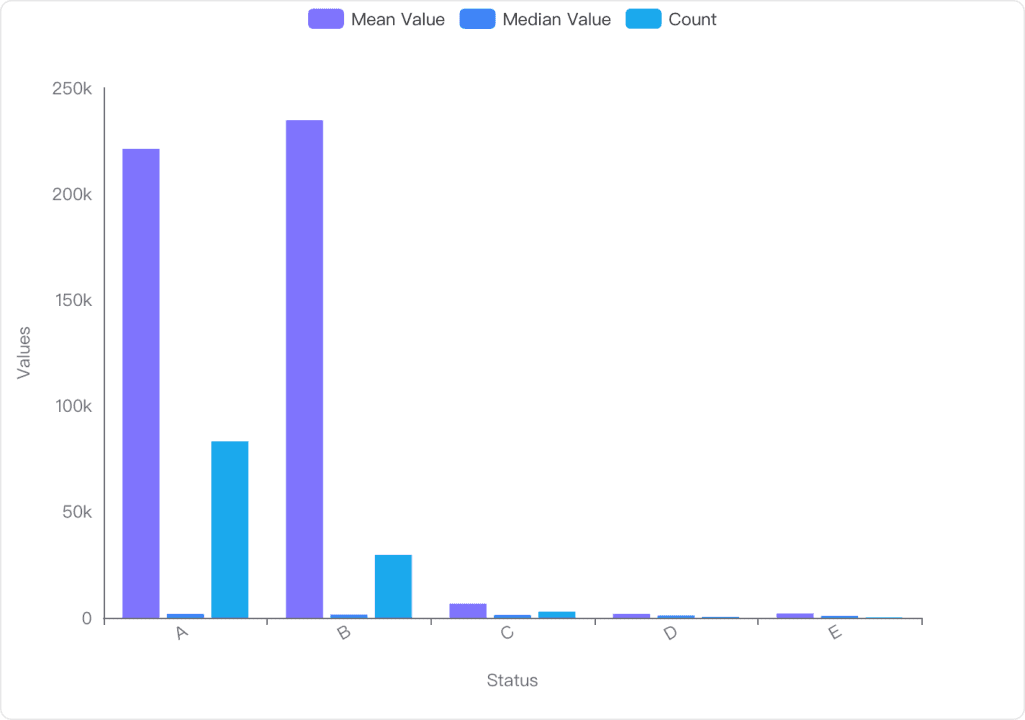
Analysis of 'STATUS' Values
High Mean Values: Status 'A' and 'B' have significantly higher mean values (221,249.90 and 234,686.54 respectively) compared to other statuses, indicating a strong impact on employment metrics.
Median Values: The median values for 'A' and 'B' are also higher (1,743.29 and 1,498.90), suggesting these statuses represent more substantial employment figures.
Count of Entries: Status 'A' has the highest count (83,213), followed by 'B' (29,649), indicating these statuses are more frequently recorded and likely more influential in trend analysis.
Visualization Insights
Dominance of 'A' and 'B': The bar chart shows that 'A' and 'B' dominate in terms of mean and count, reinforcing their importance in employment trends.
Negligible Impact of 'C', 'D', 'E': Statuses 'C', 'D', and 'E' have minimal values and counts, suggesting they have a lesser impact on overall trends.
Conclusion and Insights
Significant Influence: Status 'A' and 'B' are crucial for analyzing employment trends due to their high values and frequency.
Limited Impact of Other Statuses: Statuses 'C', 'D', and 'E' contribute less to the overall analysis, indicating they may represent less significant employment metrics.