11 AI Tools to Build Dashboards Without Code in 2026 (Expert Picks)

Introduction
Data drives the modern business landscape, but accessing its full potential has traditionally been locked behind walls of complex code. Today, the rise of artificial intelligence is fundamentally democratizing data analysis.
If you want to transform raw data into stunning, actionable visual narratives, you no longer need a degree in data science. AI tools to build dashboards without code are completely revolutionizing how teams interact with their metrics.
In this guide, we will explore the absolute best AI-powered platforms available today, with a special spotlight on how Powerdrill Bloom is leading the charge in effortless data visualization.
Why Traditional Dashboard Creation Is Still Too Complex
Before AI, building a dashboard was a frustrating, multi-step process. Traditional methods remain complex for several reasons:
Steep Learning Curves: They require extensive knowledge of SQL, Python, or proprietary formulas.
Heavy IT Reliance: Business users must wait in long queues for data engineering teams to fulfill simple visualization requests.
Time-Consuming Maintenance: Static dashboards break easily when data structures change, requiring manual fixes.
Lack of Conversational Interactivity: Traditional tools don't let you simply "ask" your data a question and get an immediate visual answer.
How We Selected the Best No-Code Dashboard Tools
To curate this list of top-tier AI BI platforms, we evaluated dozens of tools based on strict criteria:
True No-Code Capability: The tool must allow users to generate complex visualizations without writing a single line of code.
Advanced AI Features: We looked for natural language processing (NLP), automated insights, and AI-driven chart generation.
Ease of Integration: The platform must connect seamlessly to popular databases, cloud storage, and spreadsheets.
User Experience (UX): An intuitive, drag-and-drop, and chat-based interface was heavily prioritized.
Quick Comparison Table
Tool | Best For | Standout AI Feature | Pricing |
Instant, AI-native dashboard creation | Conversational UI to fully interactive dashboards | ||
Enterprise visual analytics | Automated metric insights | ||
Search-driven BI | AI-powered natural language search | ||
Spreadsheet lovers | Cloud warehouse data generation | Custom pricing | |
Zoho ecosystem users | Zia (AI Assistant) | ||
Complex data modeling | Insight Advisor | Custom pricing | |
Predictive analytics | Generative AI for predictive modeling | Custom pricing | |
Ad-hoc data analysis | AI chat to charts | ||
E-commerce & Marketers | Auto-generates apps from spreadsheets | ||
Modern spreadsheet users | AI analyst in a spreadsheet | ||
Large-scale operations | Proactive alerts & AI insights | Custom pricing |
1. Powerdrill Bloom
Powerdrill Bloom is a cutting-edge, AI-native platform designed to eliminate the friction between raw data and actionable dashboards. It is built from the ground up to let users build, analyze, and share dashboards through simple natural language.
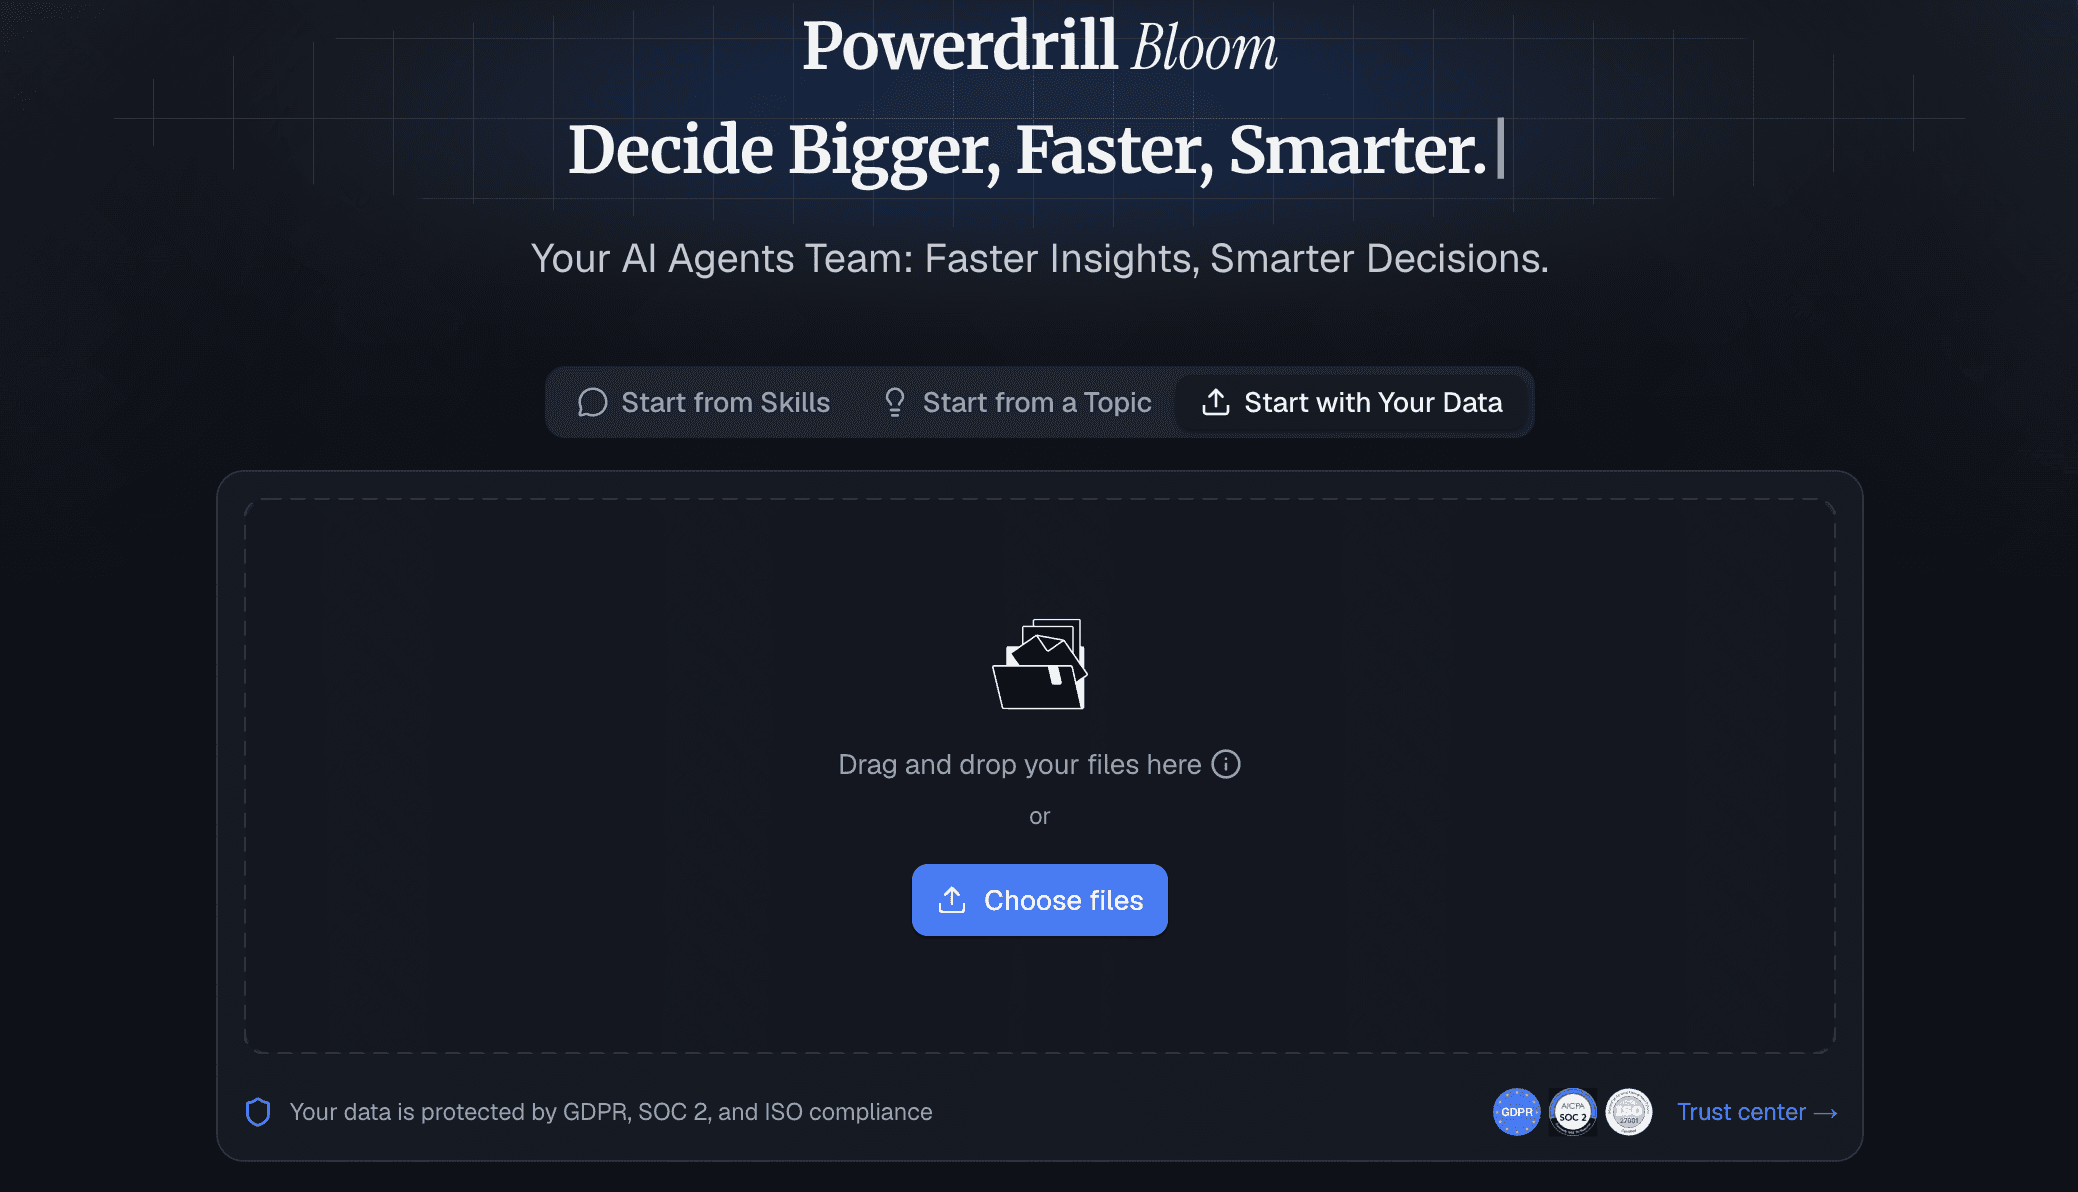
Key Features
Chat-to-dashboard capabilities using advanced LLMs.
One-click connections to various datasets and cloud platforms.
Automated data cleaning and smart formatting.
Pros
Absolute zero coding required; highly intuitive conversational UI.
Generates comprehensive dashboards in seconds, not hours.
Exceptional sharing and embedding capabilities for teams.
Cons
Focuses heavily on modern AI workflows, which might feel different to traditional BI veterans.
Extremely complex legacy on-premise integrations may require workarounds.
Pricing
Offers a generous free tier with flexible; Pro starts at $13.27/month.
2. Tableau Pulse
Tableau Pulse injects generative AI into the robust, legacy Tableau ecosystem, aiming to deliver personalized metric insights directly to business users.
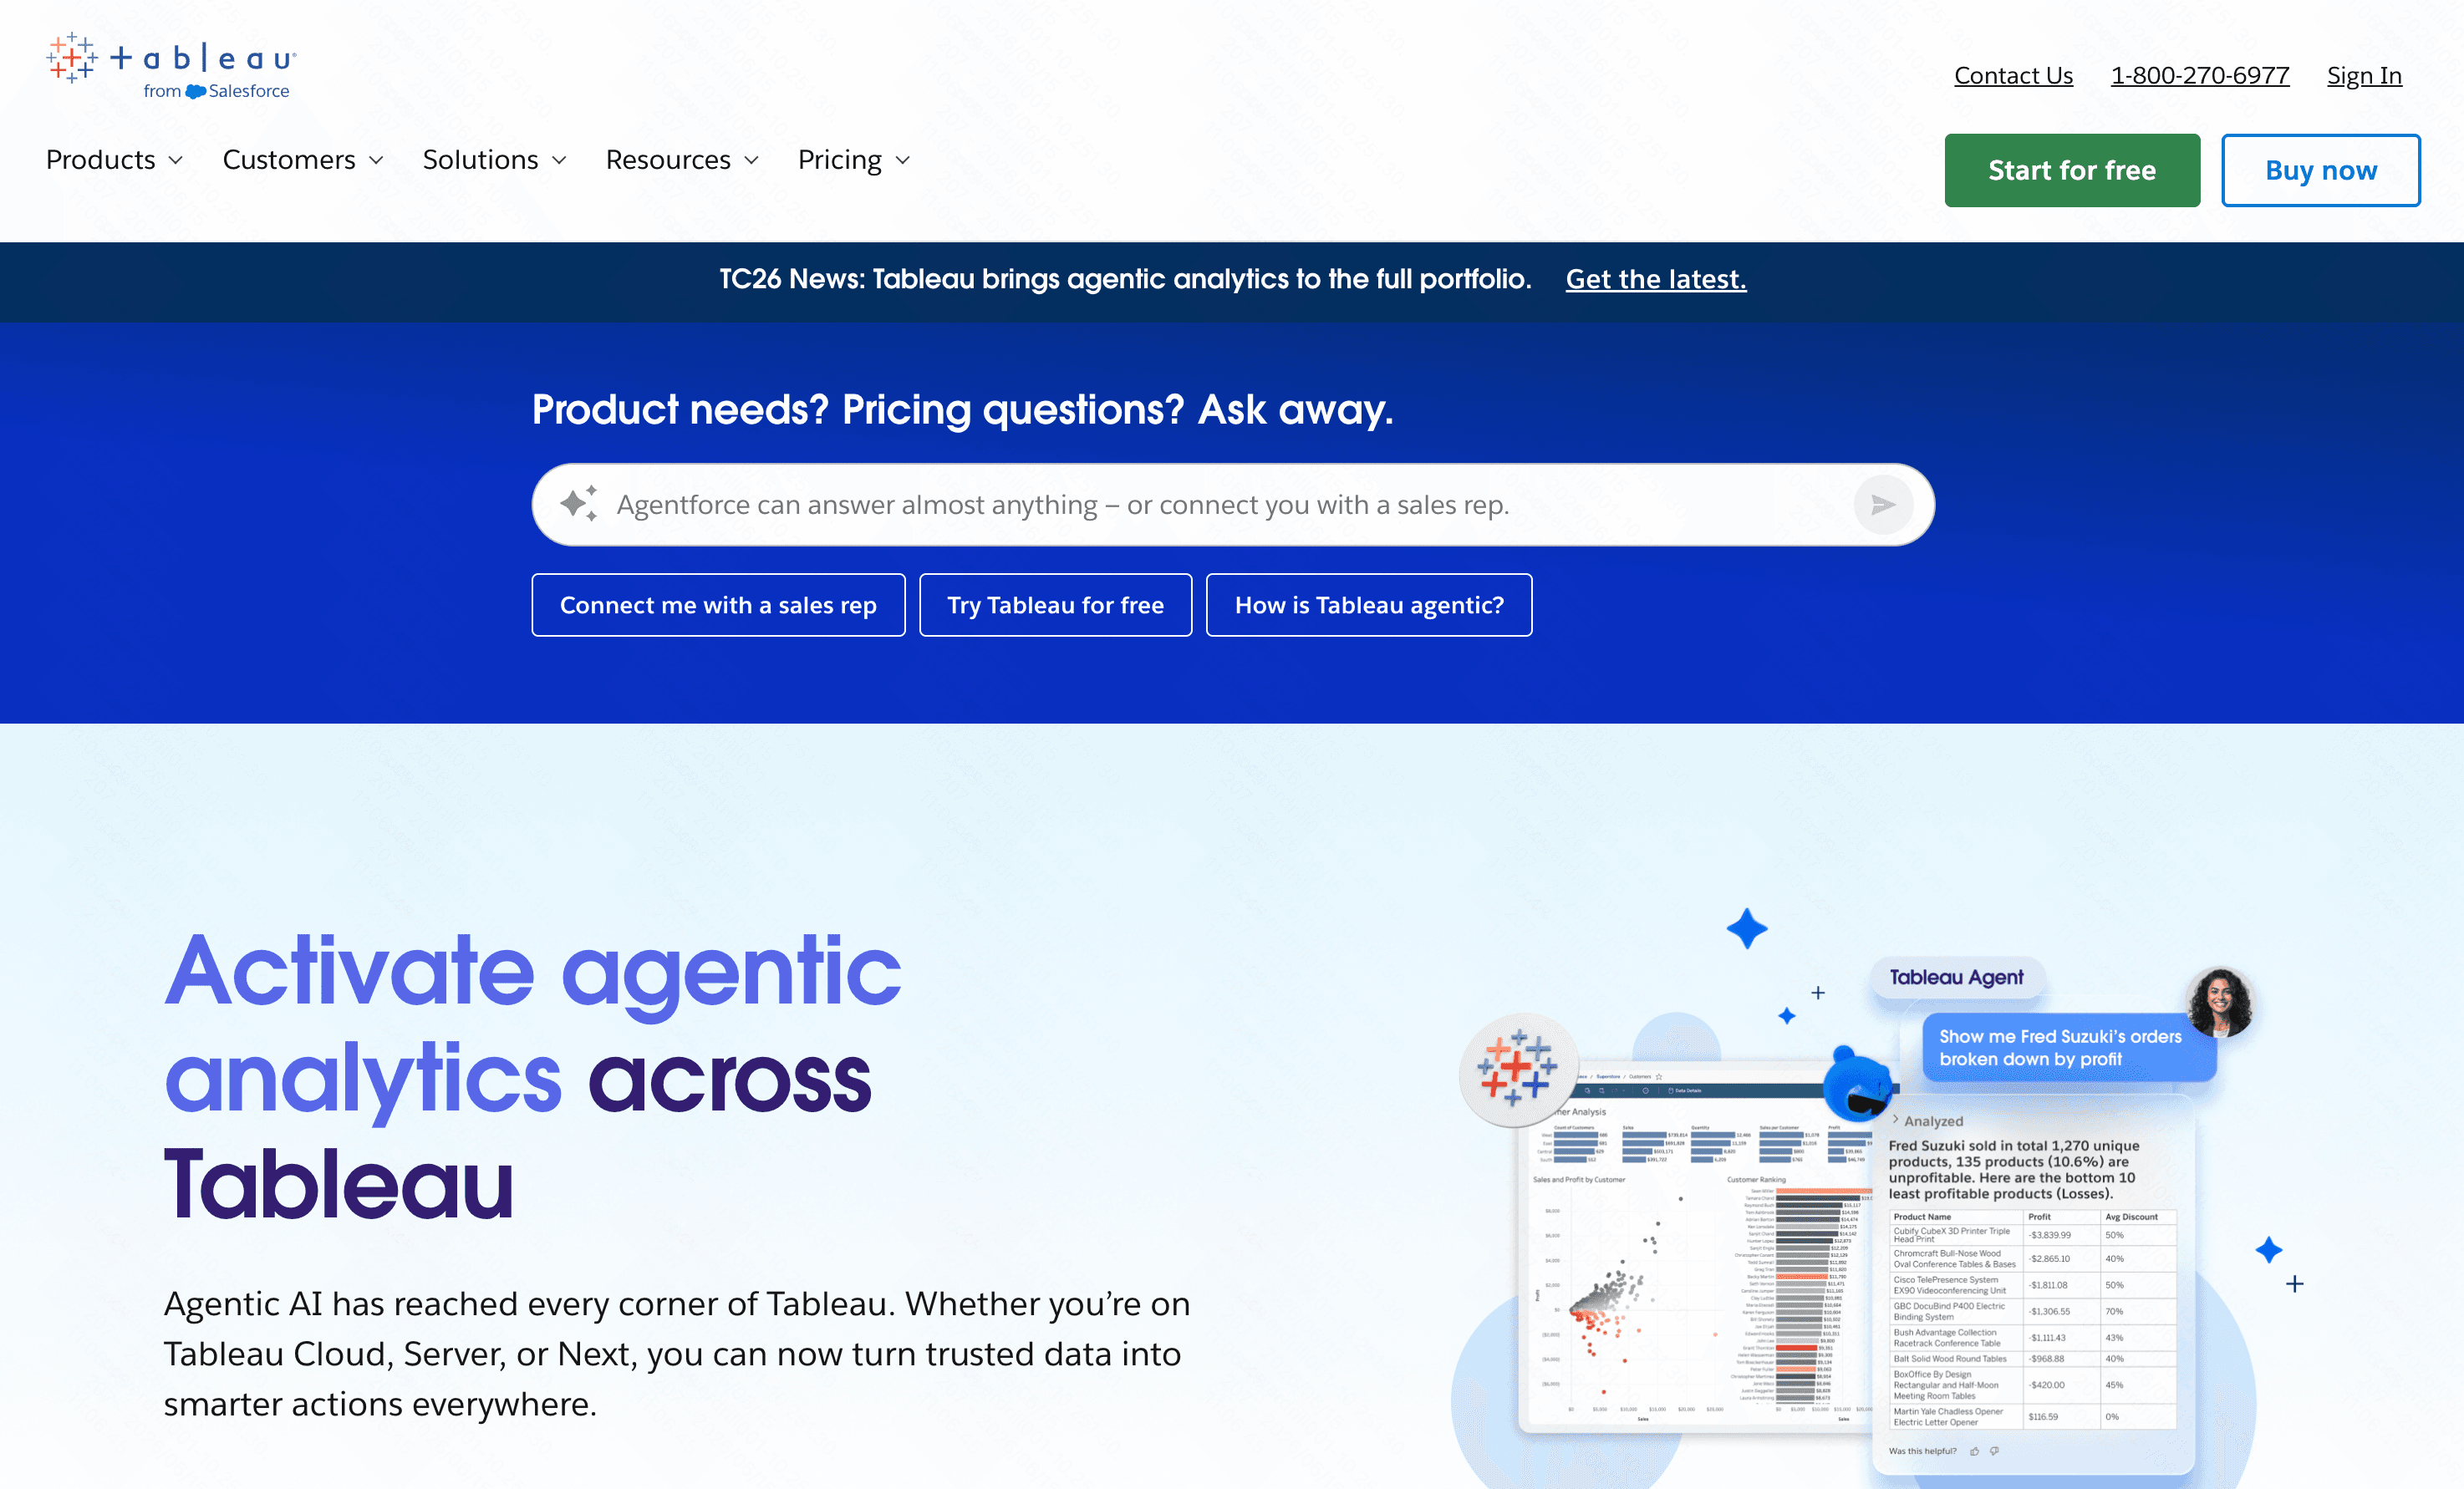
Key Features
Automated, personalized metric summaries.
Seamless integration with Salesforce CRM.
Pros
Incredible depth of visual customization.
Backed by Salesforce's massive ecosystem.
Cons
The broader Tableau platform still has a steep learning curve.
Can be overwhelmingly complex for small teams.
Pricing
Start at $15/per user month.
3. ThoughtSpot
ThoughtSpot pioneered search-driven BI, allowing users to search their data like they would on Google to generate charts.
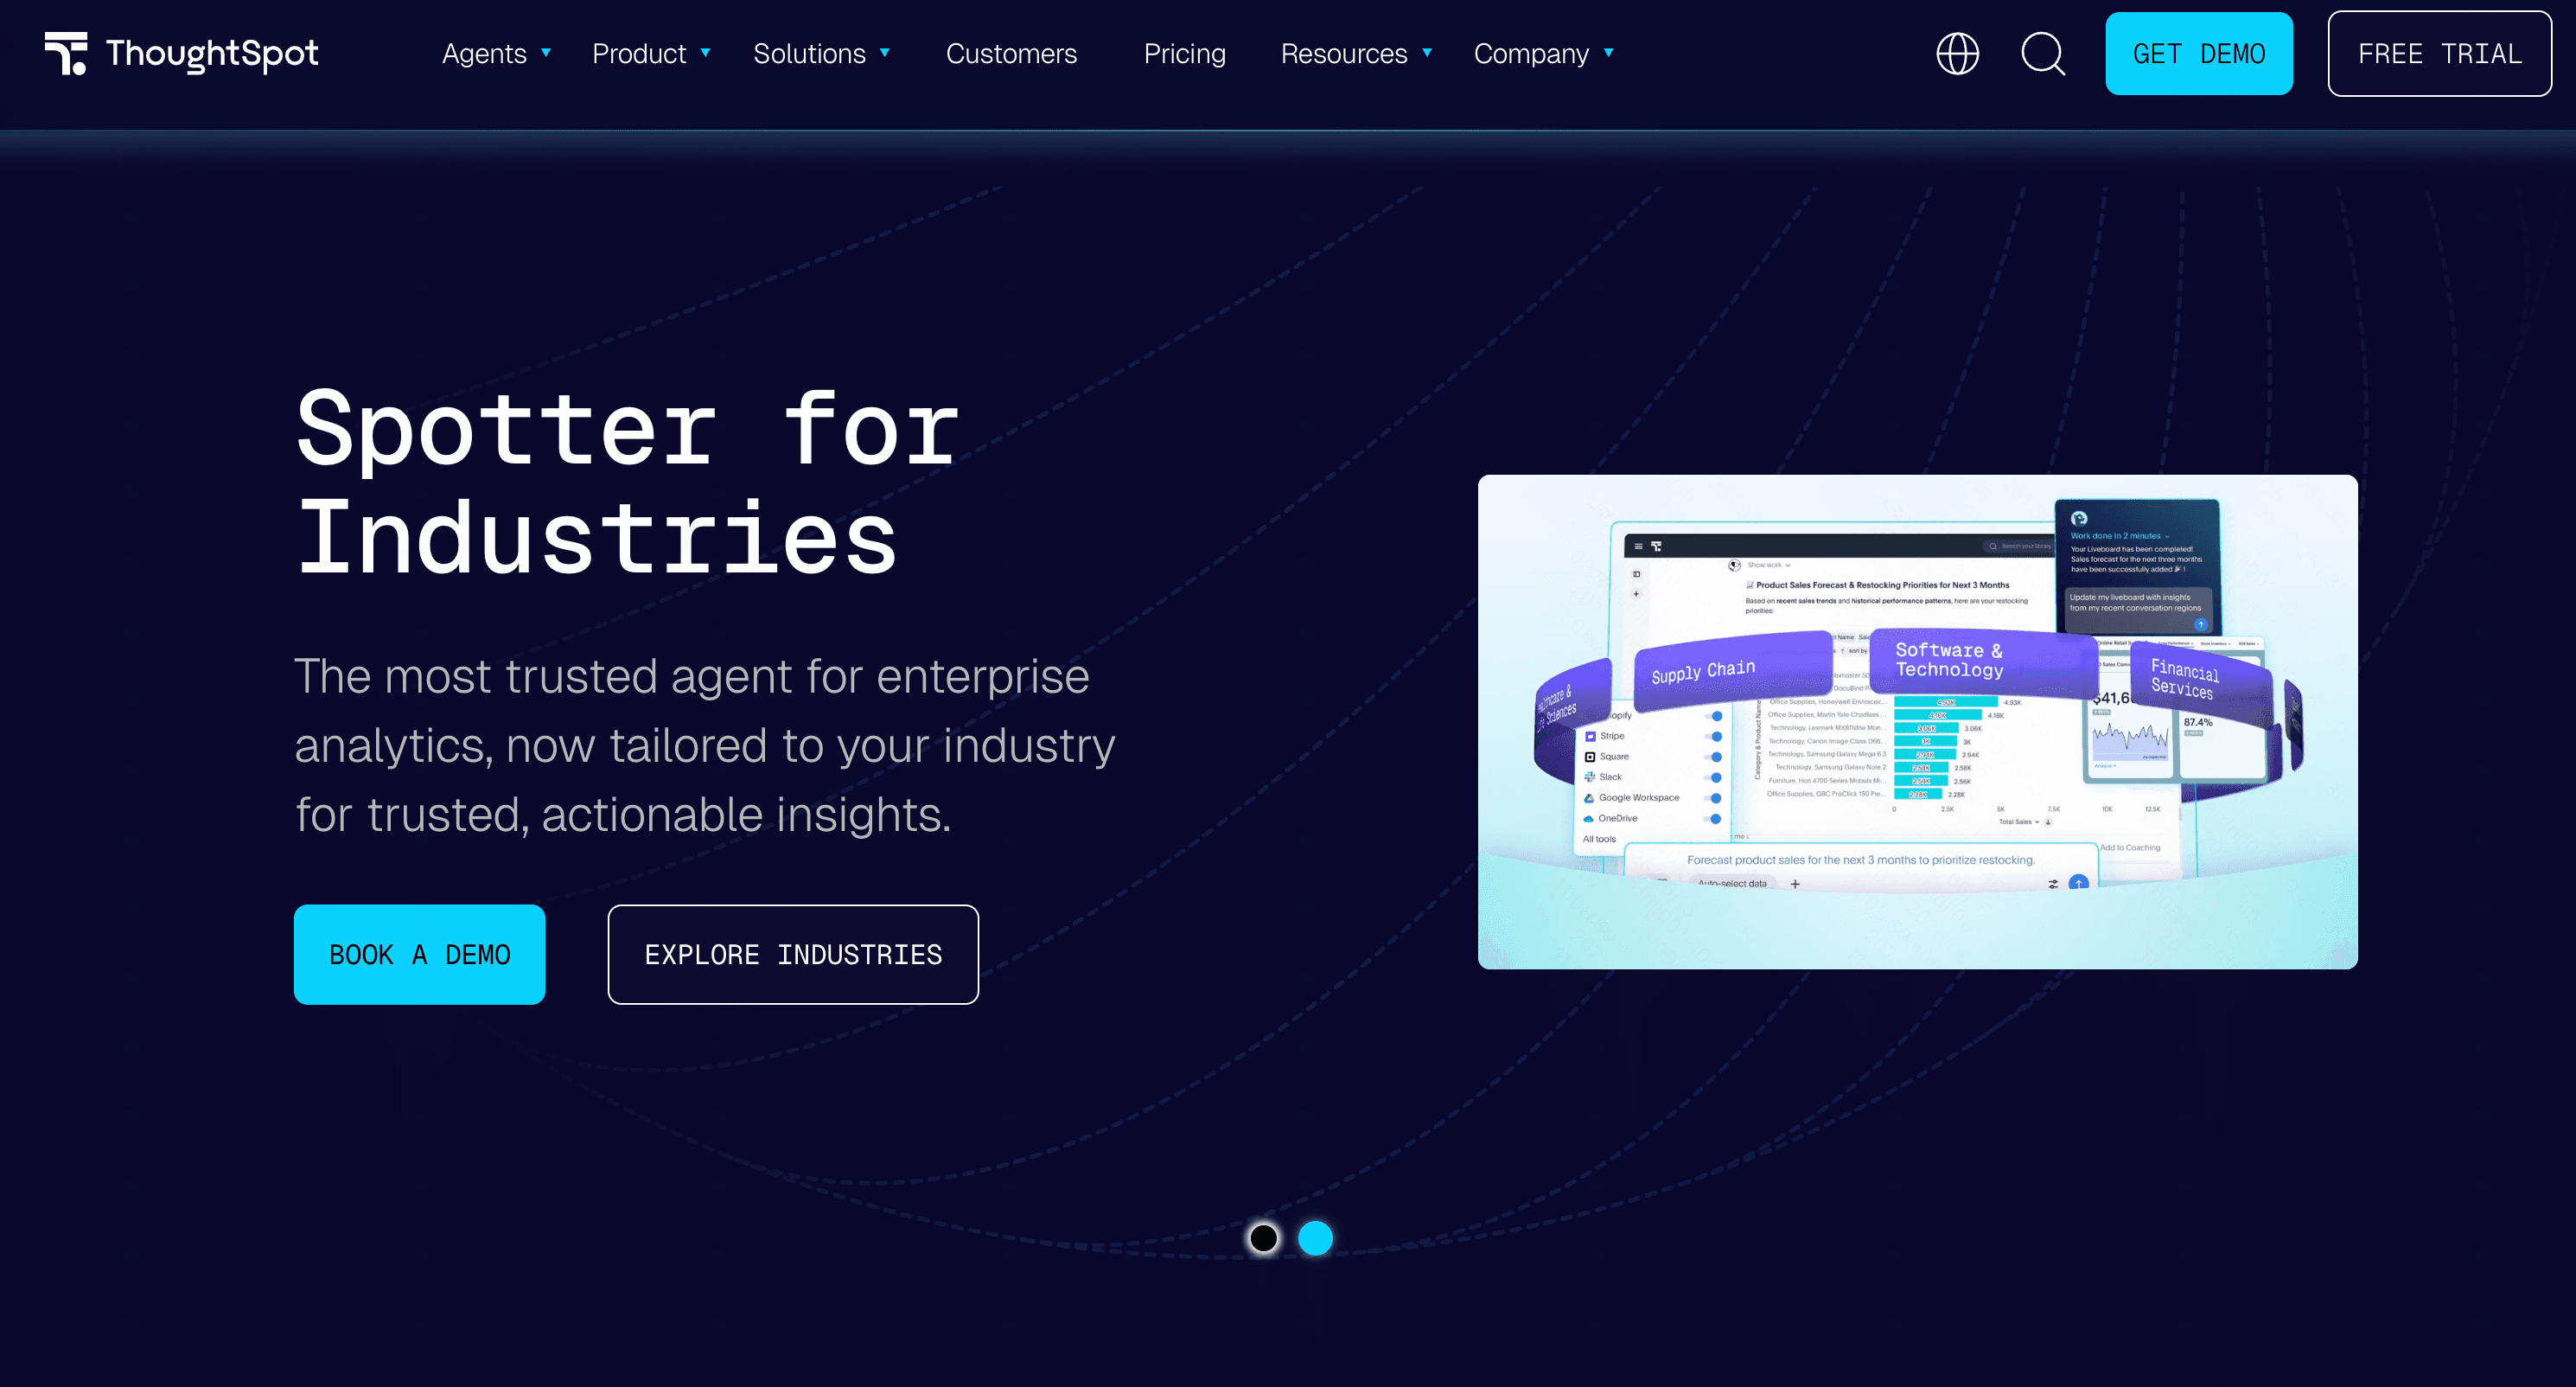
Key Features
AI-powered relational search engine.
SpotIQ automated insights.
Pros
Great for self-service analytics.
Fast query performance on large datasets.
Cons
Requires a well-structured cloud data warehouse to function well.
High cost of entry.
Pricing
Starts at around $50/per user month, scales rapidly with data usage.
4. Sigma Computing
Sigma provides a spreadsheet-like interface on top of cloud data warehouses, utilizing AI to help users build pivot tables and charts without SQL.
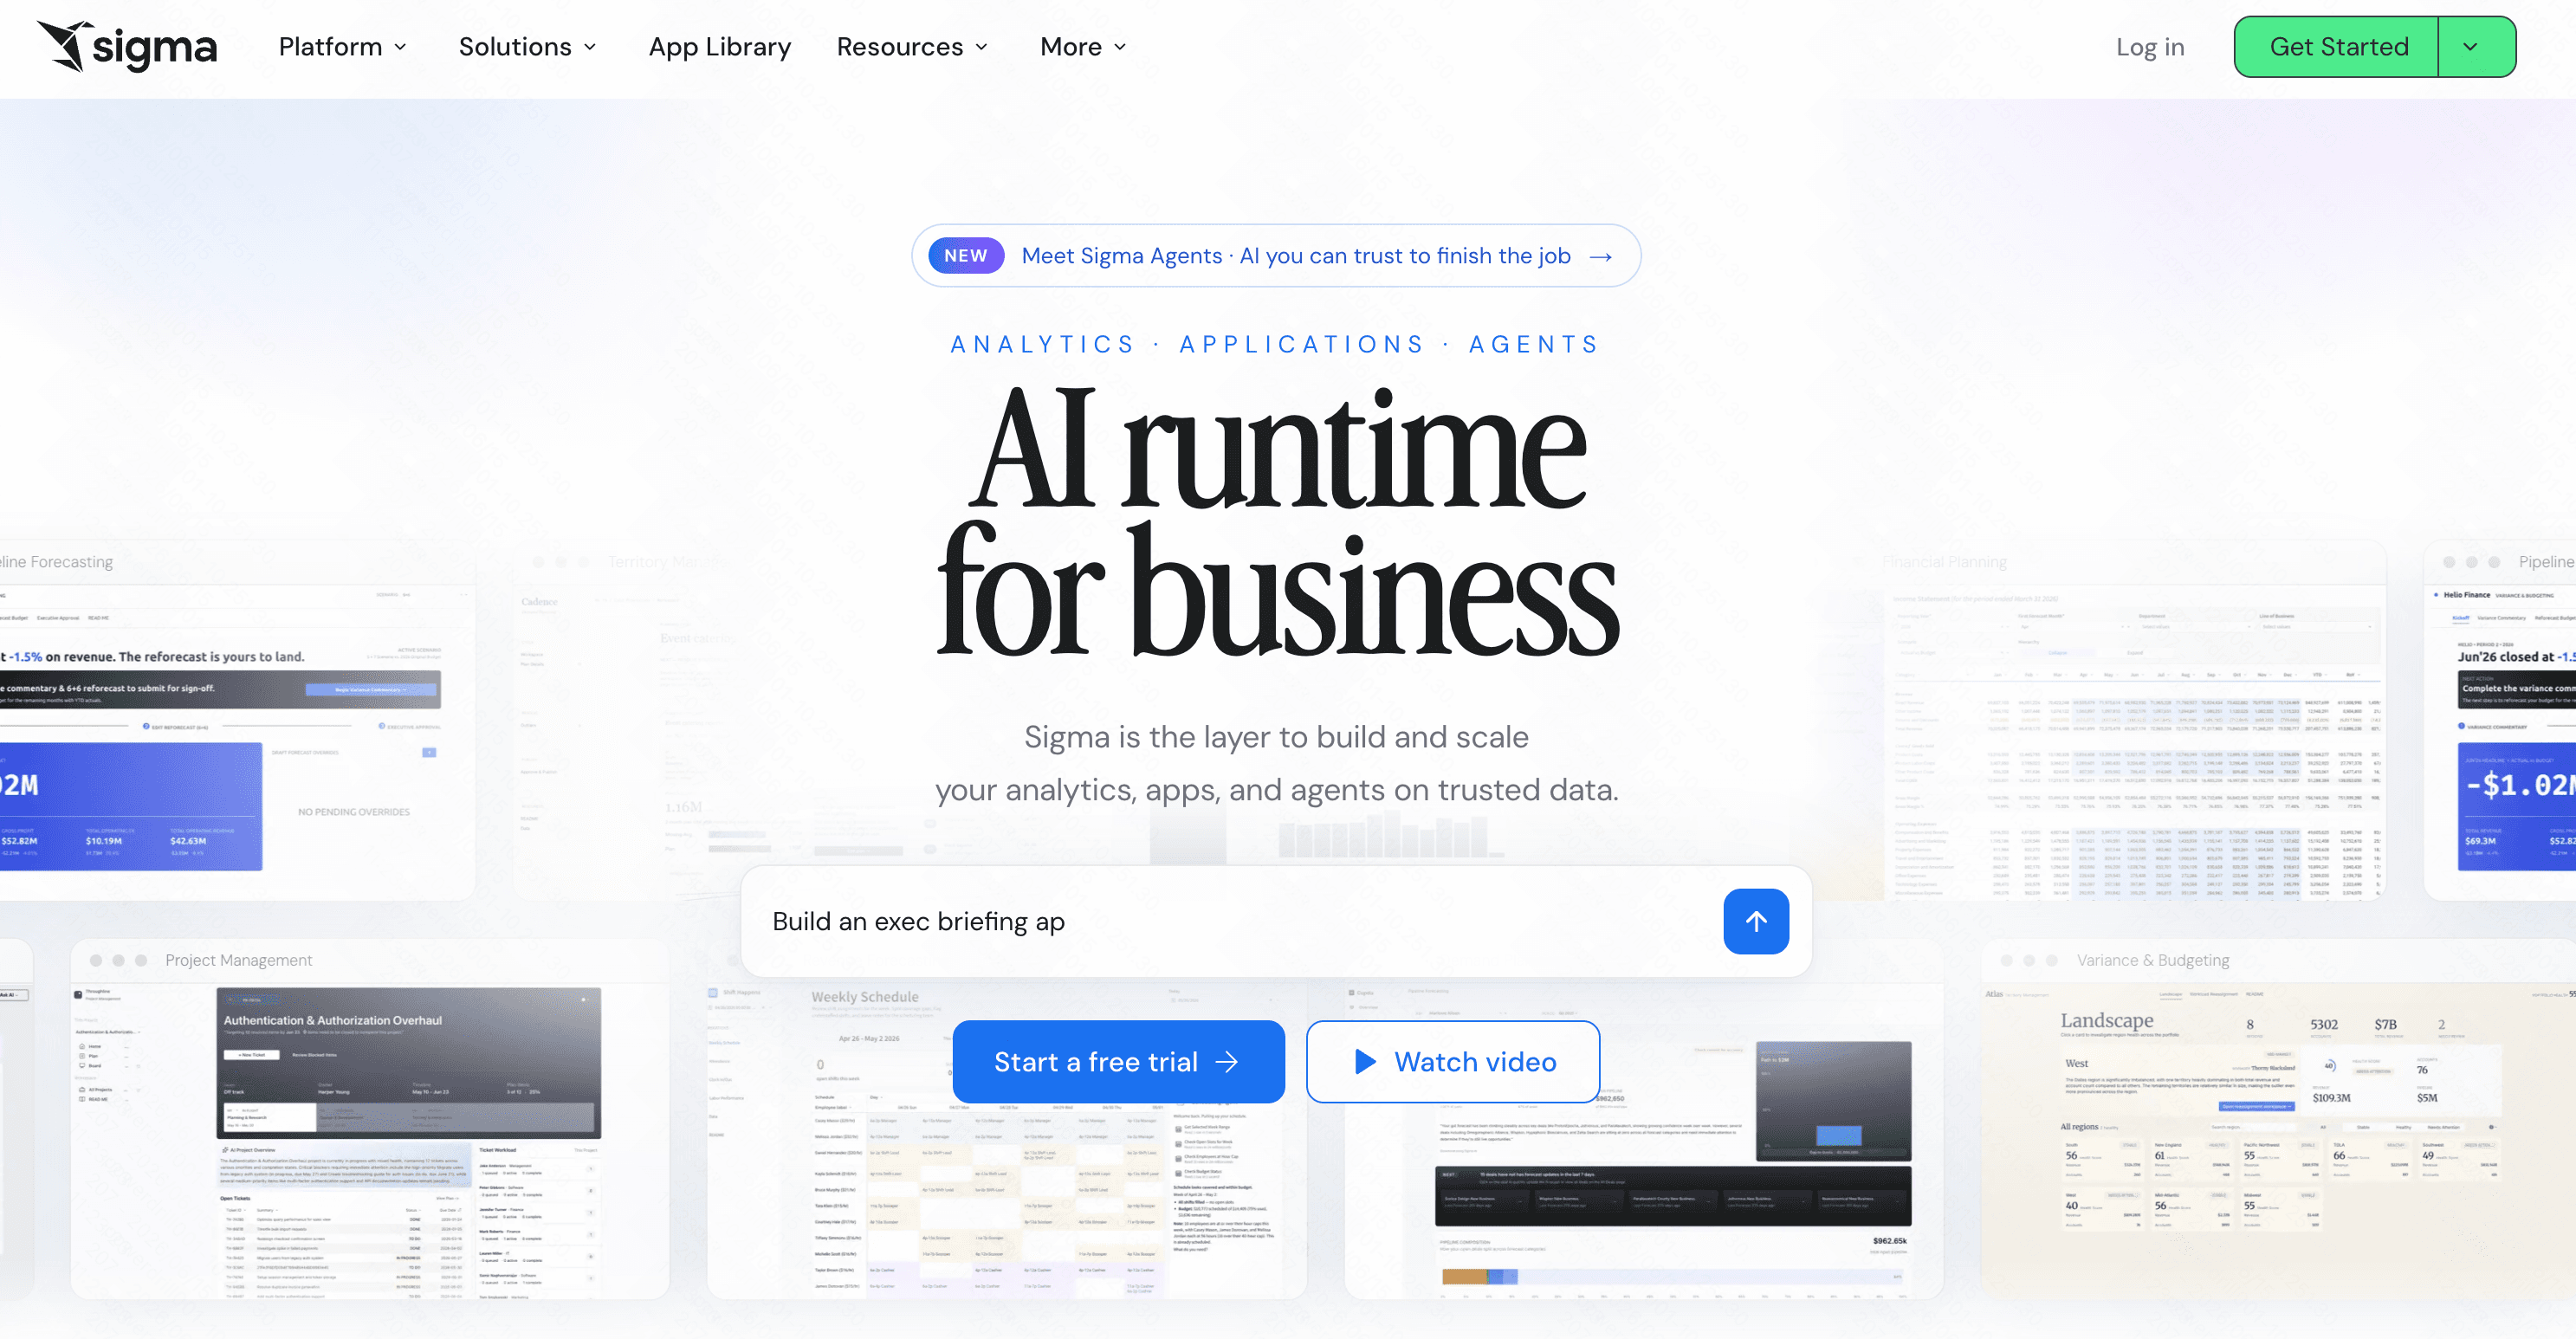
Key Features
Familiar spreadsheet UI.
Direct connection to Snowflake, BigQuery, etc.
Pros
No data extraction required (live queries).
Great for Excel power users.
Cons
Not a standalone tool; requires an existing cloud data warehouse.
Dashboards can look a bit rigid.
Pricing
Custom enterprise pricing.
5. Zoho Analytics
A highly affordable, user-friendly BI platform that utilizes its AI assistant, Zia, to help users create dashboards.
Key Features
Zia natural language assistant.
Deep integration with Zoho apps.
Pros
Very cost-effective for small to medium businesses.
Hundreds of pre-built integrations.
Cons
The user interface feels slightly dated.
AI capabilities are basic compared to modern LLM-native tools.
Pricing
Starts at $24/month.
6. Qlik Sense
Qlik Sense uses its Insight Advisor to auto-generate analytics, relying on an associative data engine to map relationships.

Key Features
Associative AI data engine.
Drag-and-drop dashboard creation.
Pros
Handles complex data relationships beautifully.
Strong mobile application.
Cons
Initial setup and data modeling can be very technical.
Expensive for smaller teams.
Pricing
Custom pricing.
7. Akkio
Akkio focuses on generative BI and predictive analytics, allowing agencies and marketers to forecast trends without coding.
Key Features
Chat-to-predict modeling.
Data prep via AI.
Pros
Excellent for forecasting and lead scoring.
Very fast model training.
Cons
More focused on predictive AI than traditional BI dashboarding.
Customization of visual charts is limited.
Pricing
Custom pricing.
8. Julius AI
Julius is a versatile AI data analyst that lets you upload files and chat with your data to generate Python-backed visualizations.
Key Features
Conversational interface for data analysis.
Exports directly to Excel or CSV.
Pros
Excellent for rapid, ad-hoc analysis.
Highly accurate statistical visualizations.
Cons
Lacks robust, live-updating dashboard publishing features.
Not ideal for continuous enterprise monitoring.
Pricing
Free basic tier; plus starts at $20/month.
9. Polymer Search
Polymer uses AI to transform static spreadsheets into interactive, web-based applications and dashboards almost instantly.
Key Features
Auto-tagging and categorization of data.
One-click web app generation.
Pros
Extremely fast setup for Excel/CSV users.
Beautiful, modern user interface.
Cons
Not suited for complex, multi-table database joins.
Limited advanced analytical functions.
Pricing
Starts at $25/month.
10. Rows AI
Rows is a modern spreadsheet with a built-in AI analyst that summarizes data and builds charts without formulas. Following its acquisition by Superhuman, the platform is increasingly focused on helping teams work faster with data-driven workflows.
Key Features
AI-generated summaries and charts.
Built-in integrations for marketing tools (GA4, Stripe).
Pros
Replaces Excel perfectly for modern teams.
Great API integrations.
Cons
It is ultimately a spreadsheet, not a dedicated BI dashboard suite.
Performance drops with massive datasets.
Pricing
Free tier available; starts at $8/per user month.
11. Domo
Domo is a massive enterprise platform that handles data integration, BI, and AI-driven automated alerts.
Key Features
Massive library of data connectors.
AI-driven alerts and text summaries.
Pros
Unmatched scale for enterprise data integration.
Real-time data streaming capabilities.
Cons
Overwhelmingly feature-heavy for standard users.
One of the most expensive tools on the market.
Pricing
Custom pricing.
Common Dashboard Types You Can Build With AI
With modern AI tools, you can instantly generate a variety of business-critical views:
Sales and Revenue Dashboards: Track MRR, churn rates, and sales pipeline velocity in real-time.
Marketing Performance Dashboards: Consolidate data from Google Ads, social media, and CRM to calculate true ROI.
Financial Health Dashboards: Monitor cash flow, expenses, and profit margins with automated forecasting.
Operational Dashboards: Keep an eye on supply chain logistics, inventory levels, and team productivity.
How to Choose the Best Tools for Your Workflow
Choosing the right tool depends heavily on your team's size, budget, and technical background. If you are a massive Fortune 500 company with a dedicated data engineering team and an unlimited budget, legacy giants like Tableau Pulse or Domo might fit your massive infrastructure. If you just want to analyze a single spreadsheet quickly, Rows AI or Polymer are decent choices.
However, if you are looking for the perfect intersection of zero-code simplicity, powerful AI-driven insights, and professional-grade visualization, Powerdrill Bloom is undeniably the smartest choice. It bridges the gap between complex data and business users flawlessly. Instead of wrestling with rigid interfaces, Powerdrill Bloom lets you quite literally talk to your data, transforming your everyday language into stunning, interactive dashboards that drive real business growth.
Conclusion
The era of waiting weeks for IT to build a simple chart is officially over. By leveraging AI tools to build dashboards without code, teams can make faster, smarter decisions. While there are many options on the market, Powerdrill Bloom stands out as the ultimate solution for anyone wanting fast, beautiful, and highly accurate insights without writing a single line of code. Stop wrestling with your data and start conversing with it—try Powerdrill Bloom today and revolutionize your analytics workflow.
FAQs
What is the best AI tool to build dashboards without code?
Powerdrill Bloom is top-rated for its intuitive AI interface, letting you turn data into interactive dashboards instantly without coding.
Can I build a dashboard using natural language?
Yes, Powerdrill Bloom allows you to type simple questions and instantly generates accurate, visual dashboard components from your data.
Do I need SQL knowledge to use AI dashboard tools?
Not with no-code tools like Powerdrill Bloom, which handles the complex data querying entirely behind the scenes for you.
Can I share my AI-generated dashboards with my team?
Absolutely. Powerdrill Bloom makes it effortless to share dynamic dashboards via secure links or embedded iframe elements instantly.