AI Business Summary Visualiser

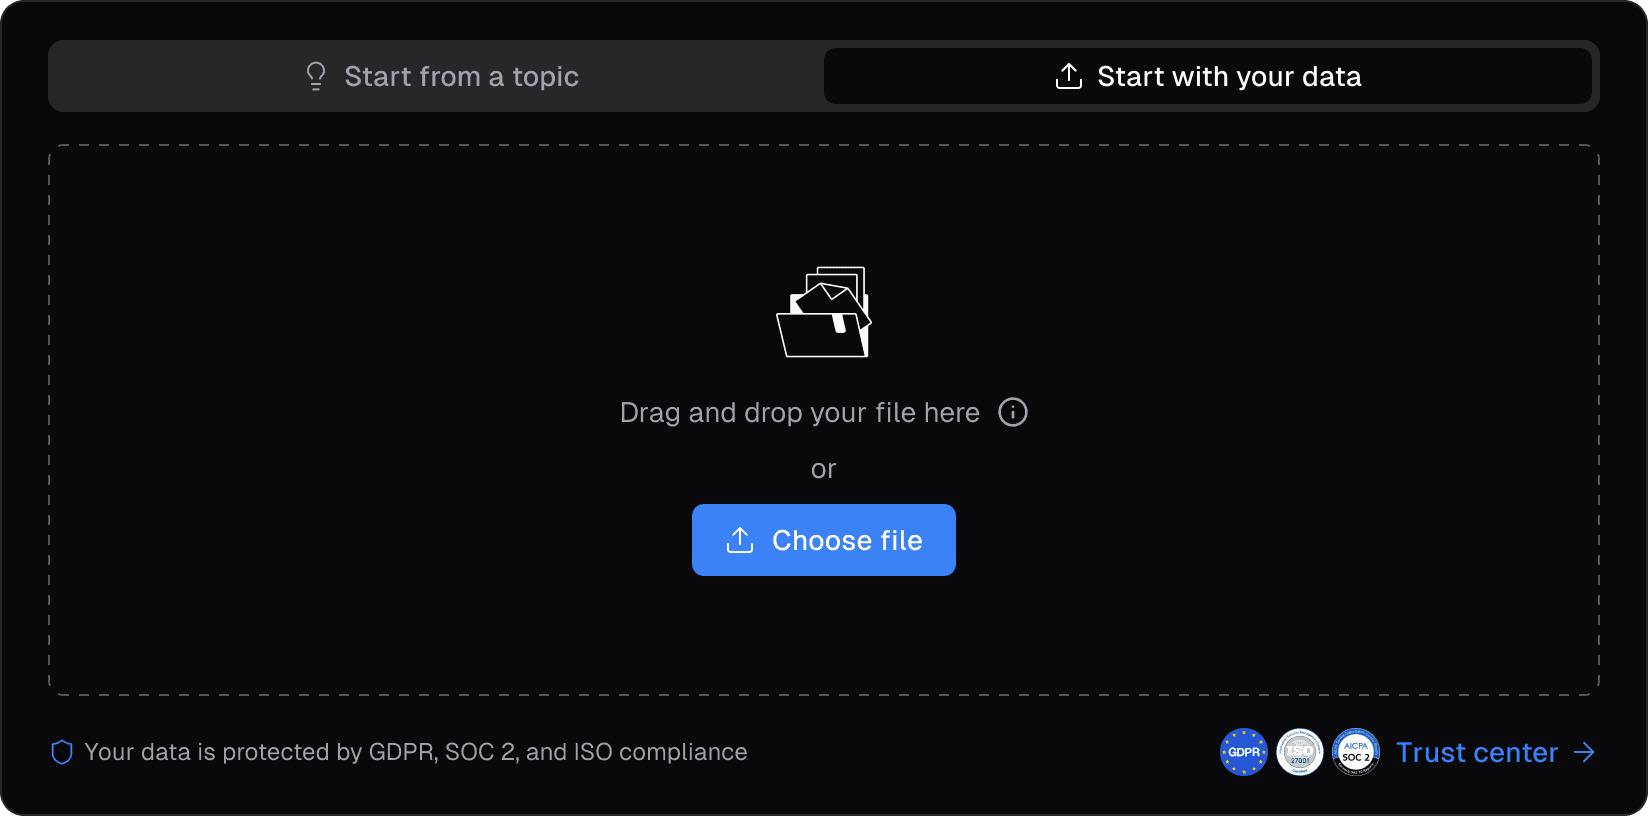
Convert business reports, strategy docs and dashboard text into visual one-pagers diagrams, KPIs and narrative leadership can scan in 30 seconds.

操作流程

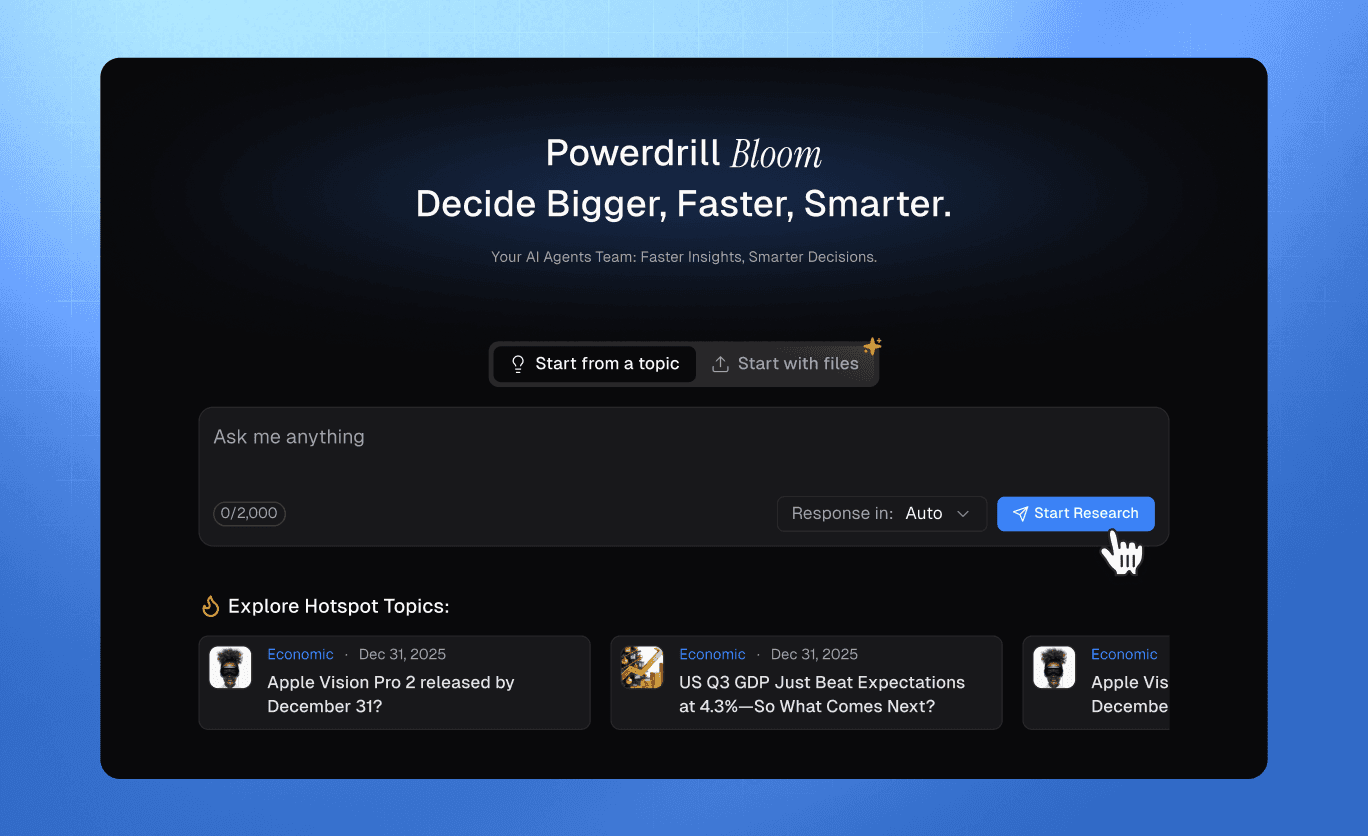
Strategy doc visualiser

Convert strategy narrative into a visual diagram and recommendation block.

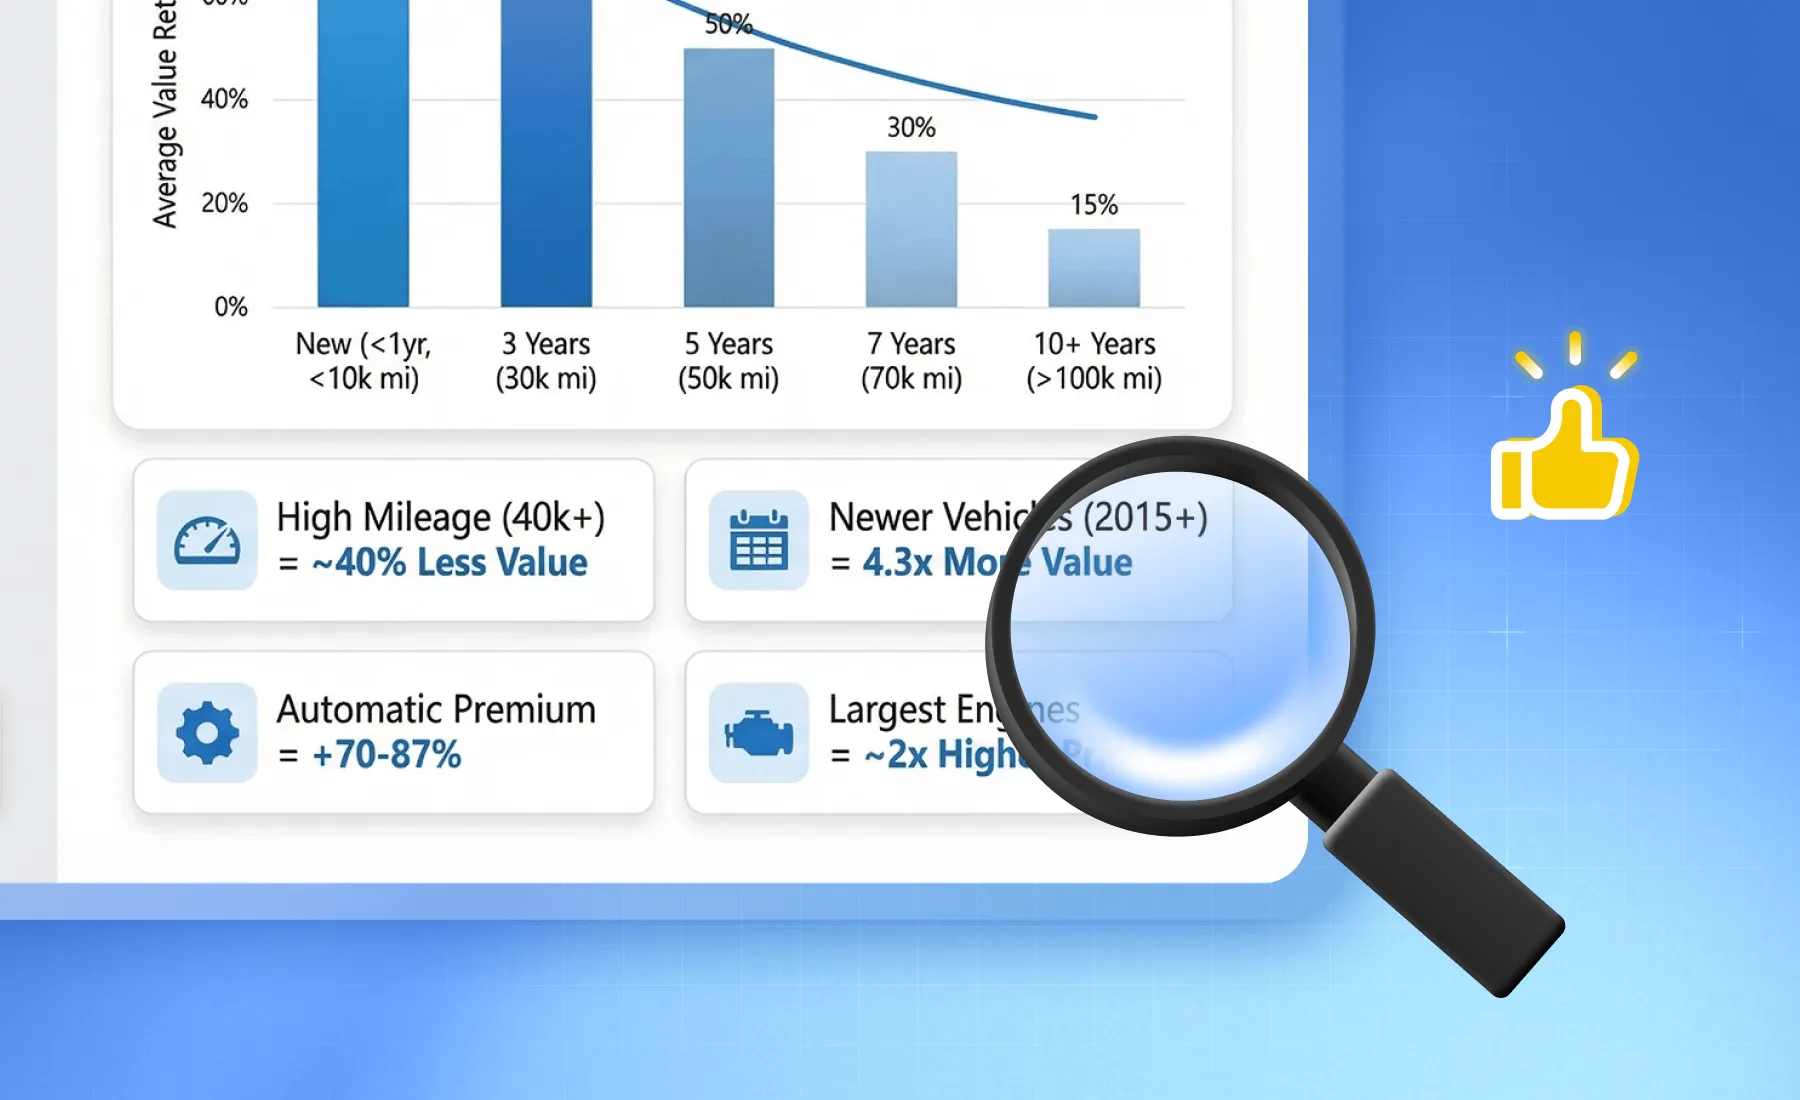
KPI dashboard visualiser

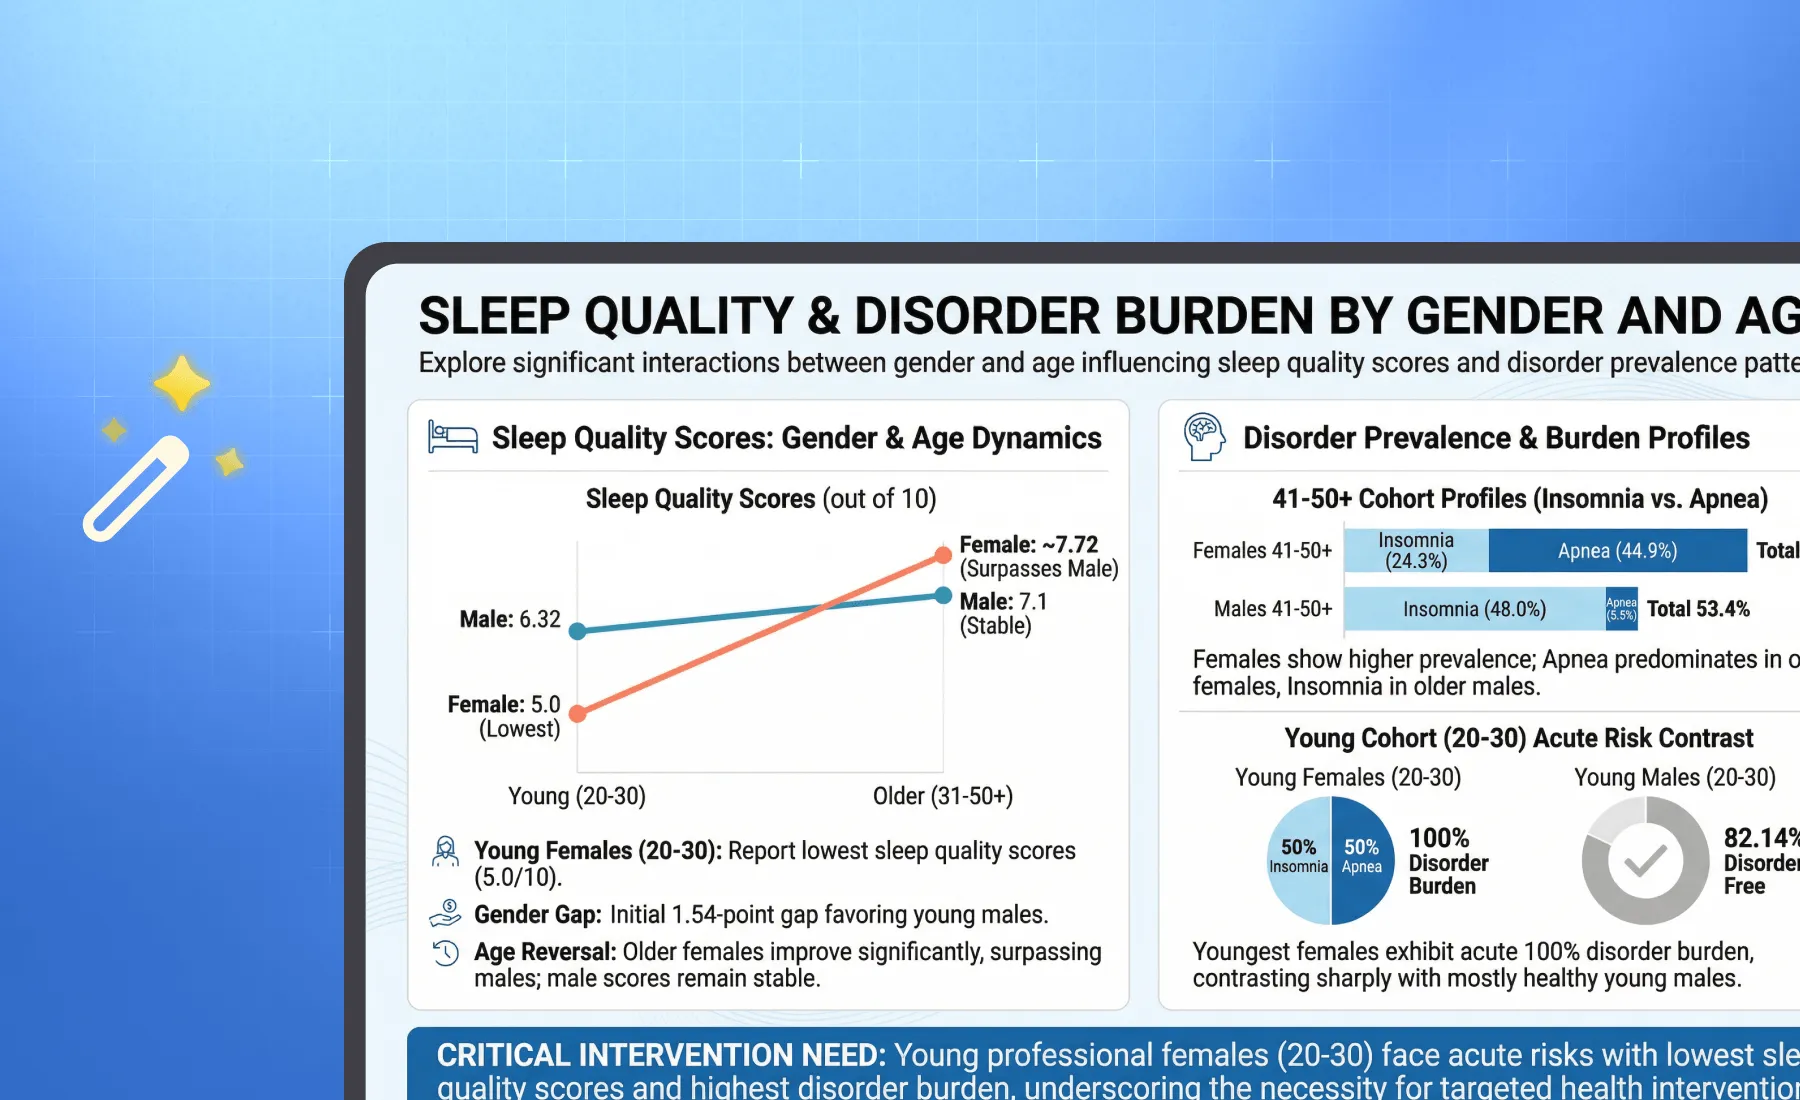
Translate dashboard numbers into a stakeholder-ready visual.
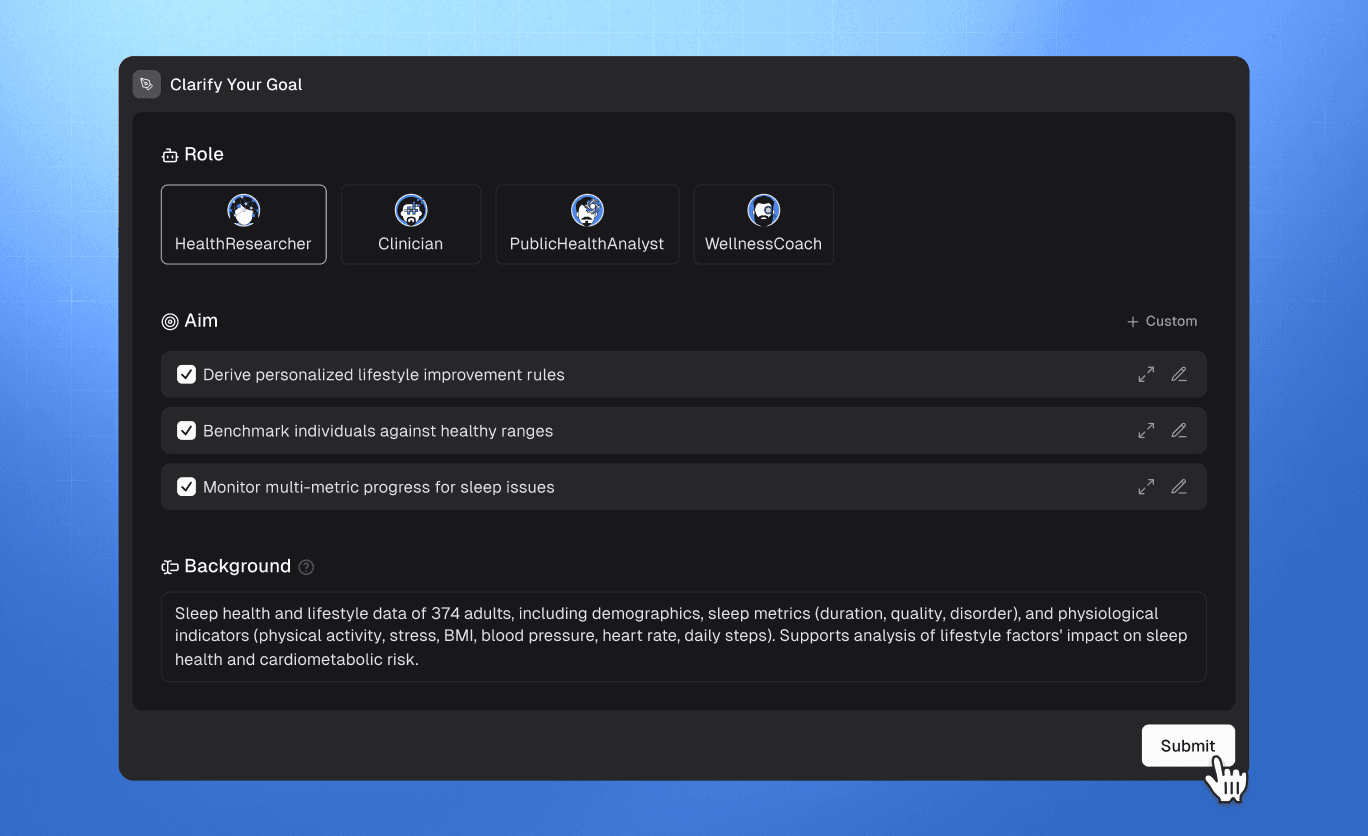
What you'll get

Quarterly visual overview

Quarterly visual overview with KPI tiles, narrative content, and trend chart.

Quarterly visual overview

Quarterly visual overview with KPI tiles, narrative content, and trend chart.

Strategy diagram visual

Strategy diagram visual showing options, recommendation and OKRs.

Strategy diagram visual

Strategy diagram visual showing options, recommendation and OKRs.

Departmental review visual

Departmental review visual overview covering status, achievements, and risks.

Departmental review visual

Departmental review visual overview covering status, achievements, and risks.

Zero Design Skills Needed

Forget alignment guides and font matching. Let the AI handle the whitespace, hierarchy, and color contrast. You focus on the data decision; we handle the pixel-perfect delivery.

Zero Design Skills Needed

Forget alignment guides and font matching. Let the AI handle the whitespace, hierarchy, and color contrast. You focus on the data decision; we handle the pixel-perfect delivery.

操作流程

Step 1

Upload the source

report, strategy doc or pasted dashboard text.

Step 1

Upload the source

report, strategy doc or pasted dashboard text.

Step 2

Pick the visual frame

Pick a visual format, such as frame, diagram, or scoreboard style.

Step 2

Pick the visual frame

Pick a visual format, such as frame, diagram, or scoreboard style.

Step 3

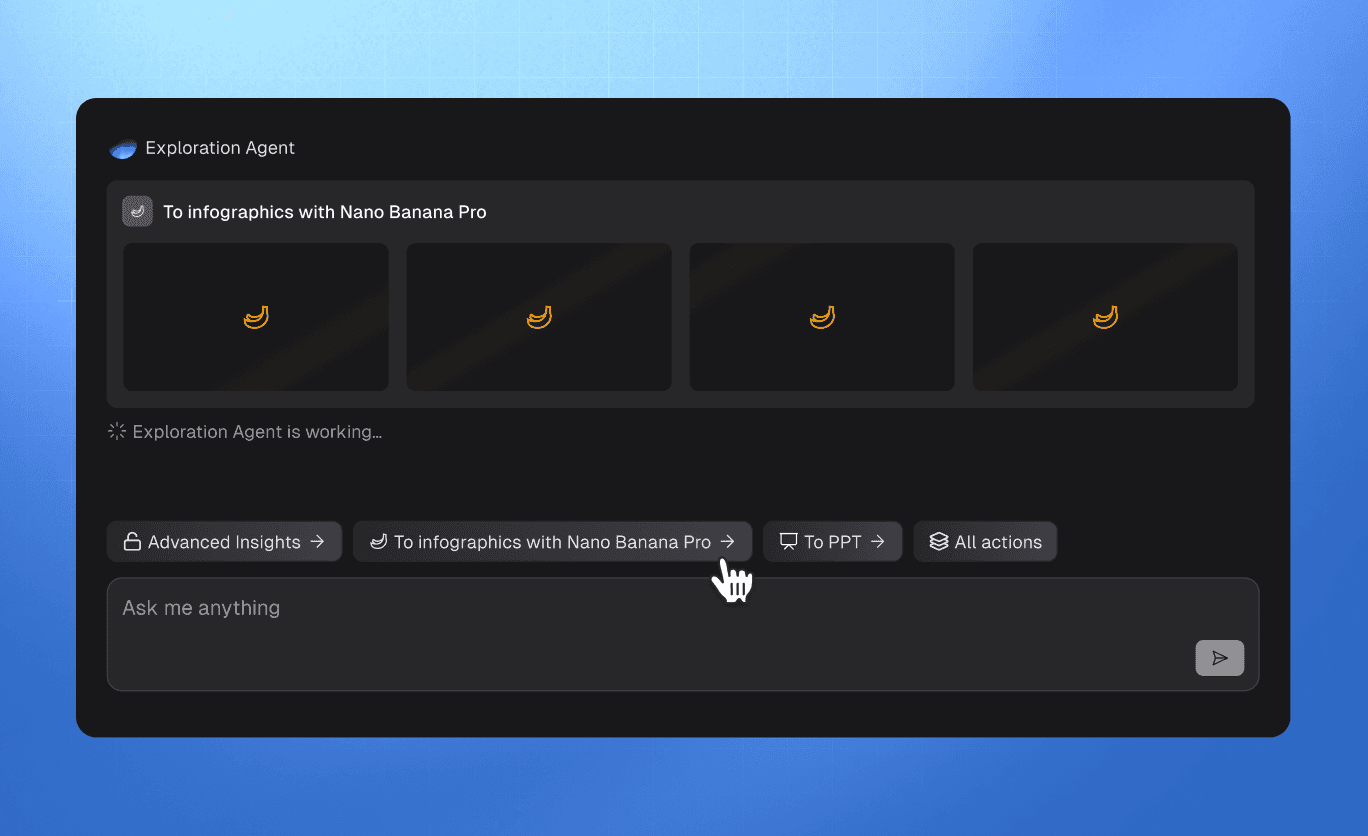
Export as PNG, PDF or PPT slide

ready for inbox, deck or Slack.

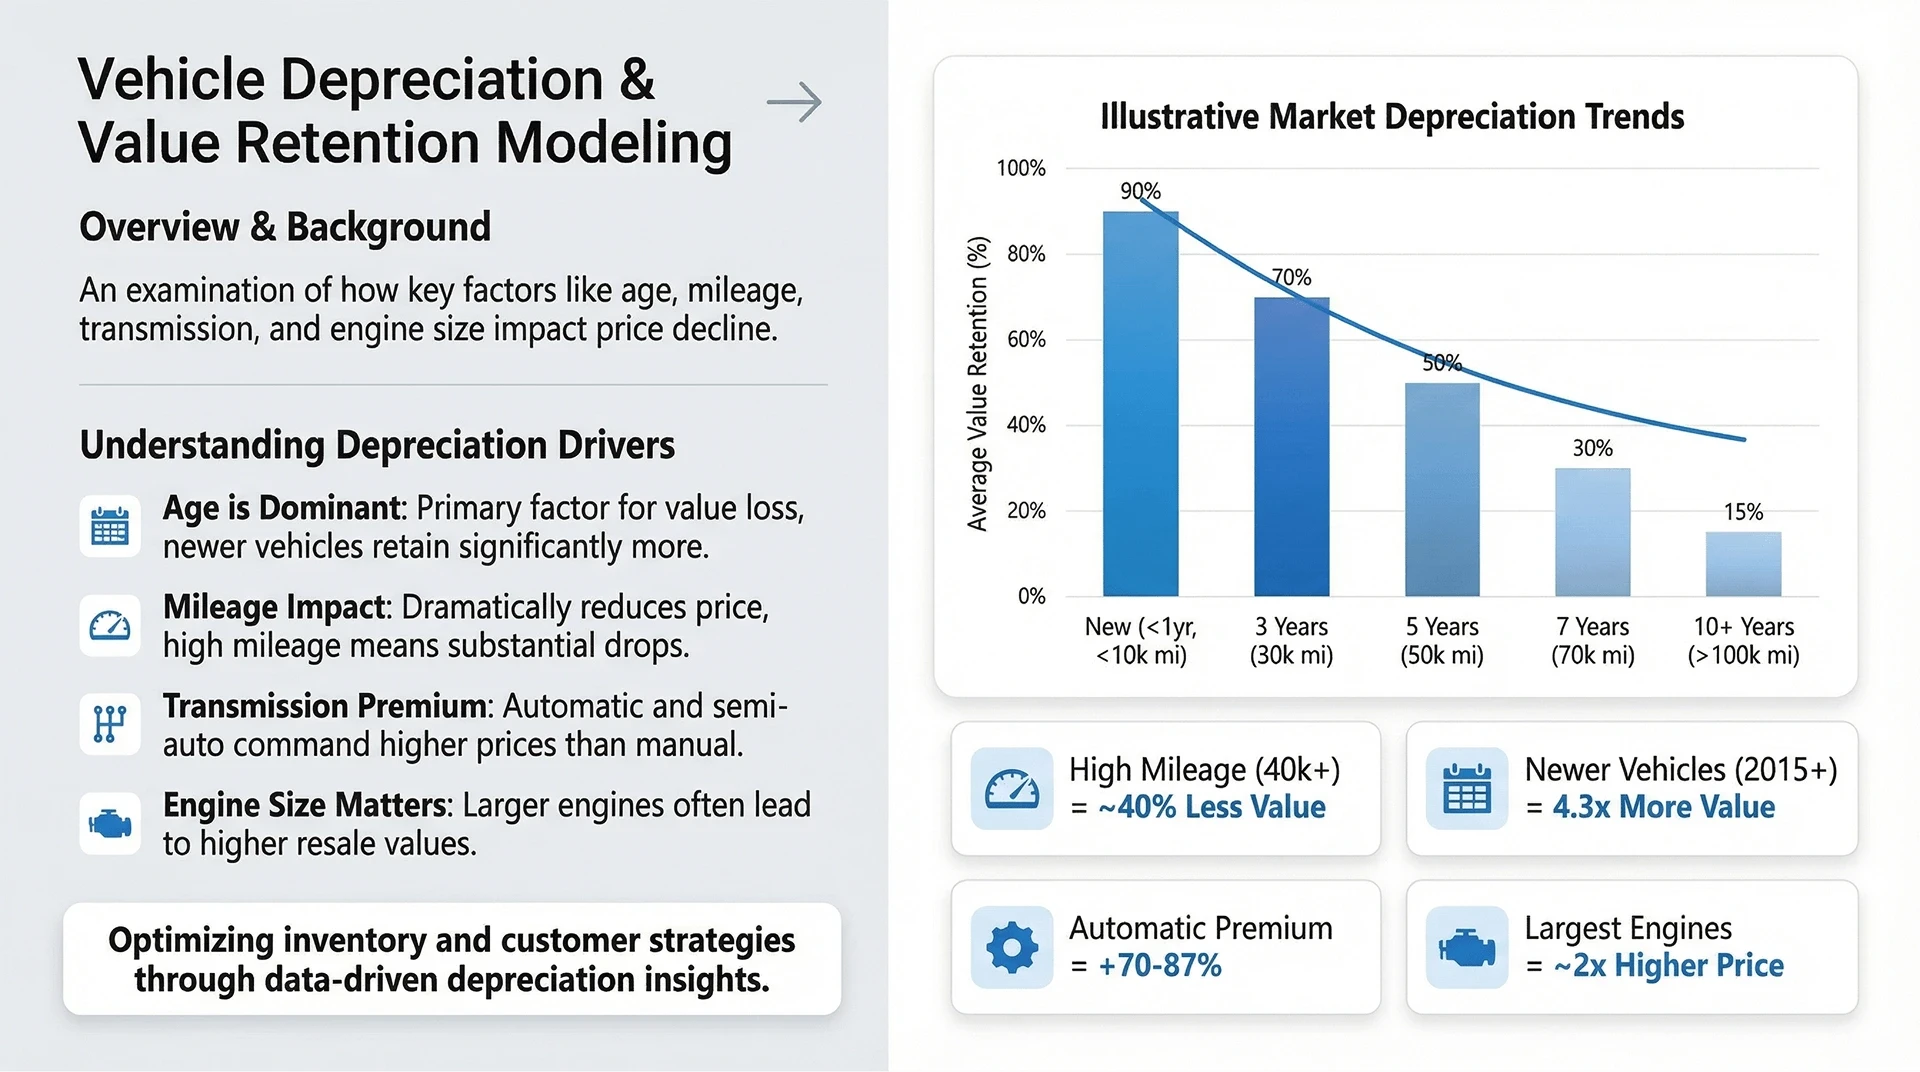
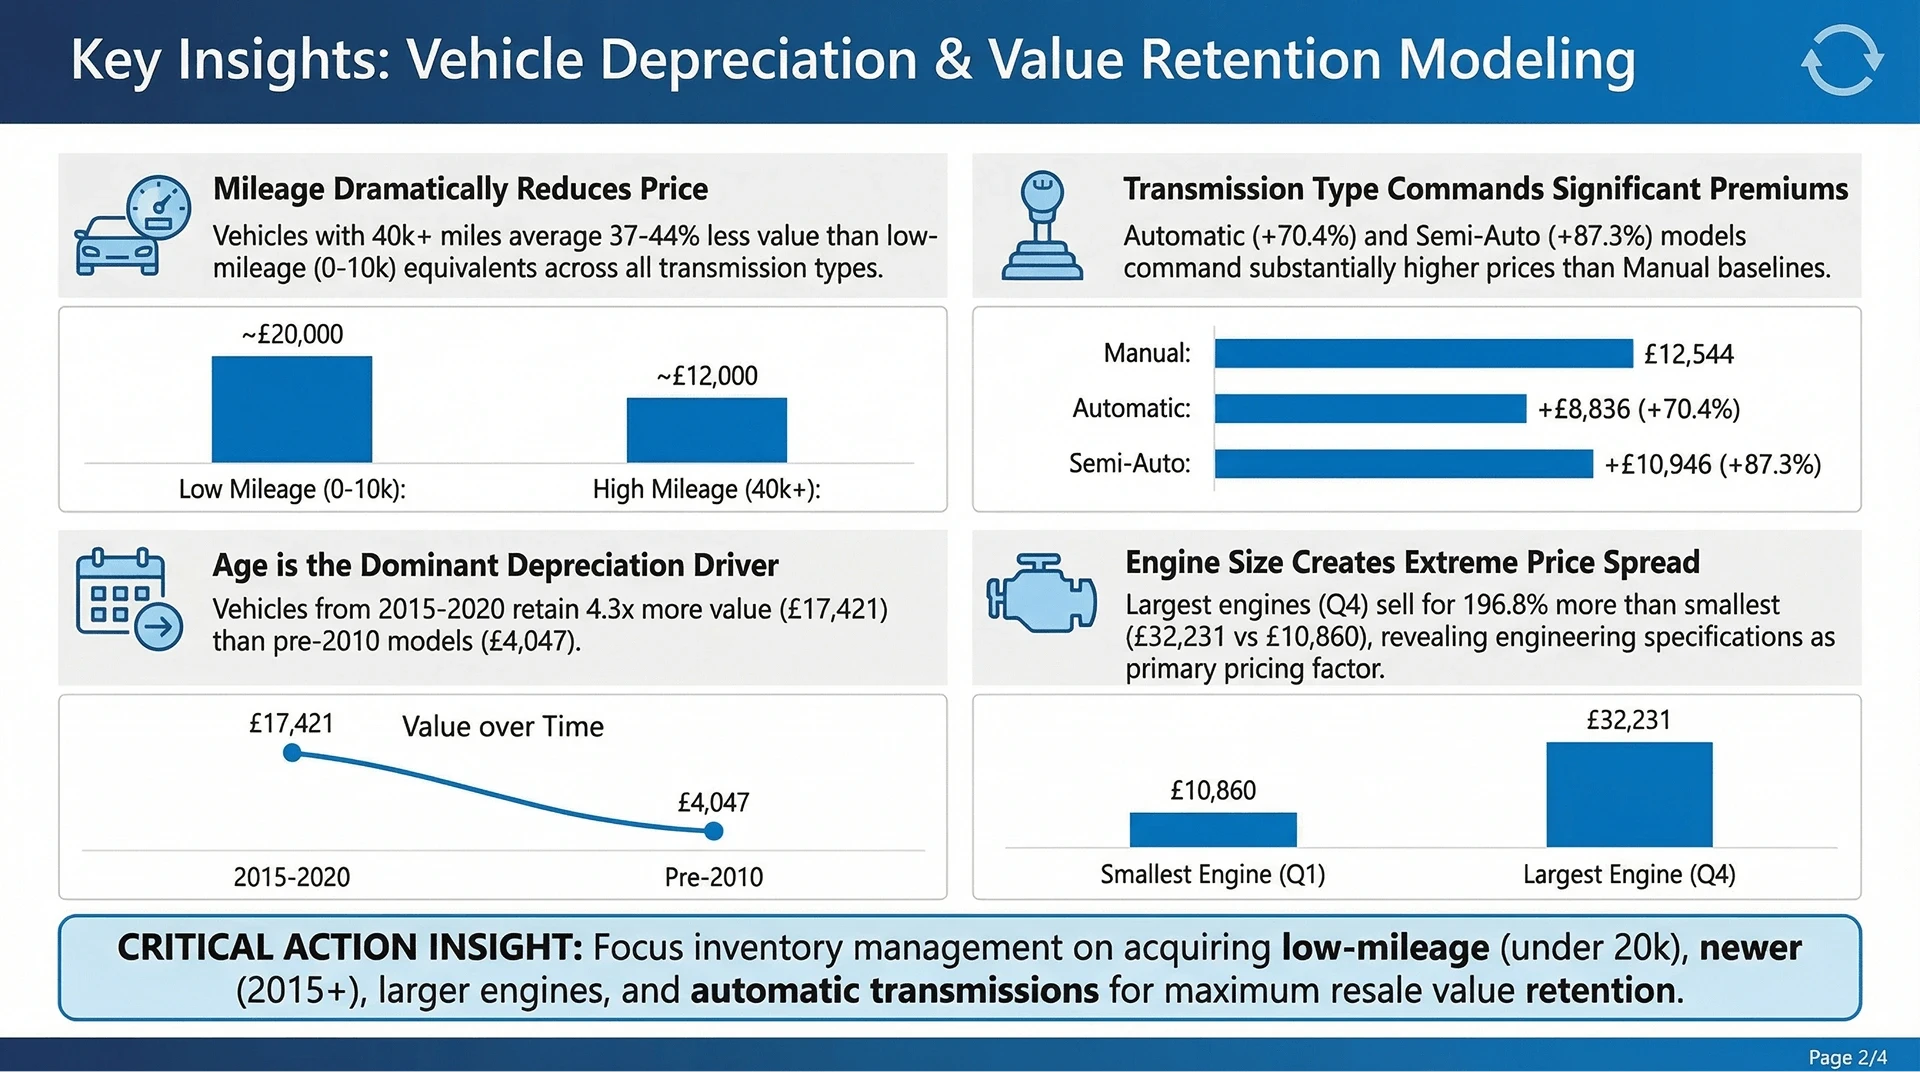
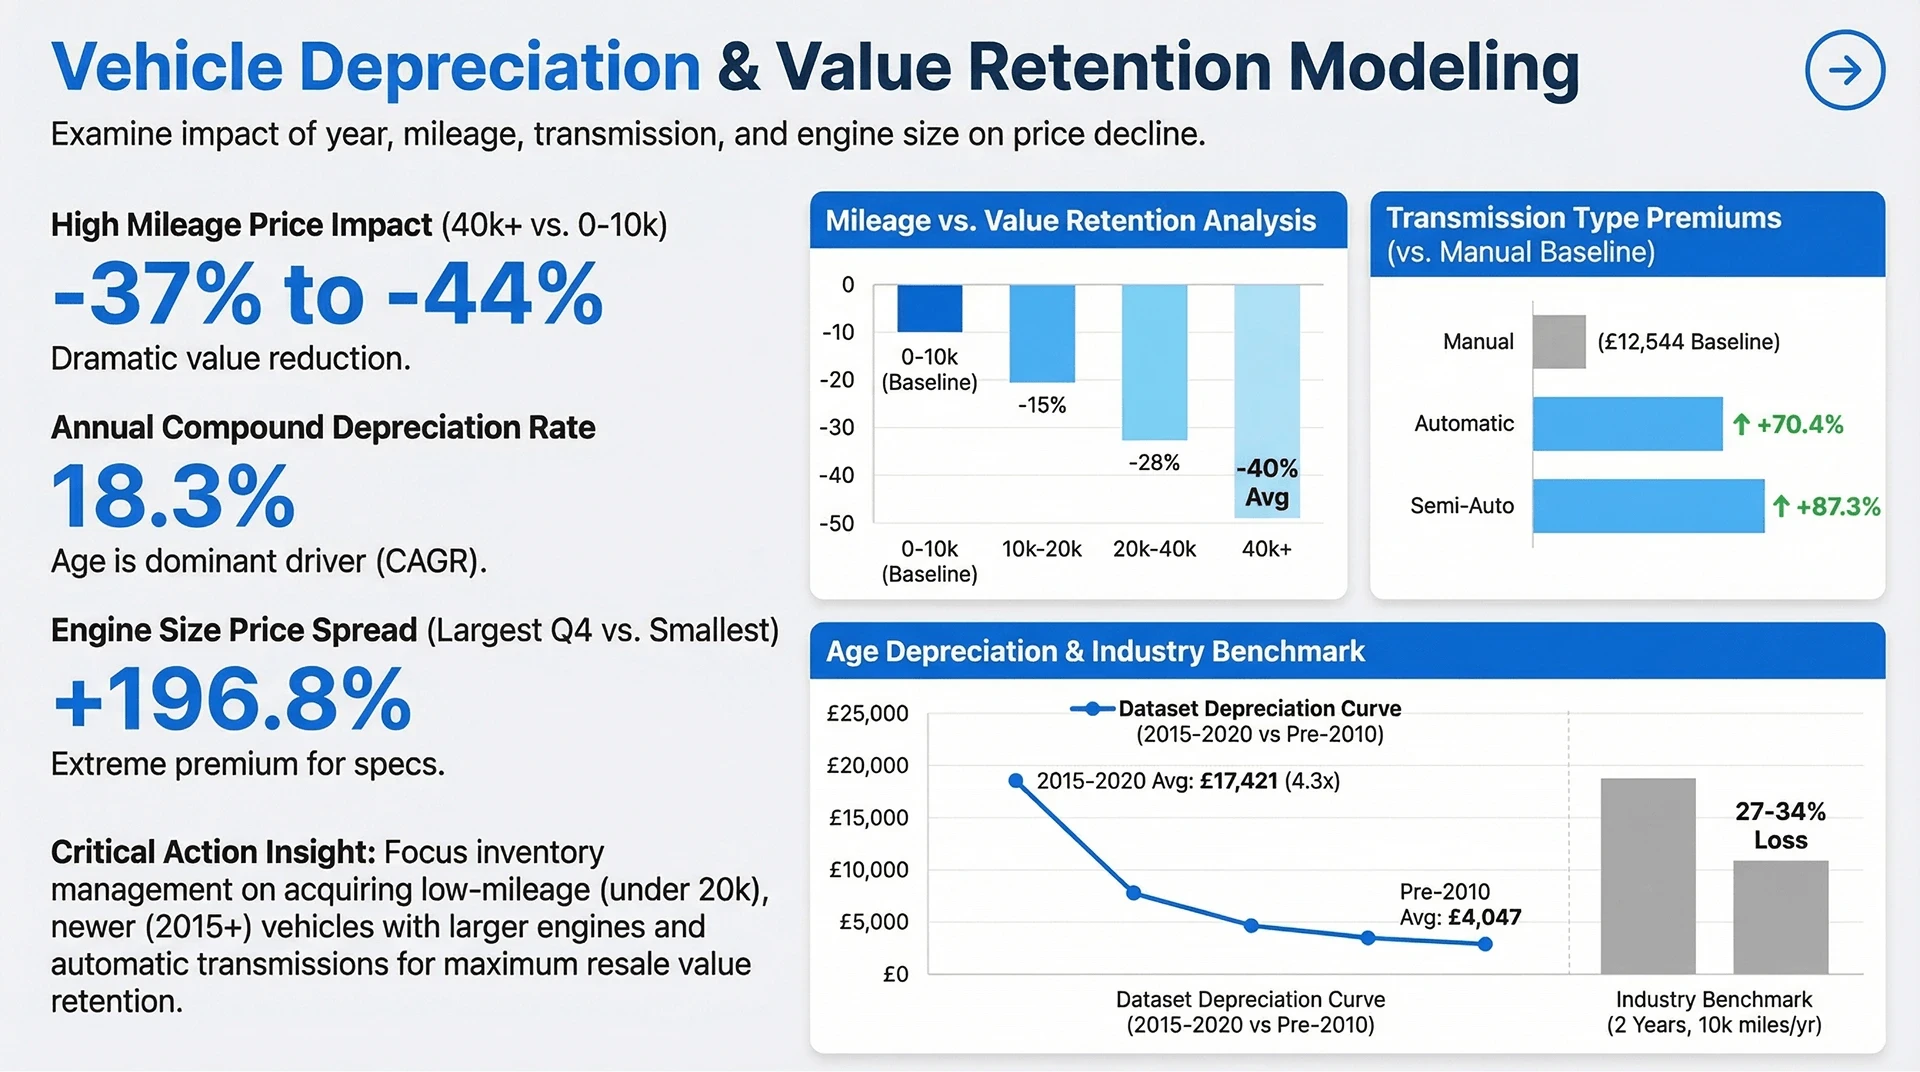
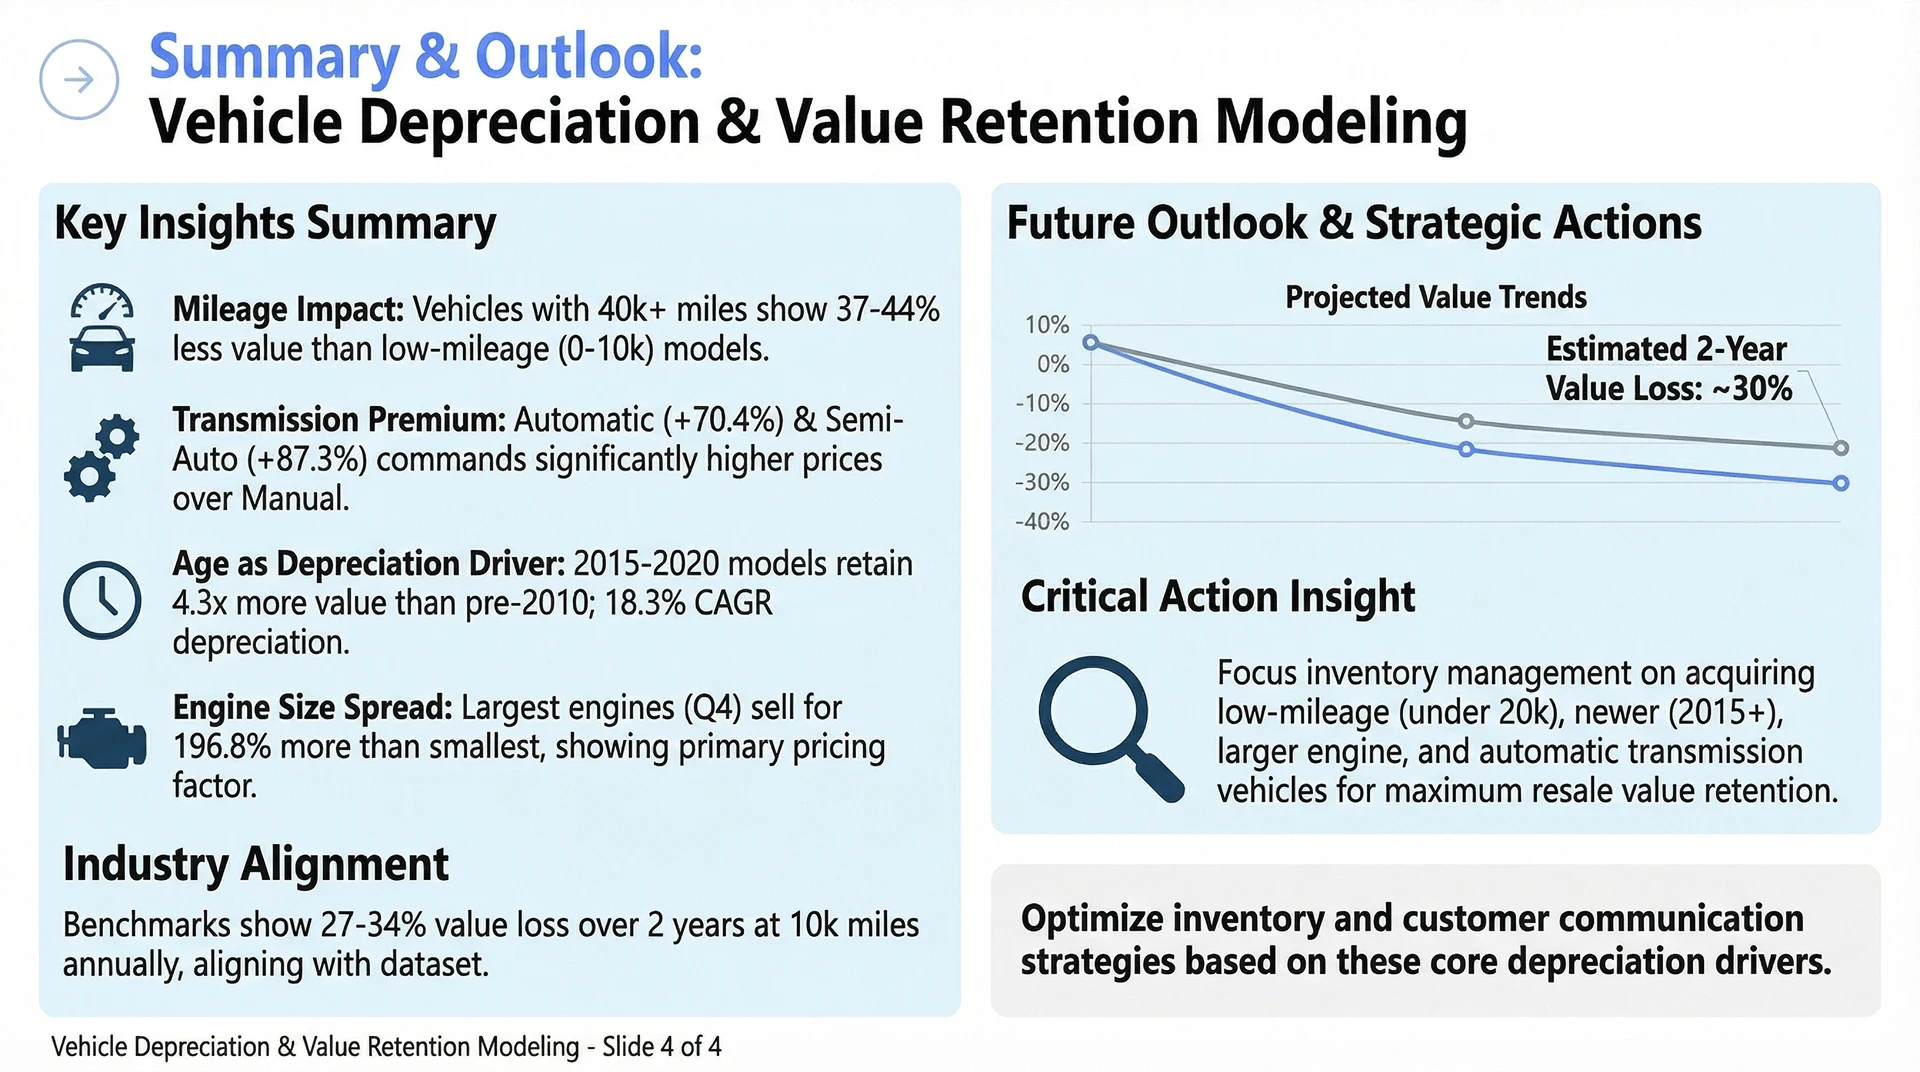
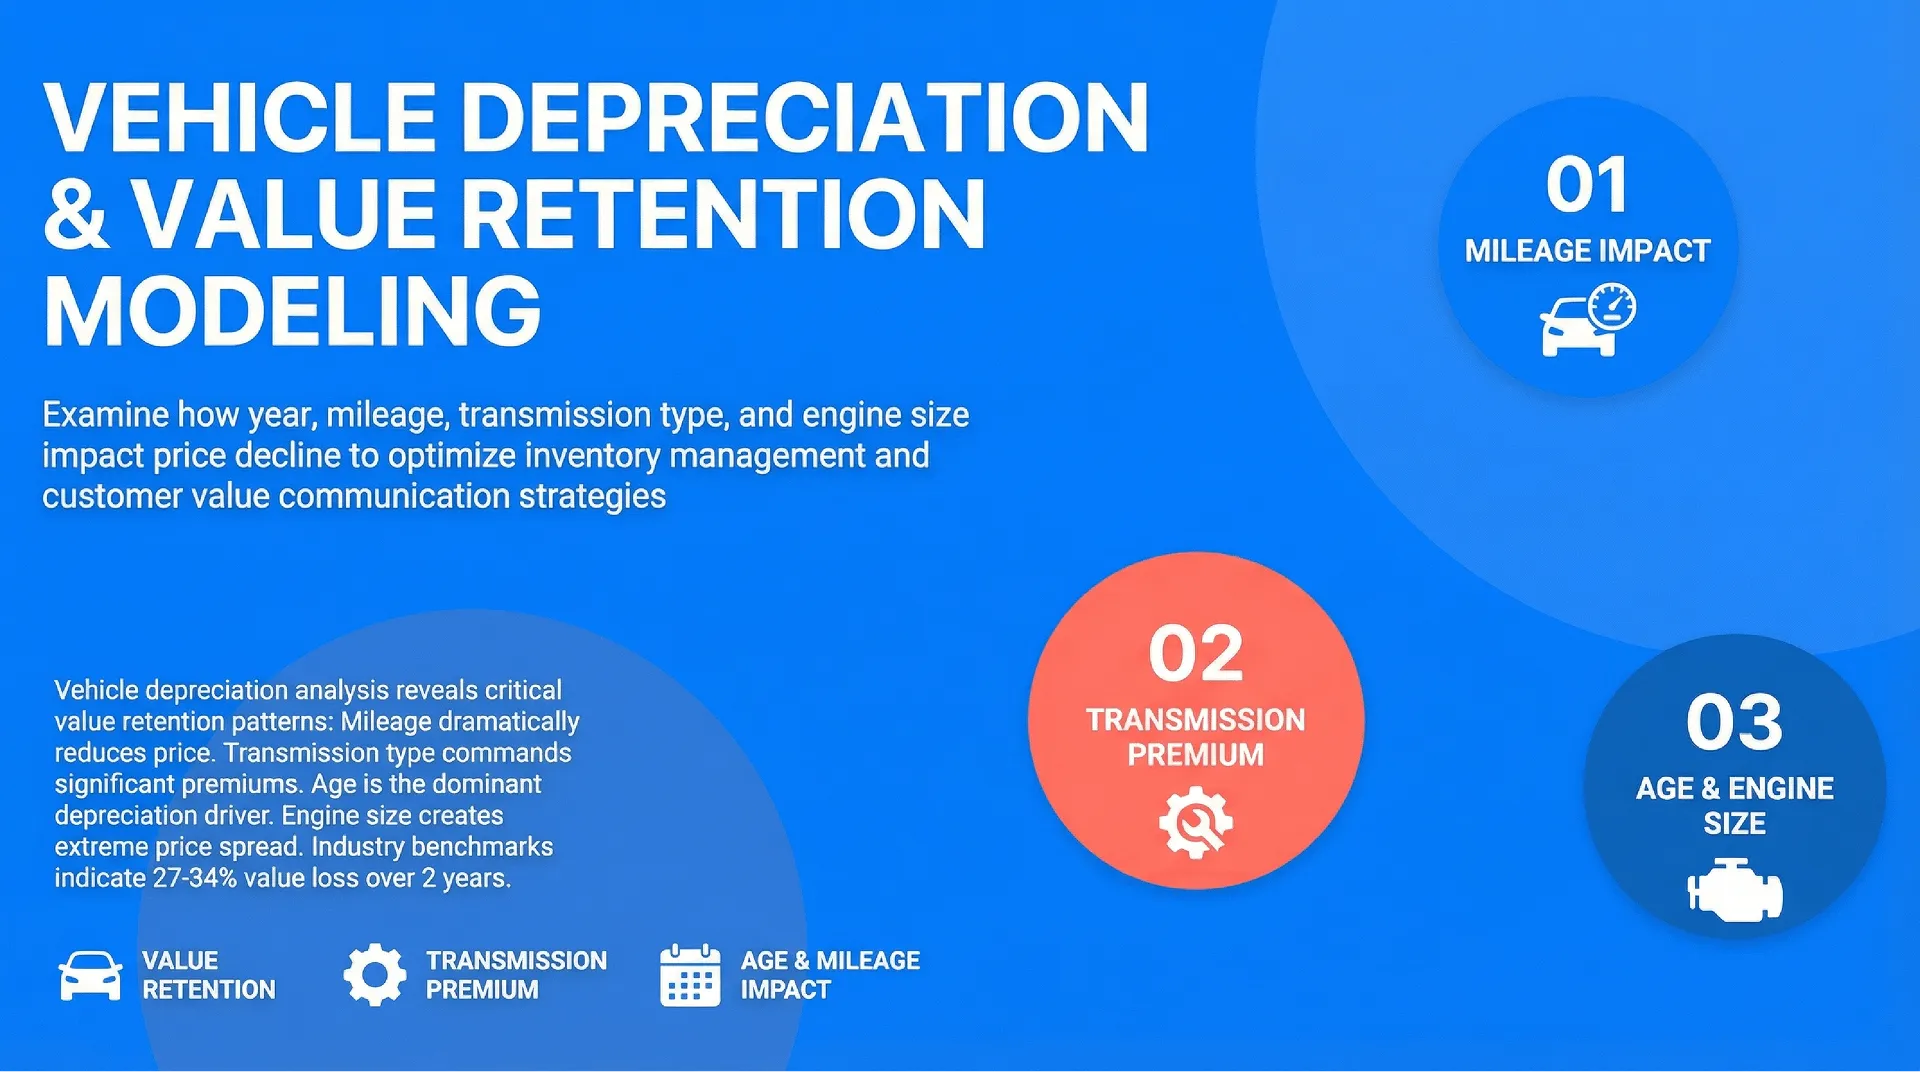
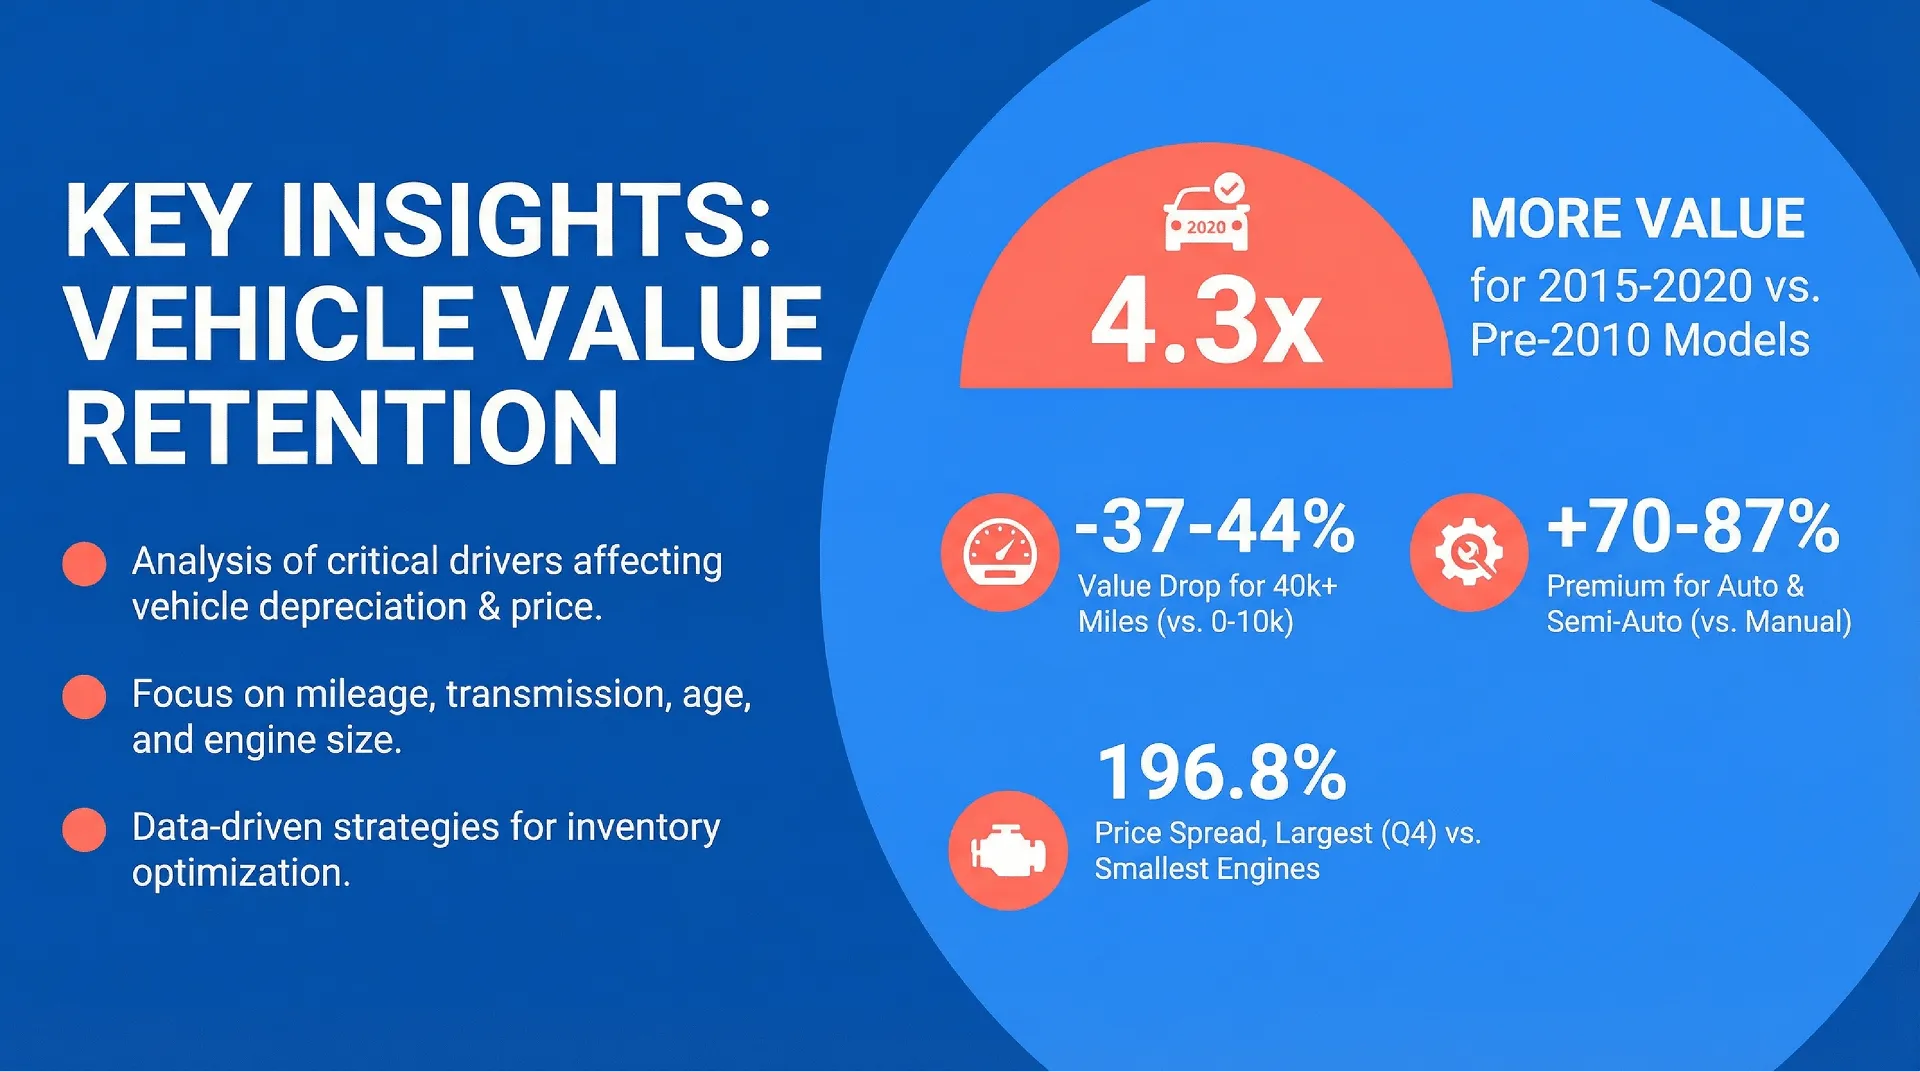
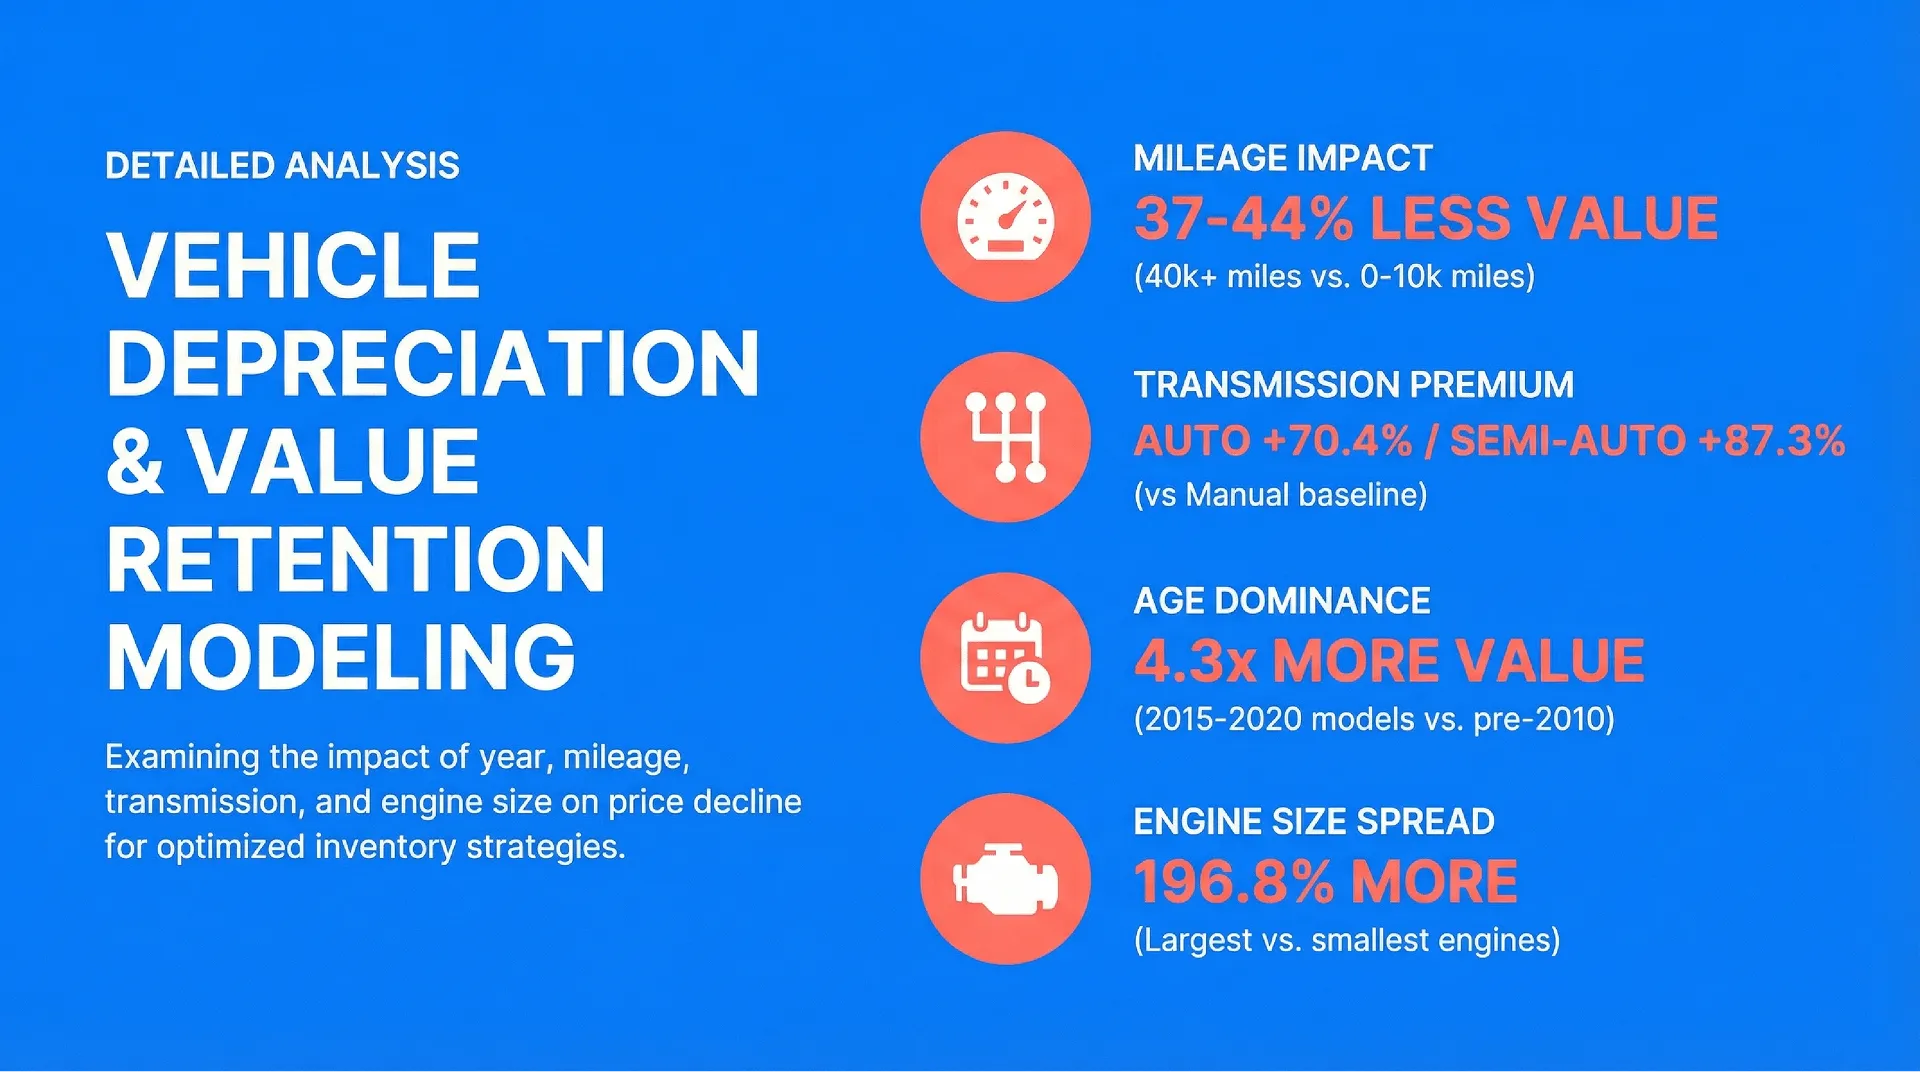
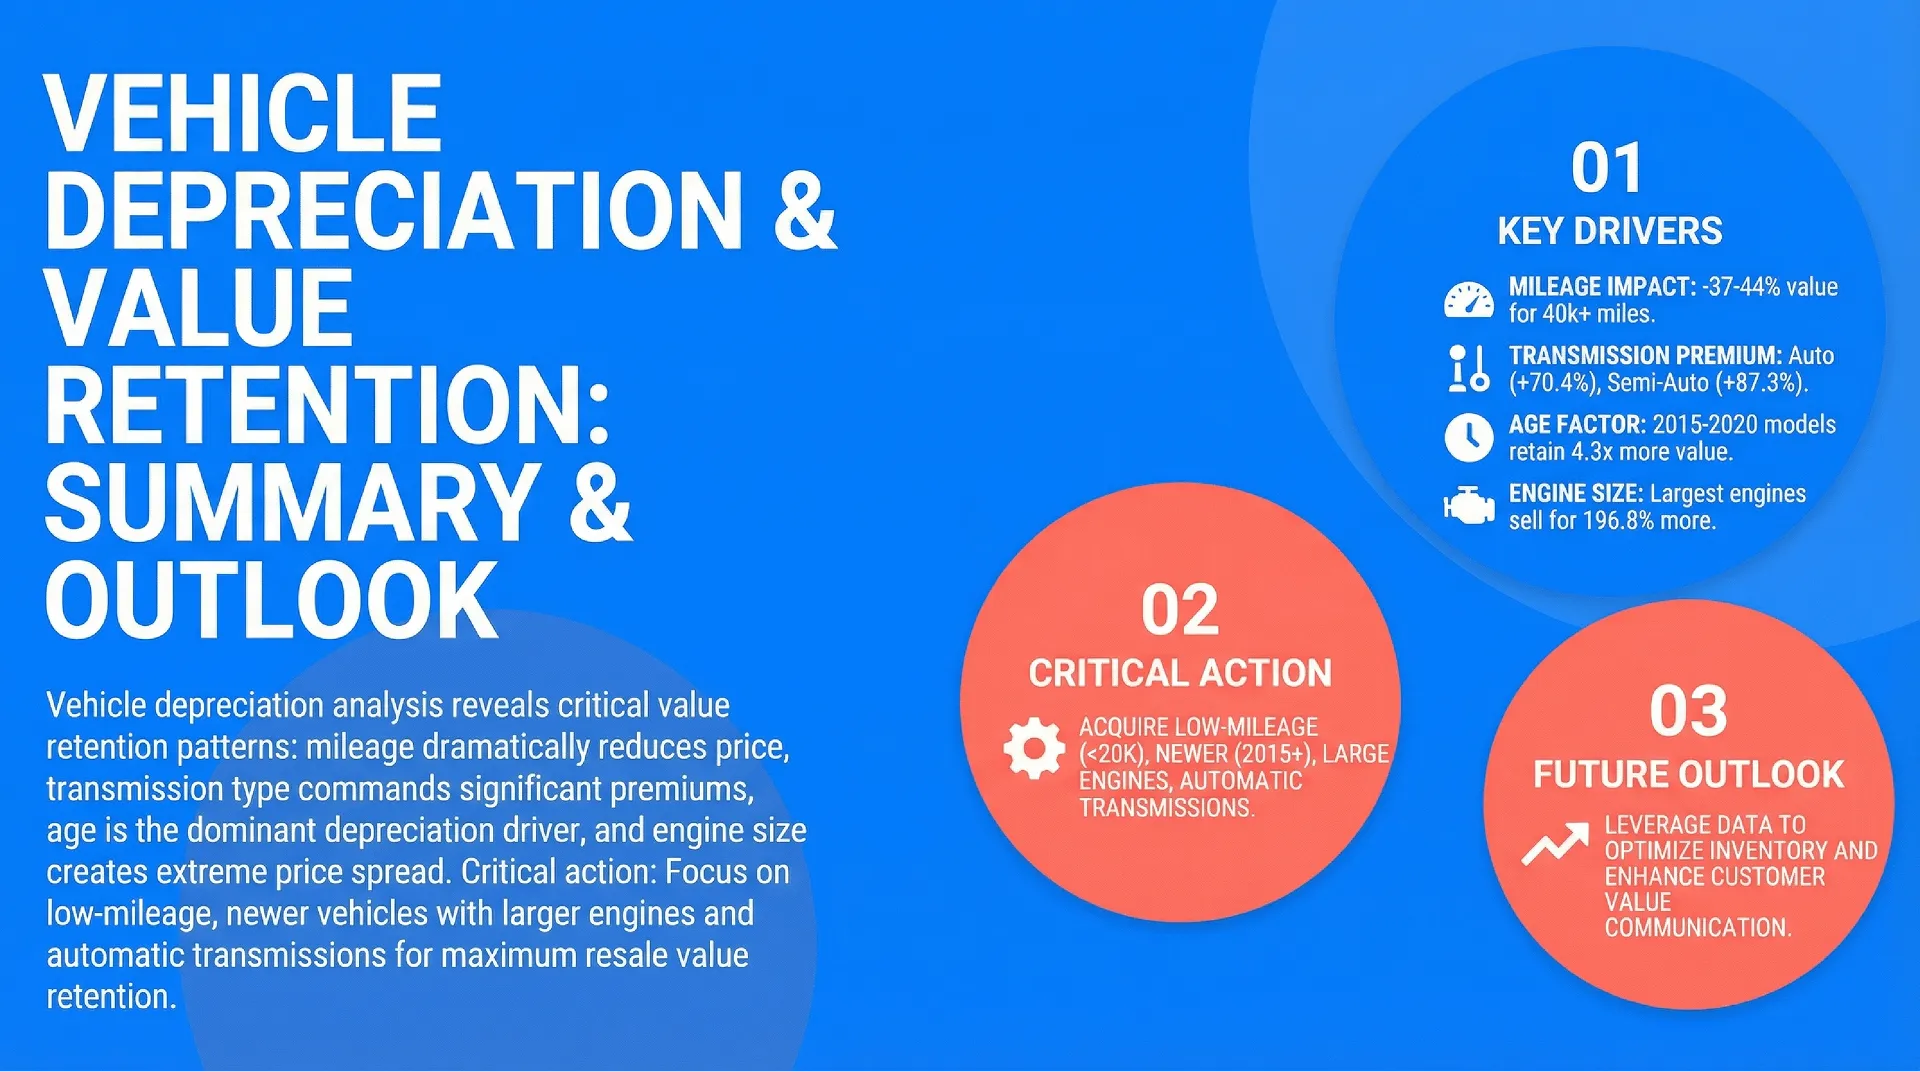
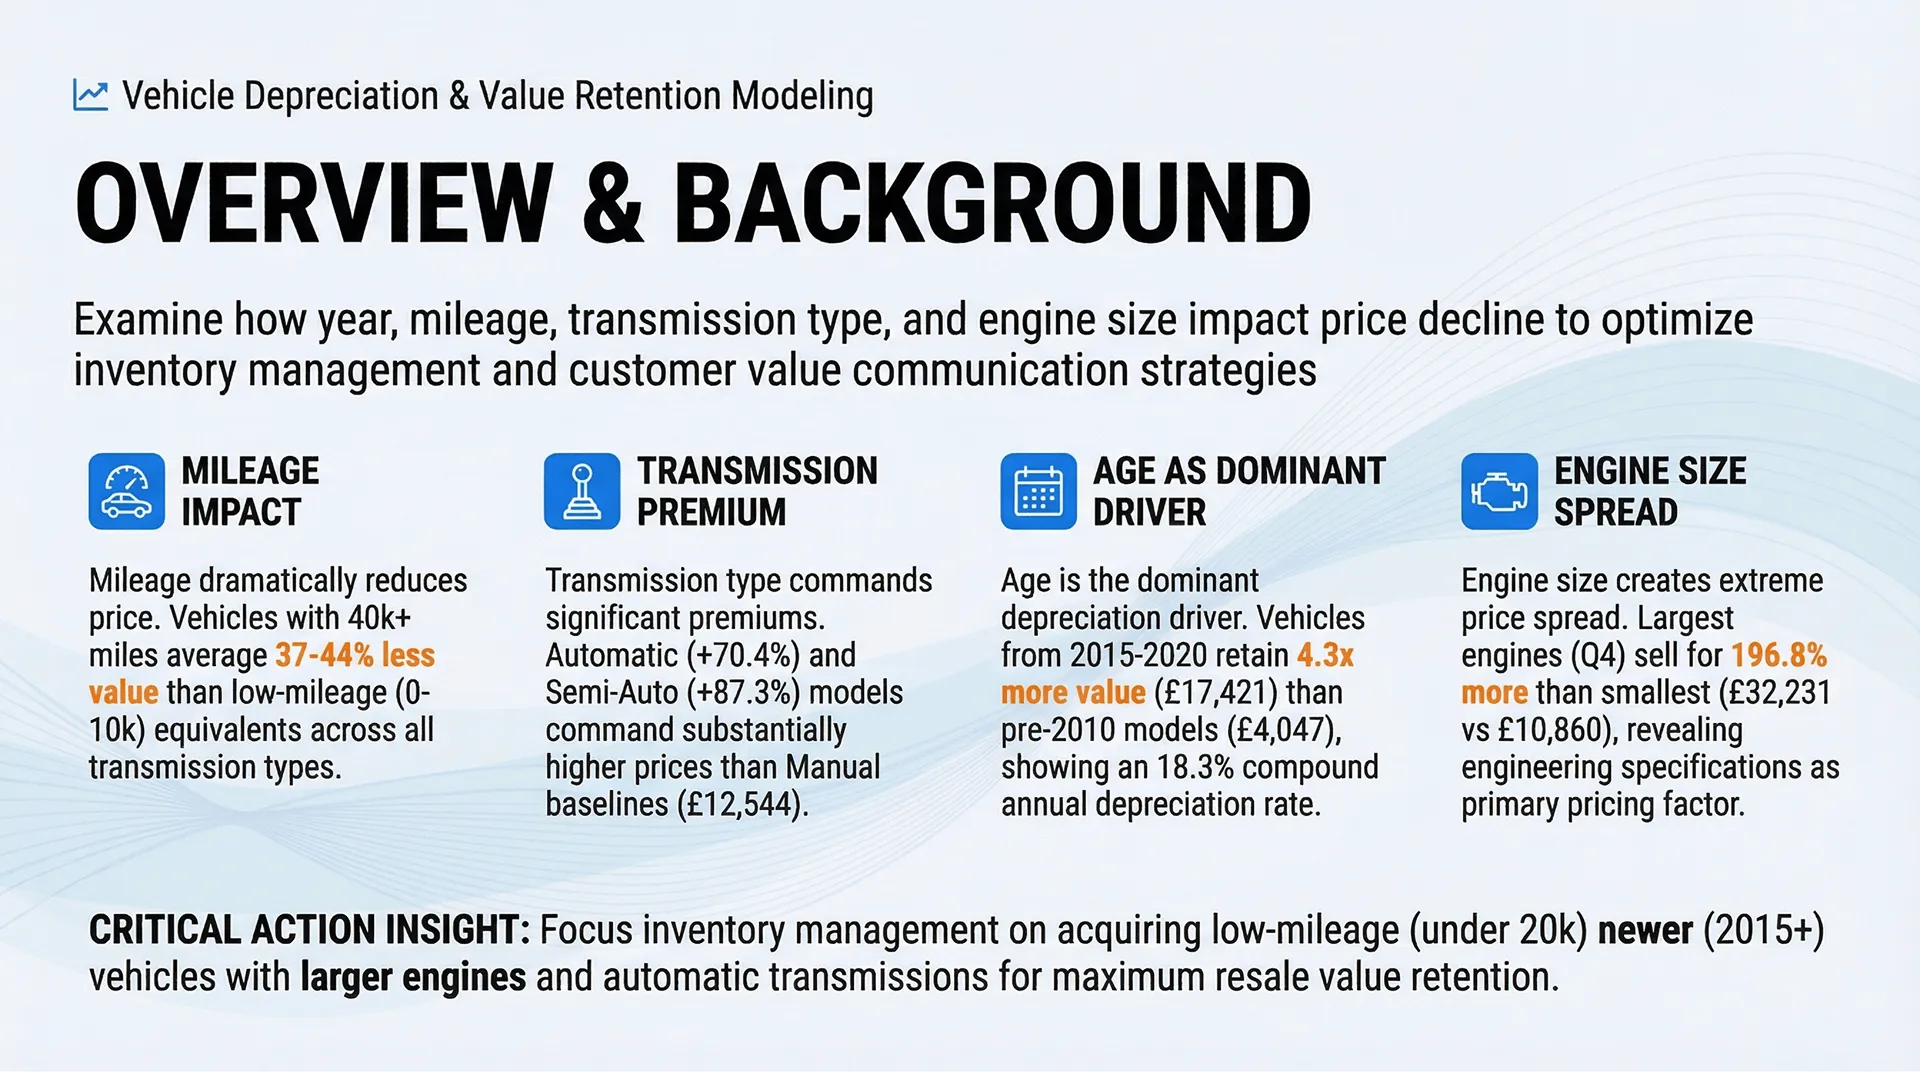
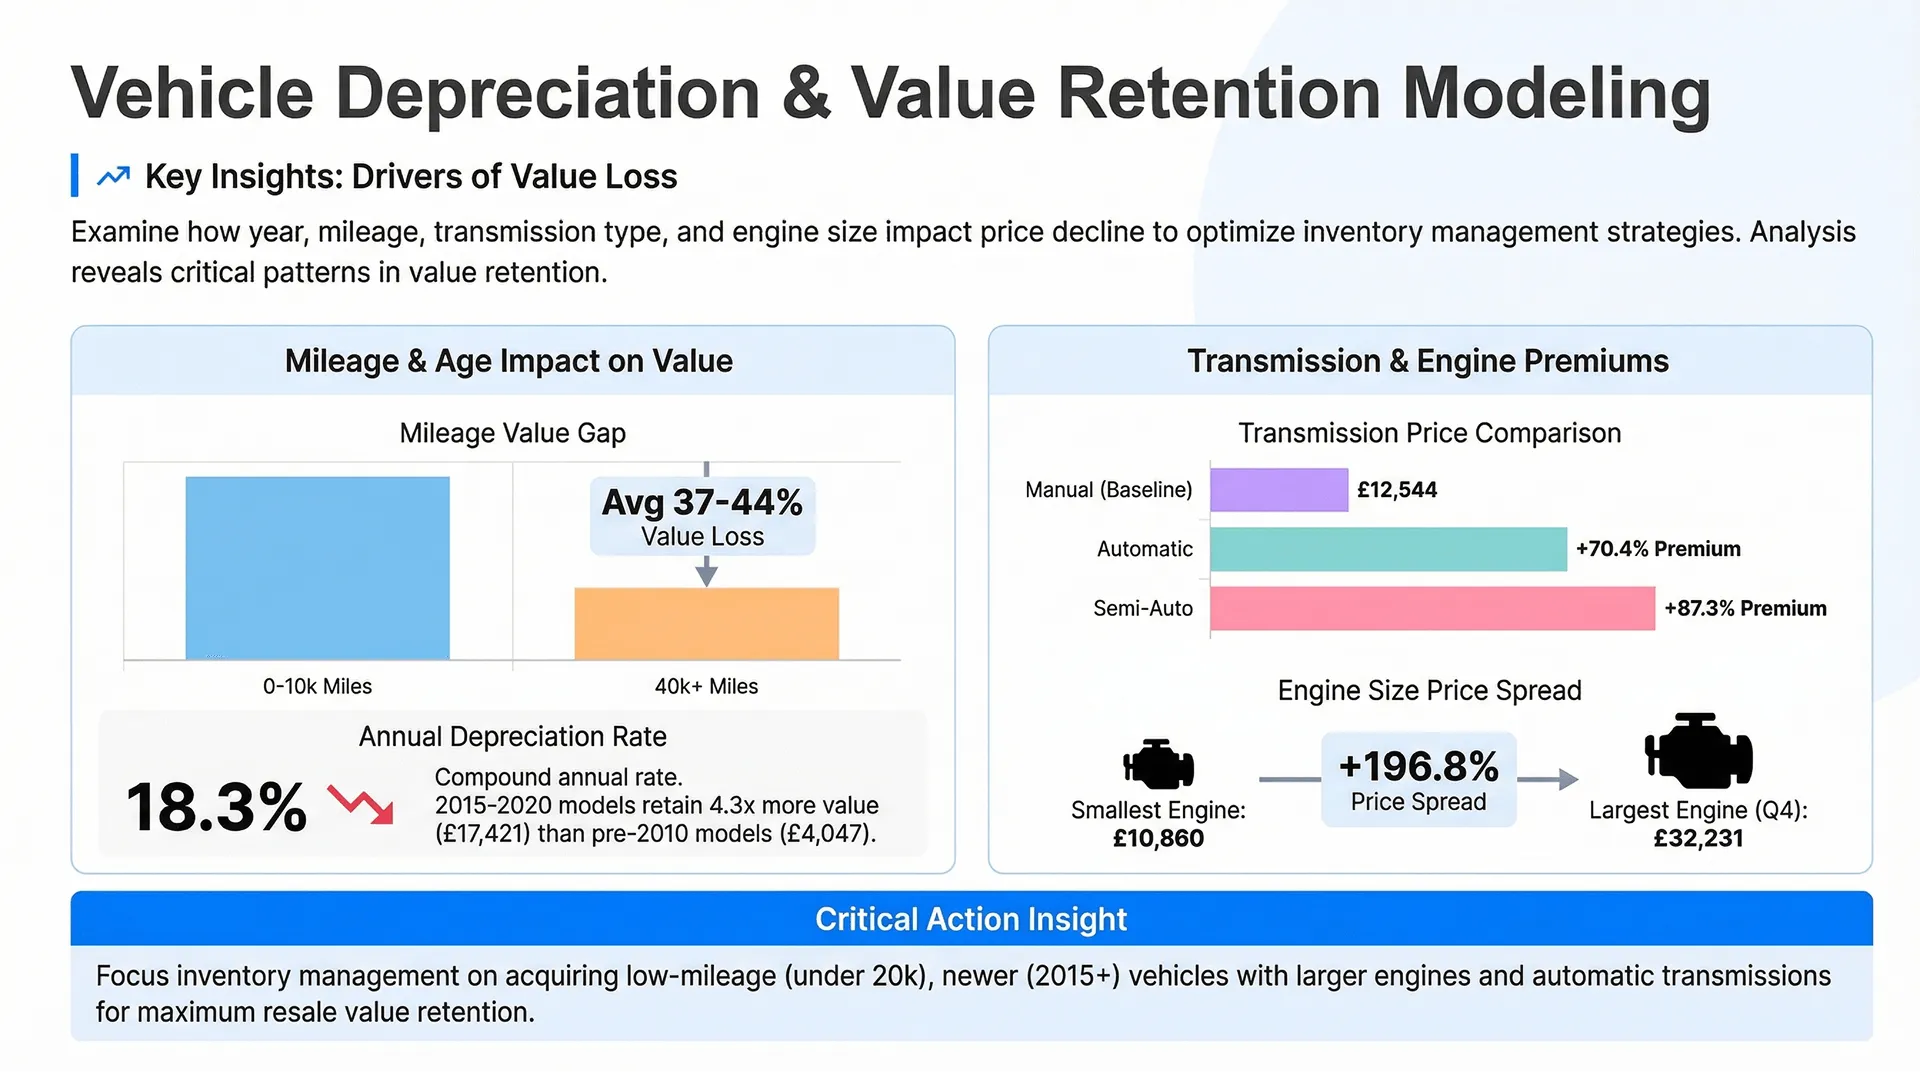
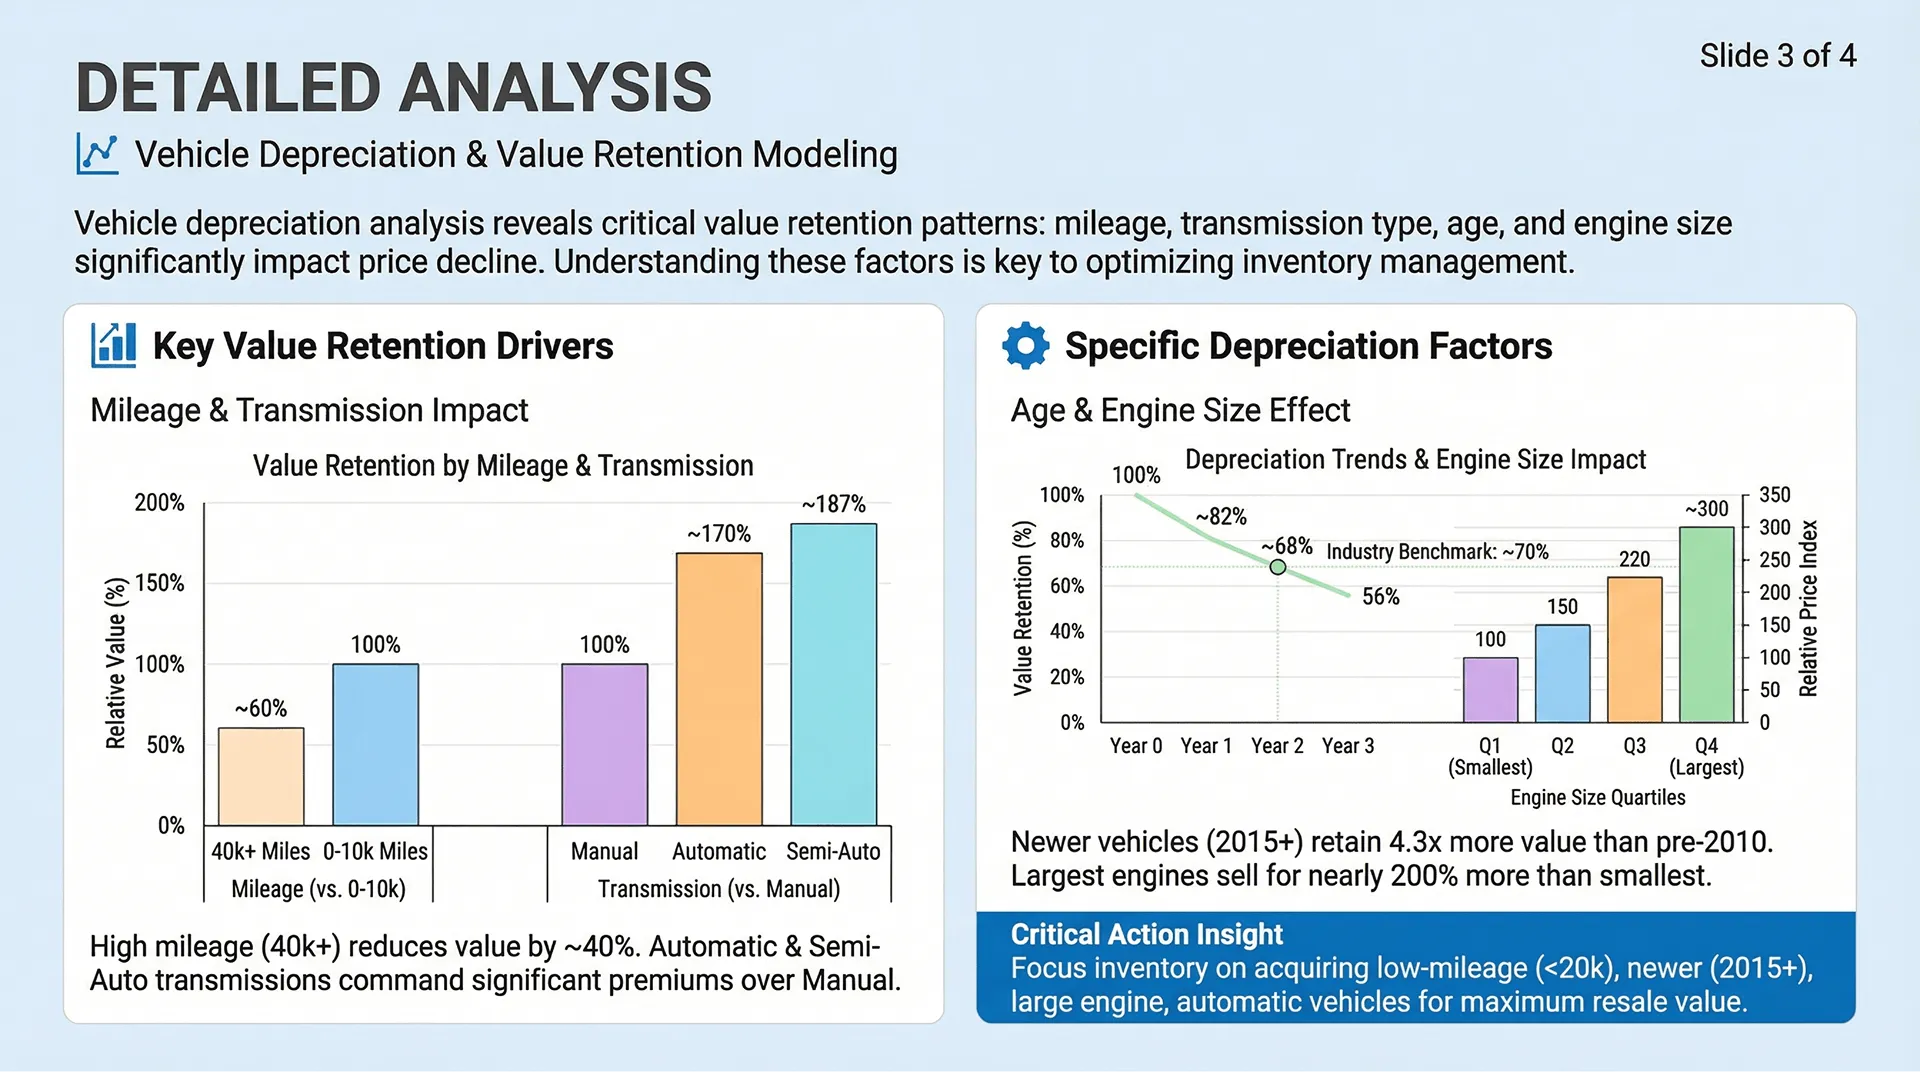
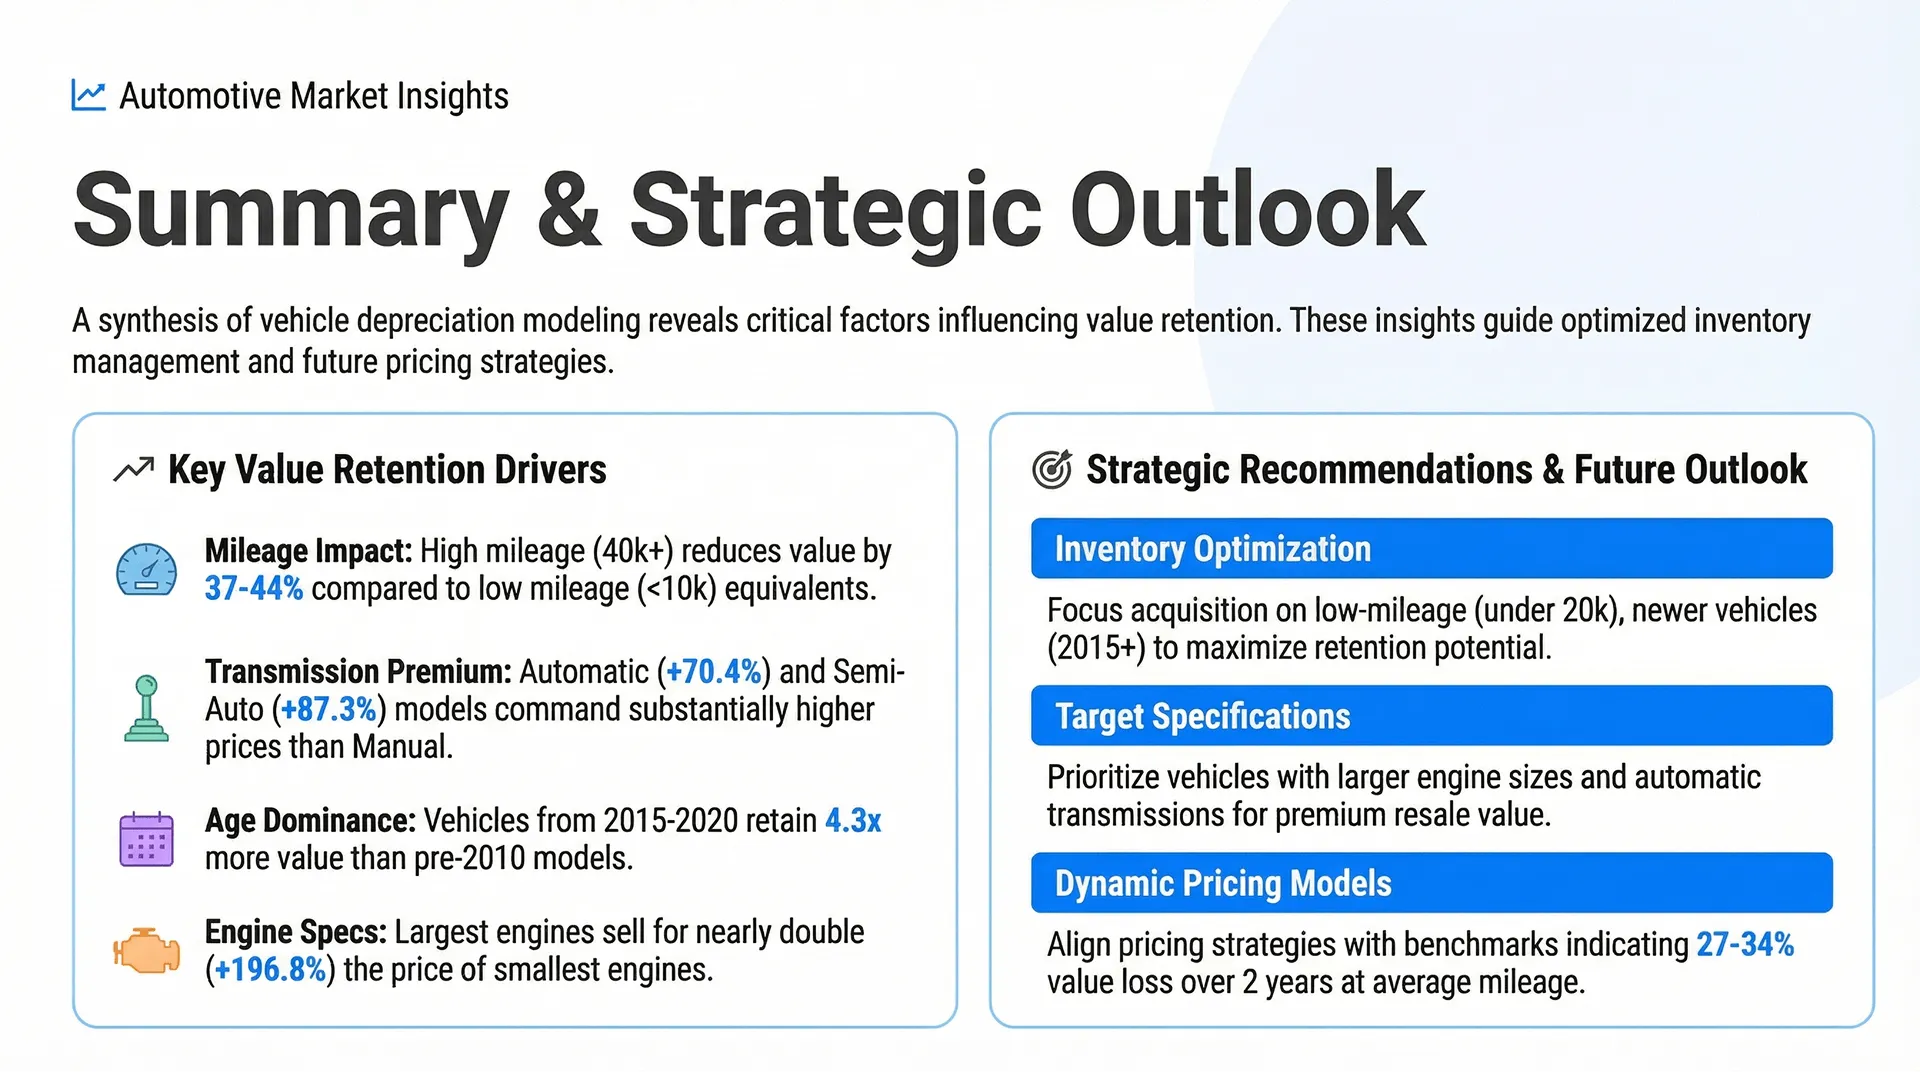
Generated Slides by Nano Banana Pro

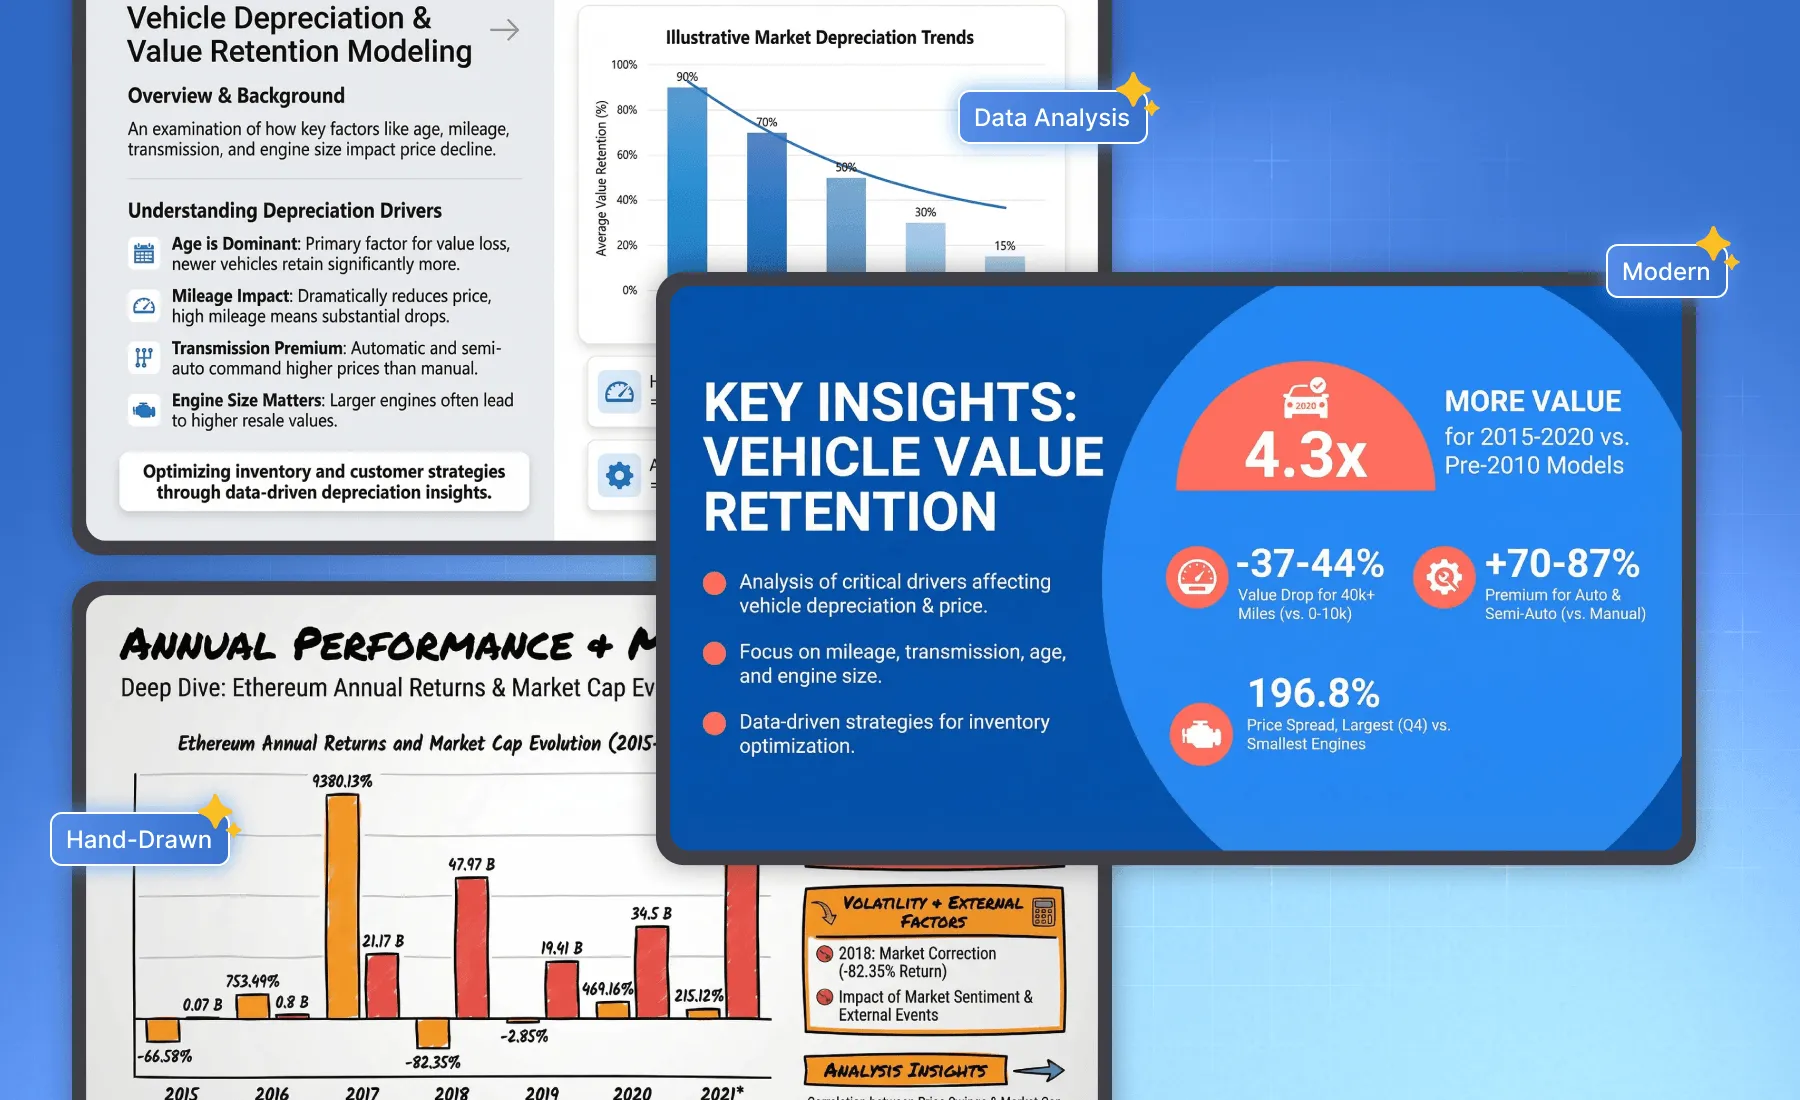
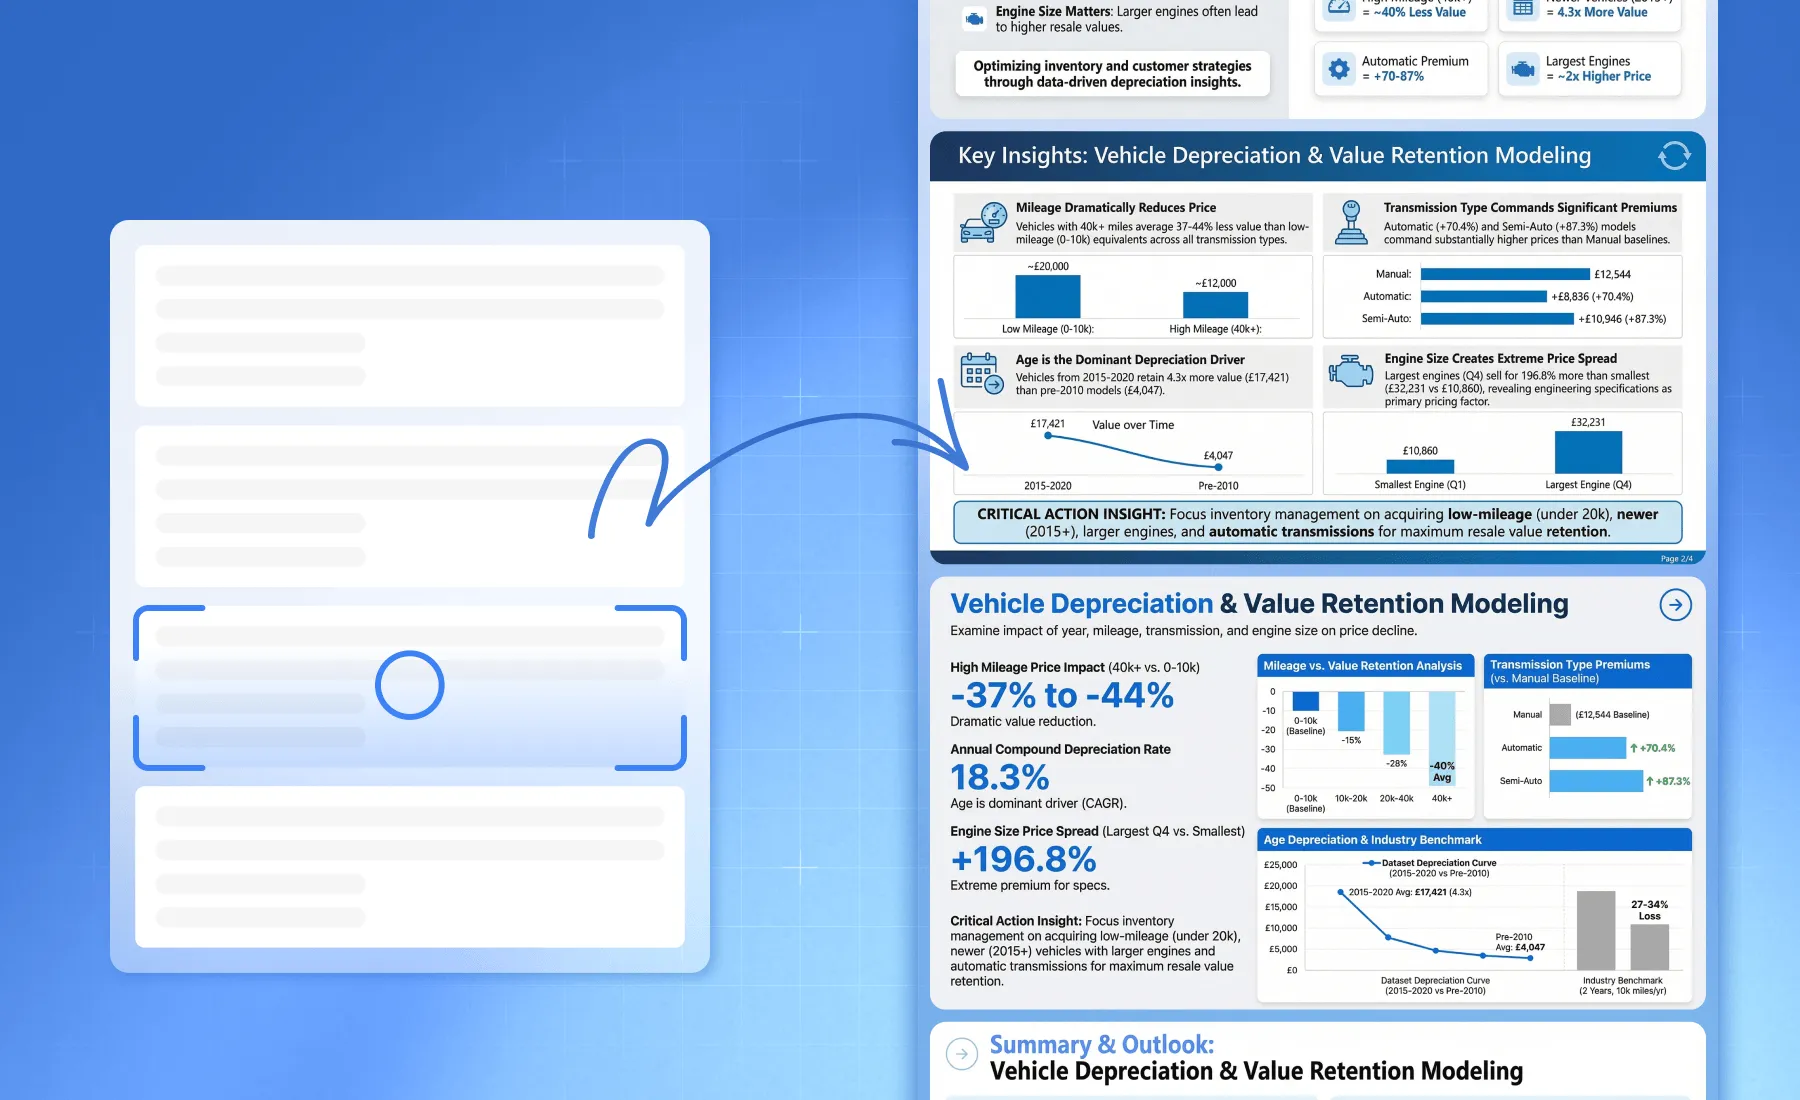
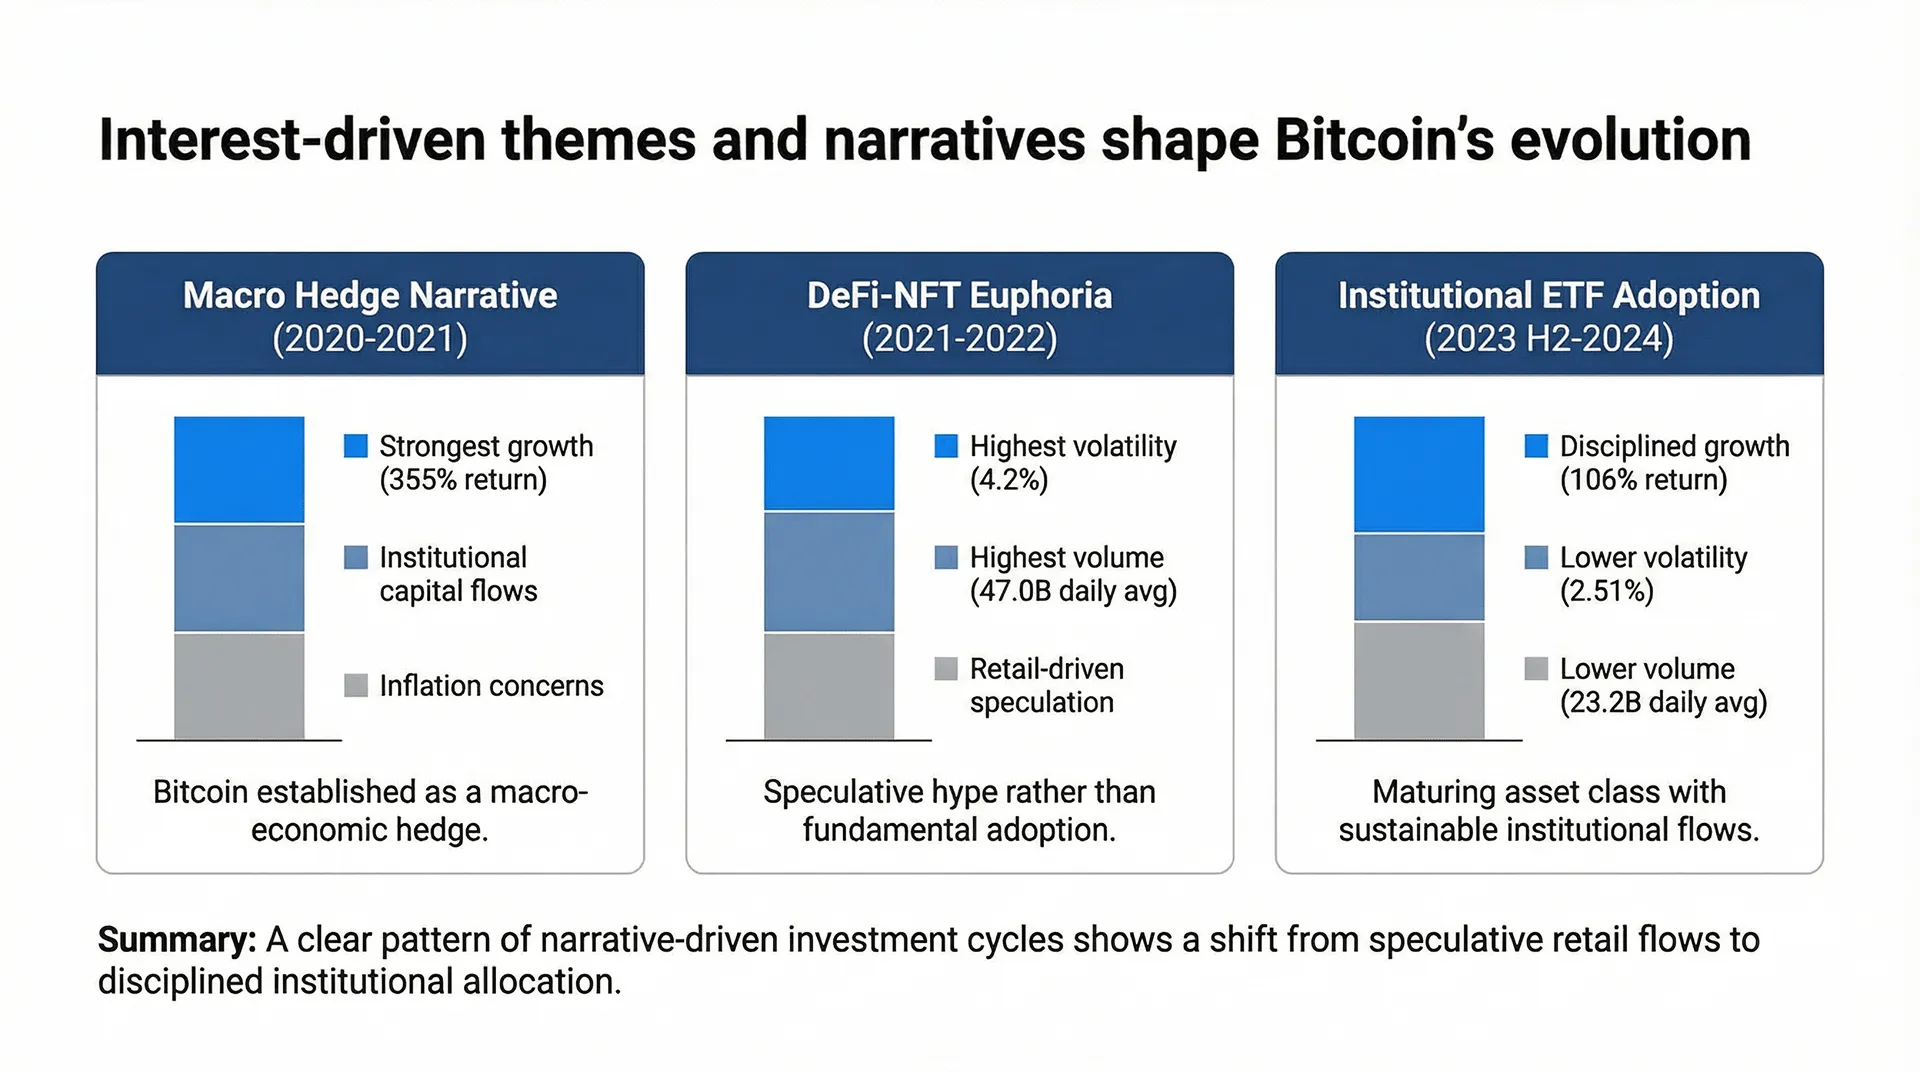
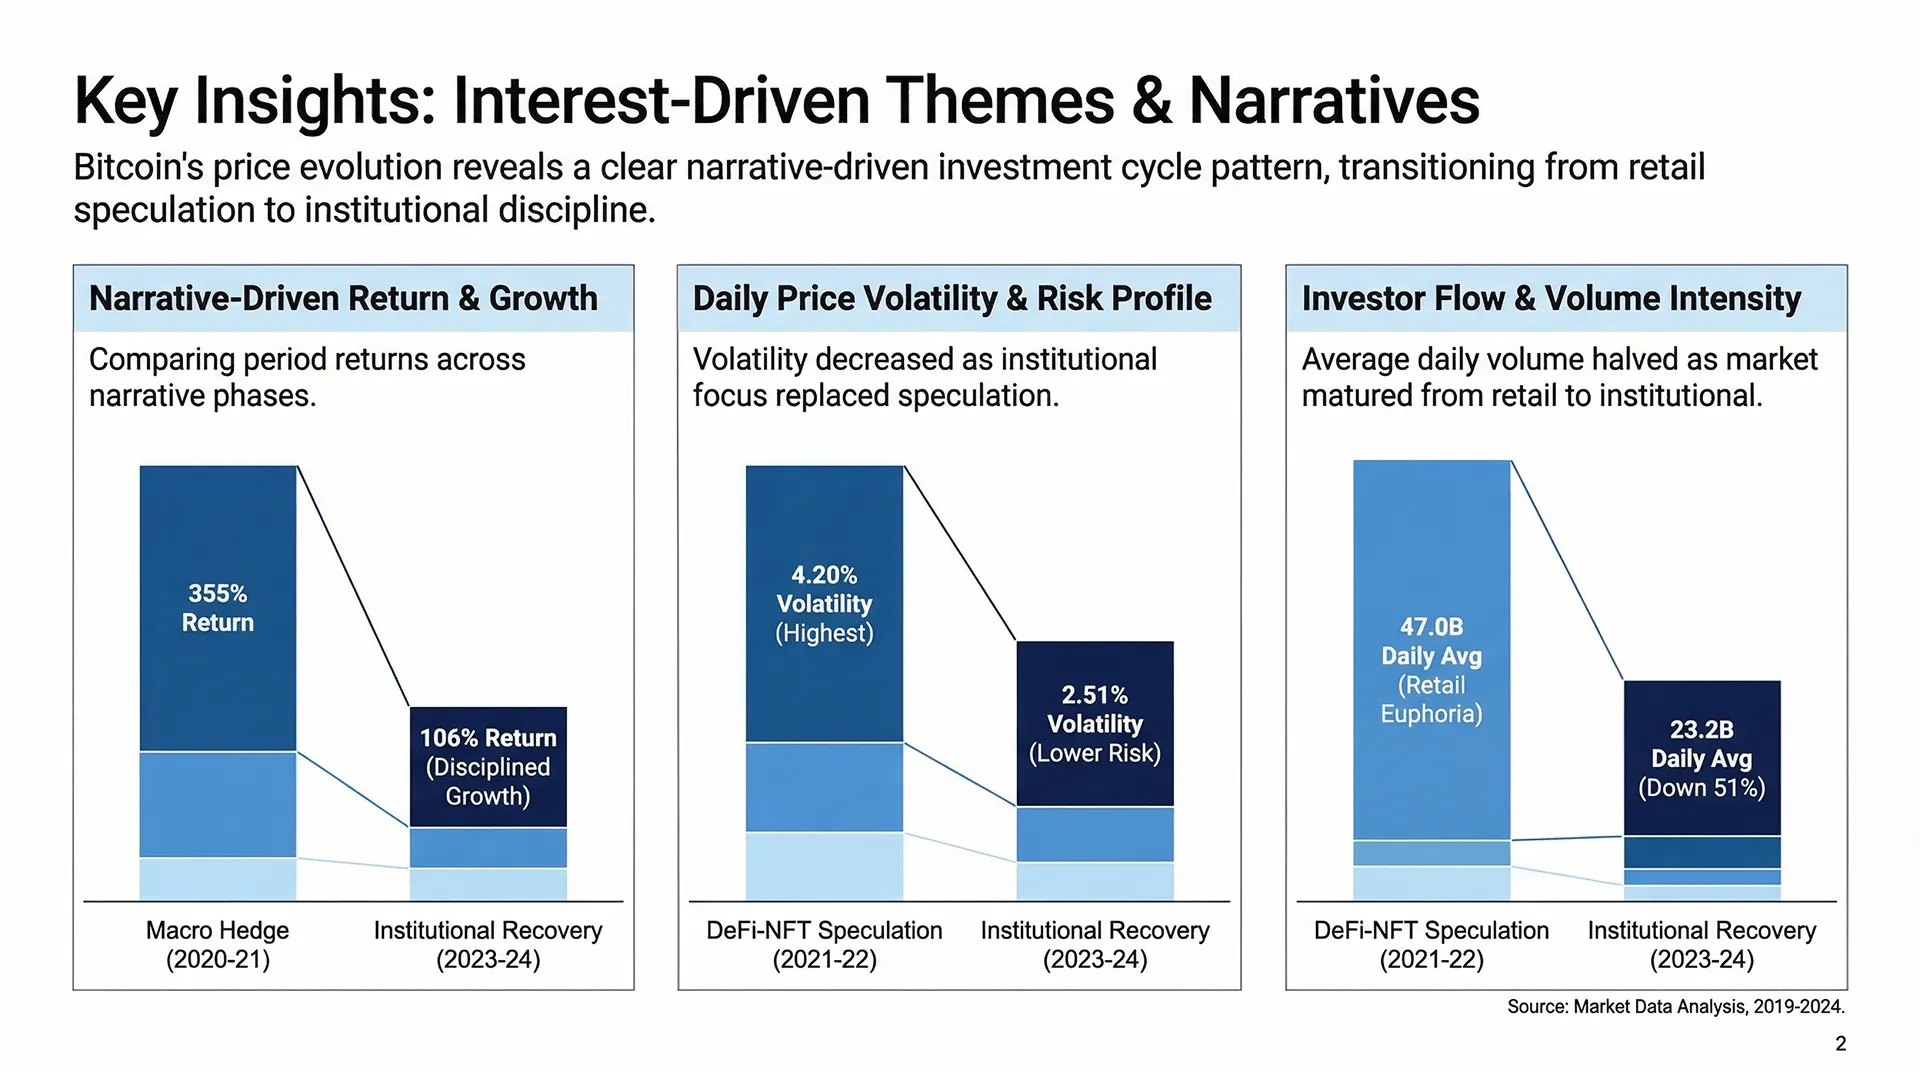
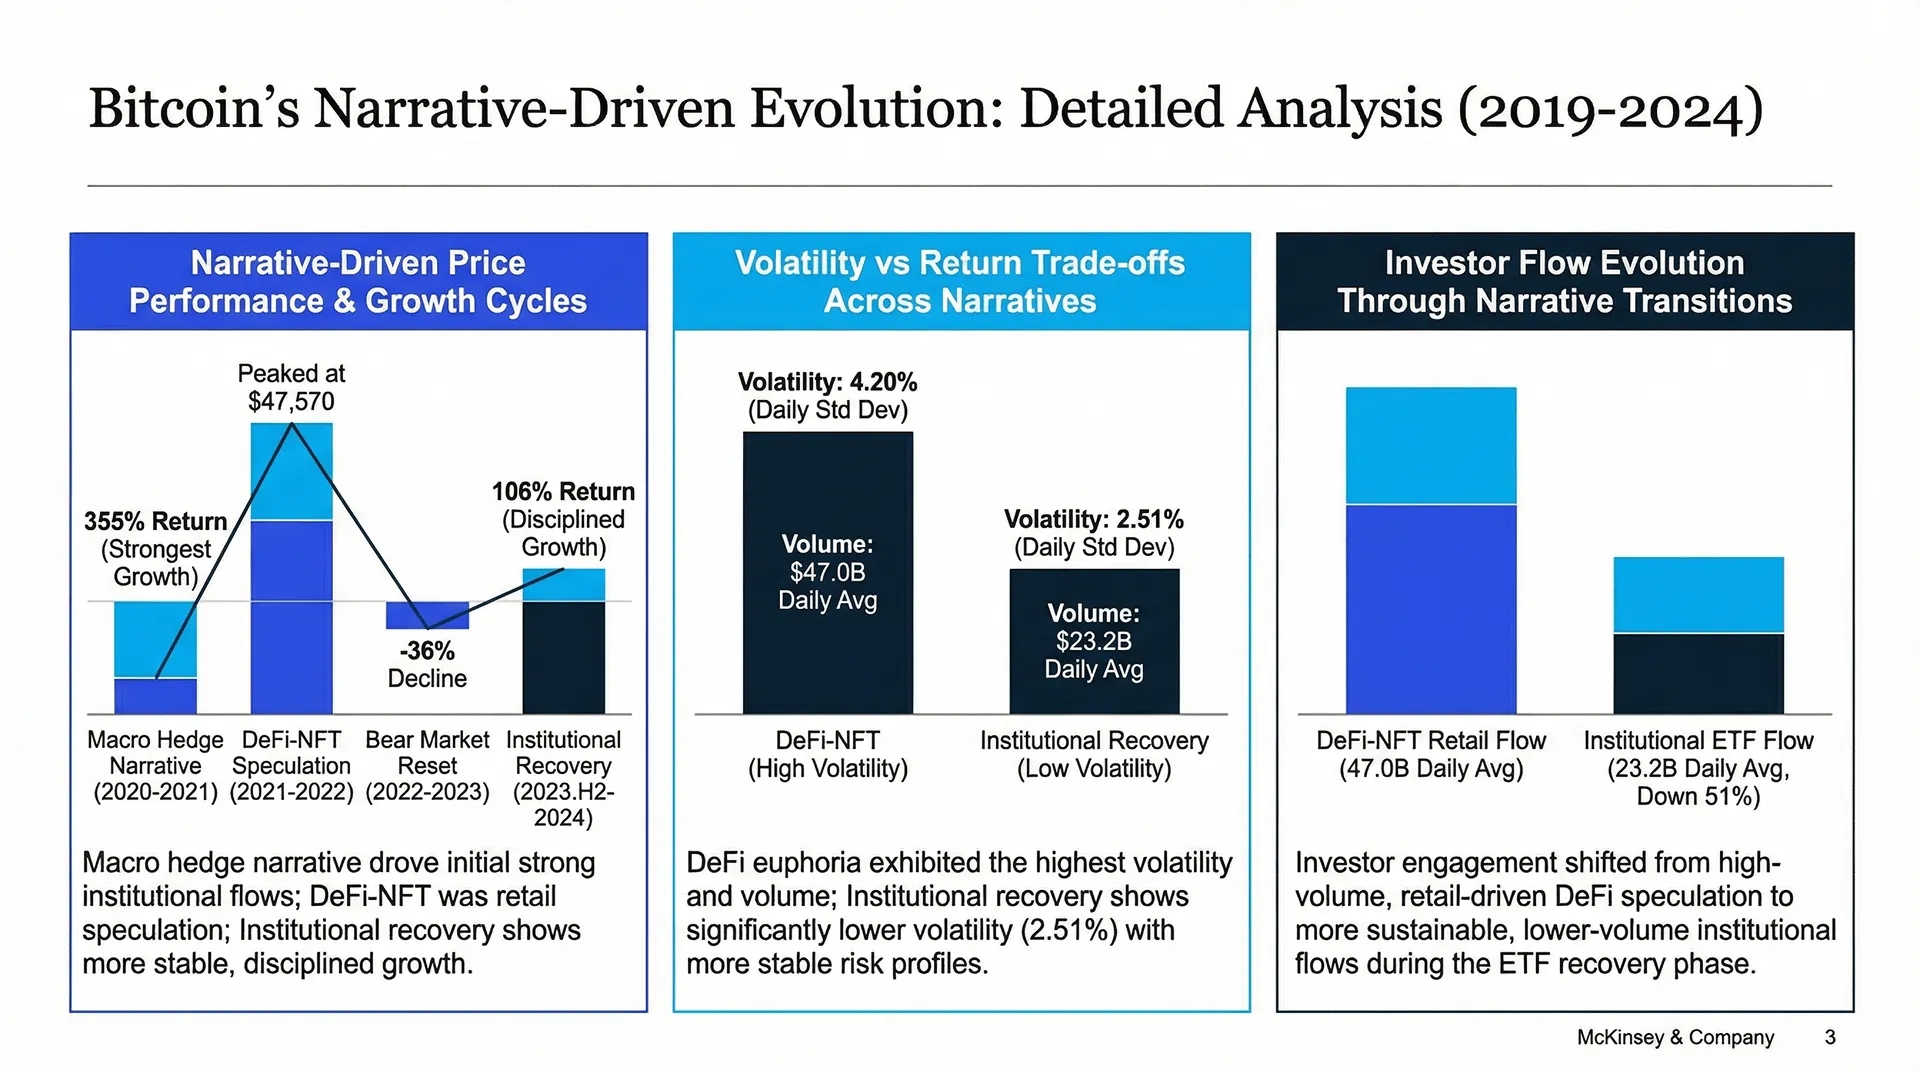
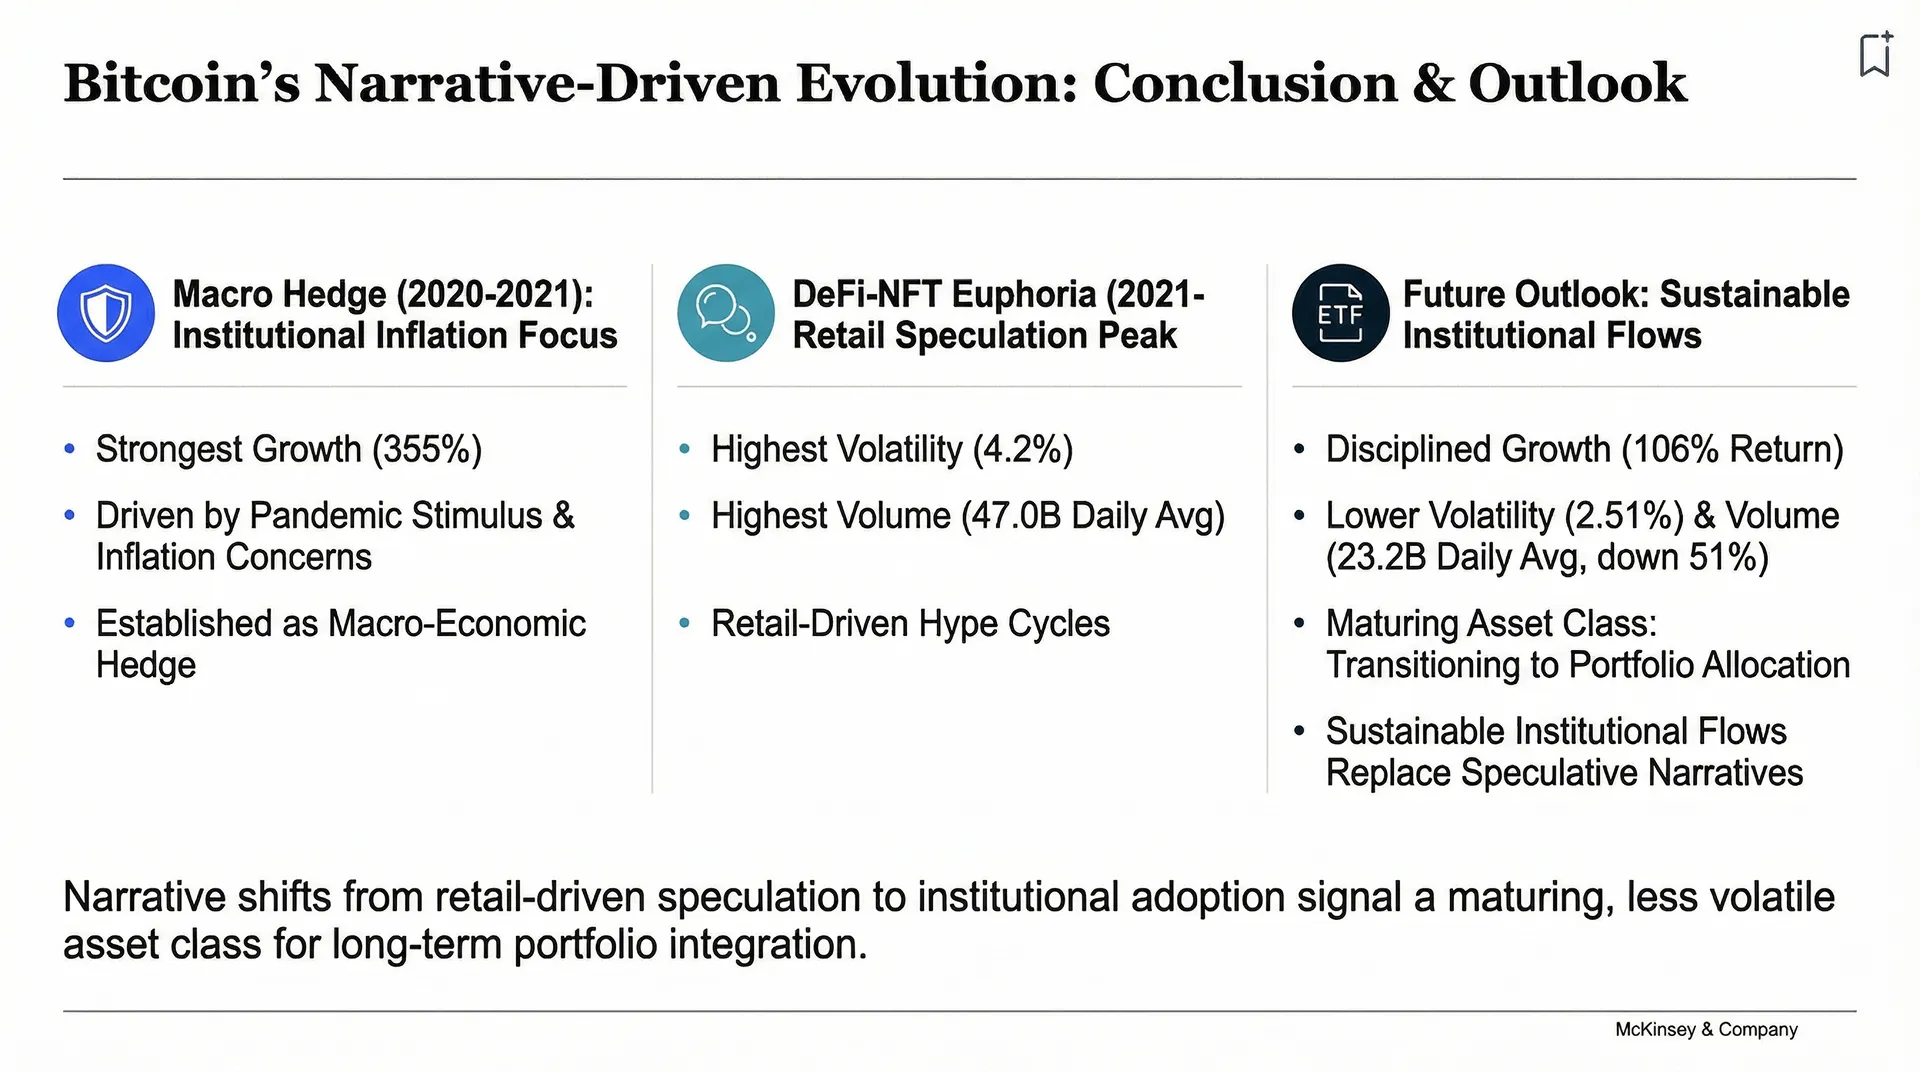
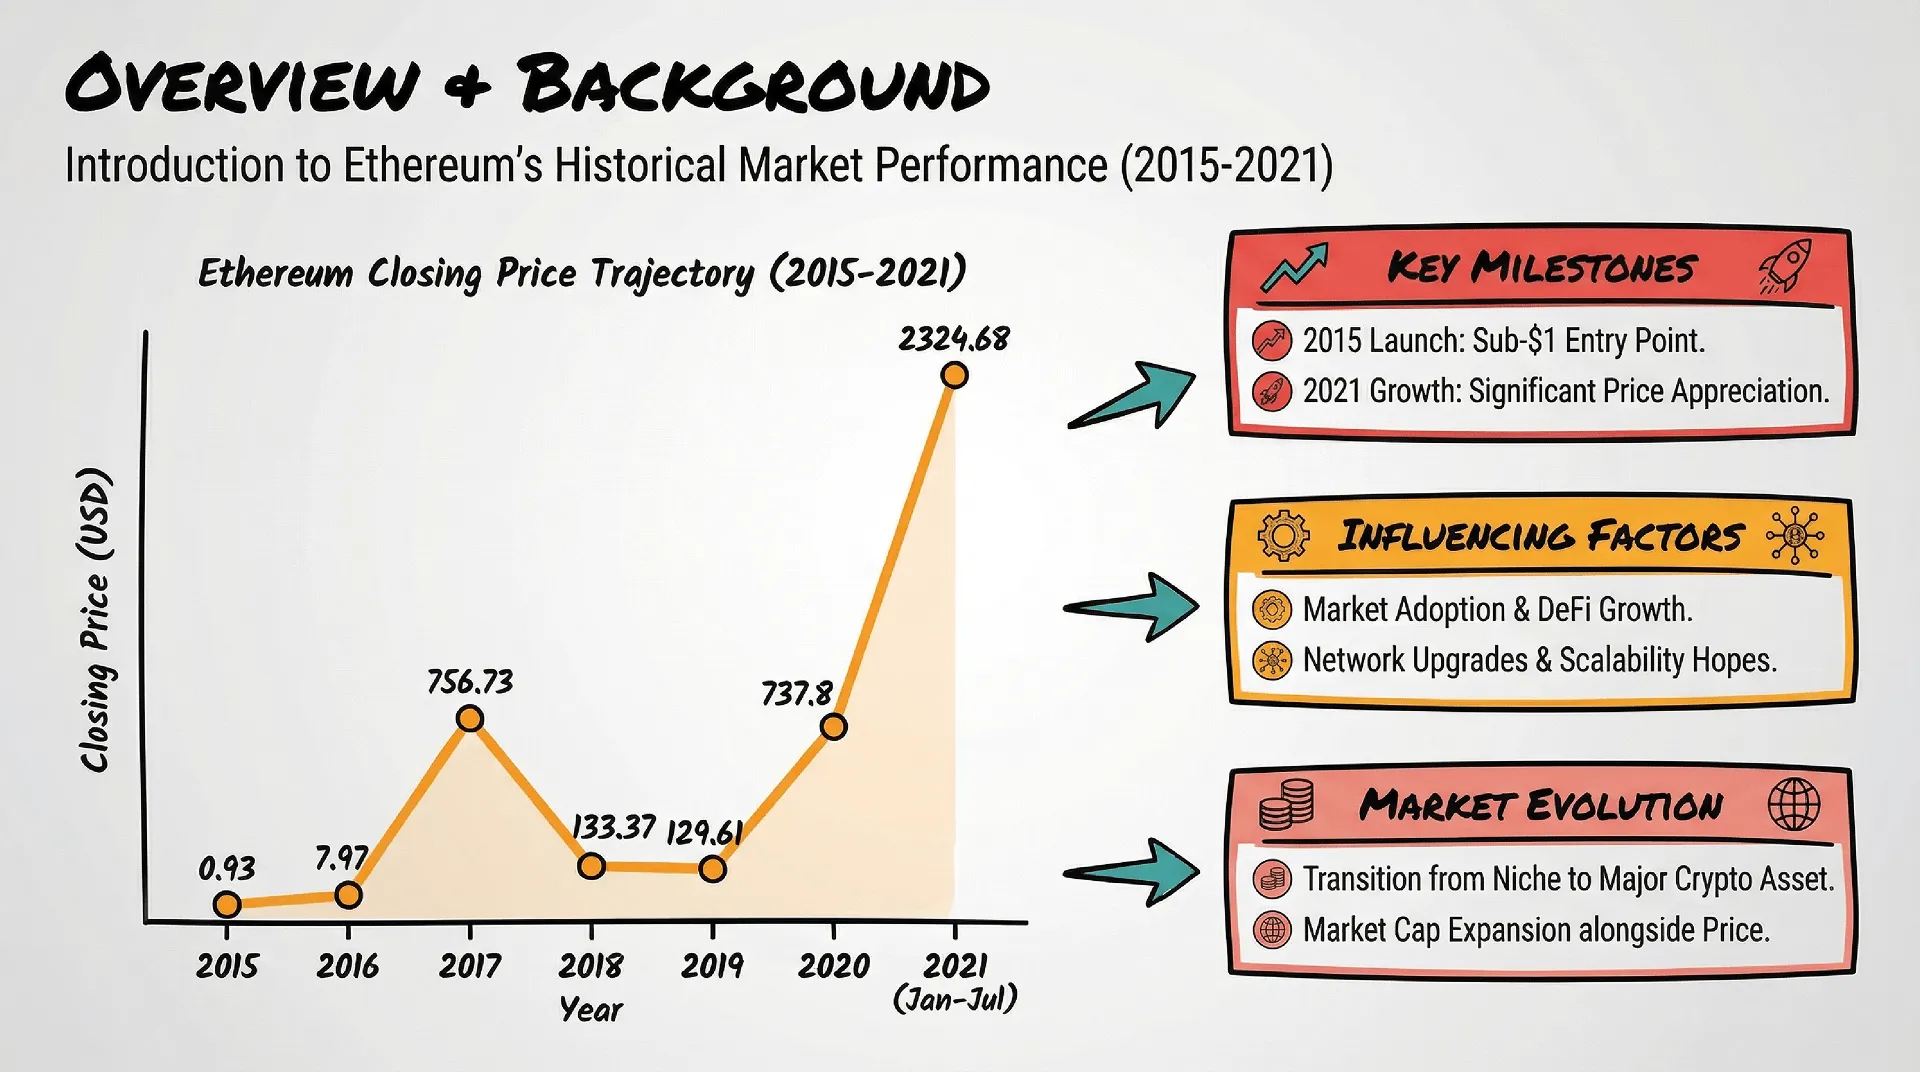
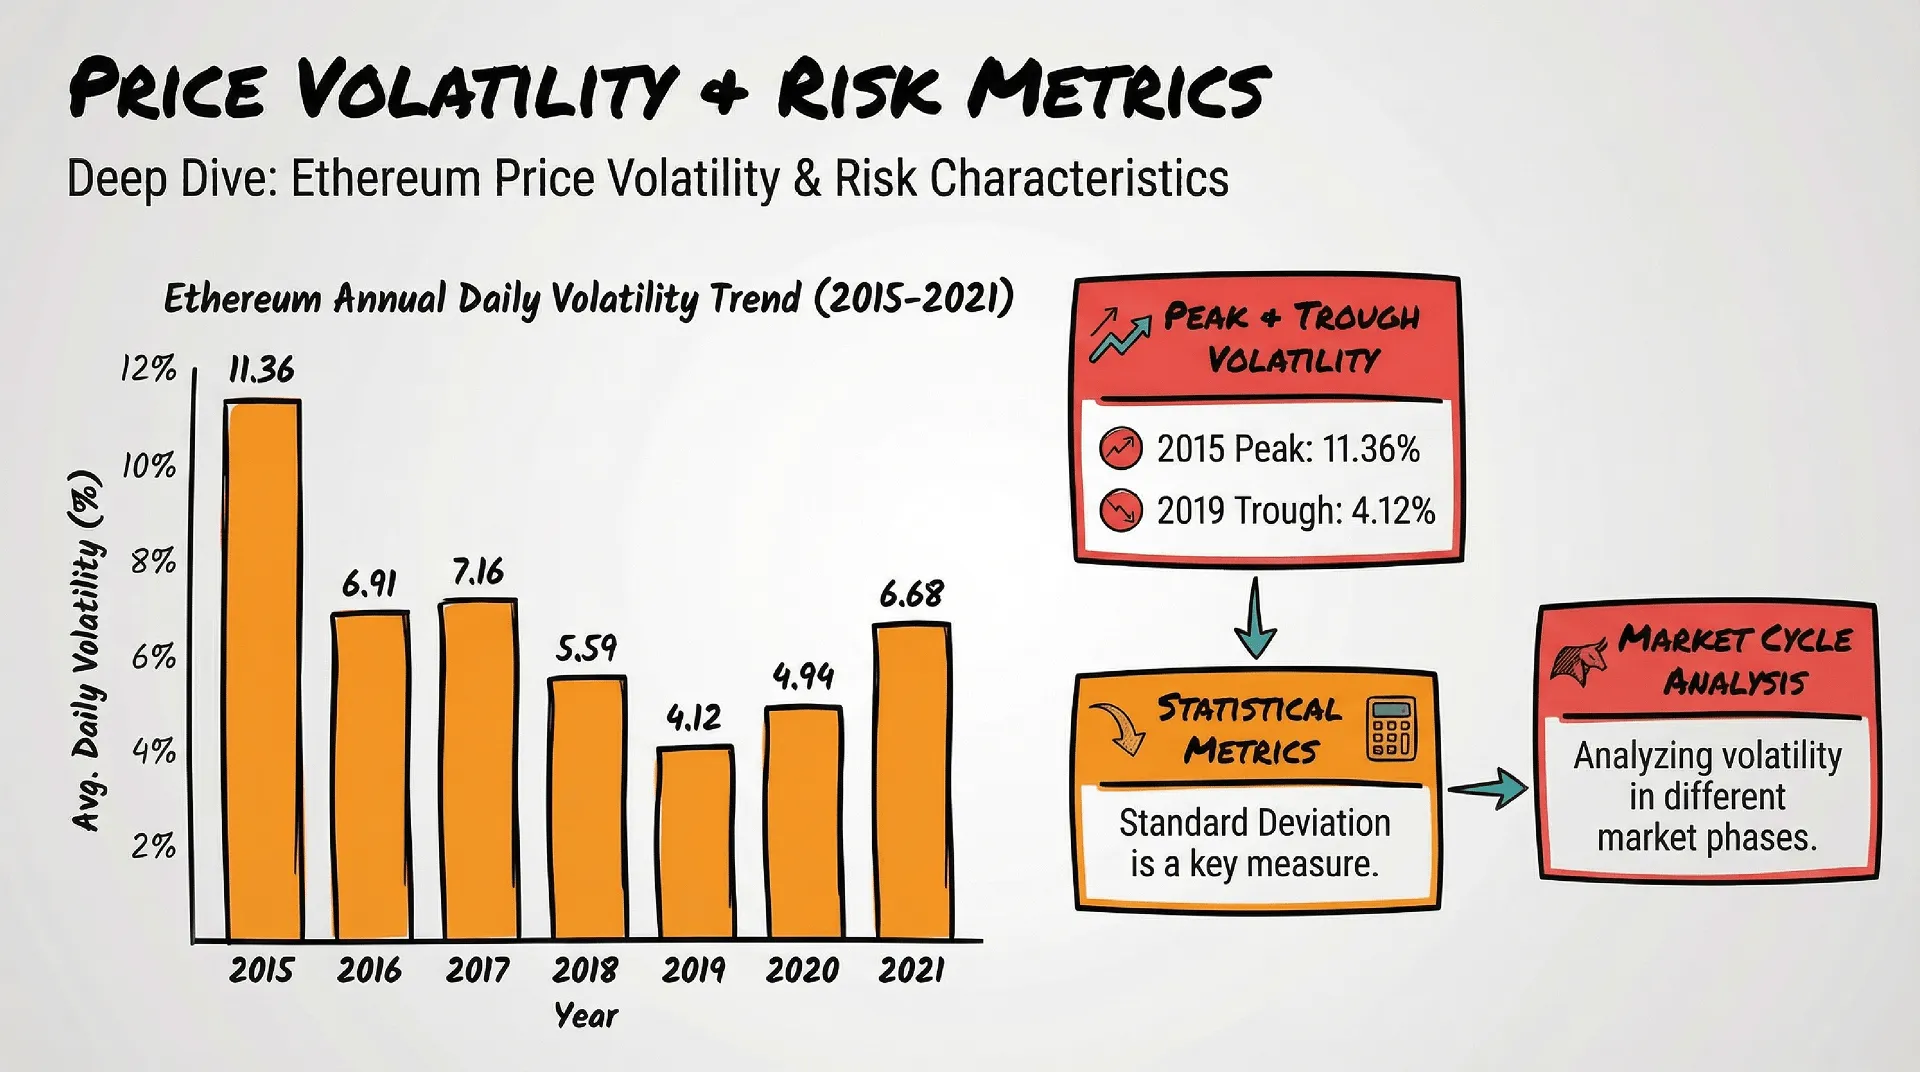
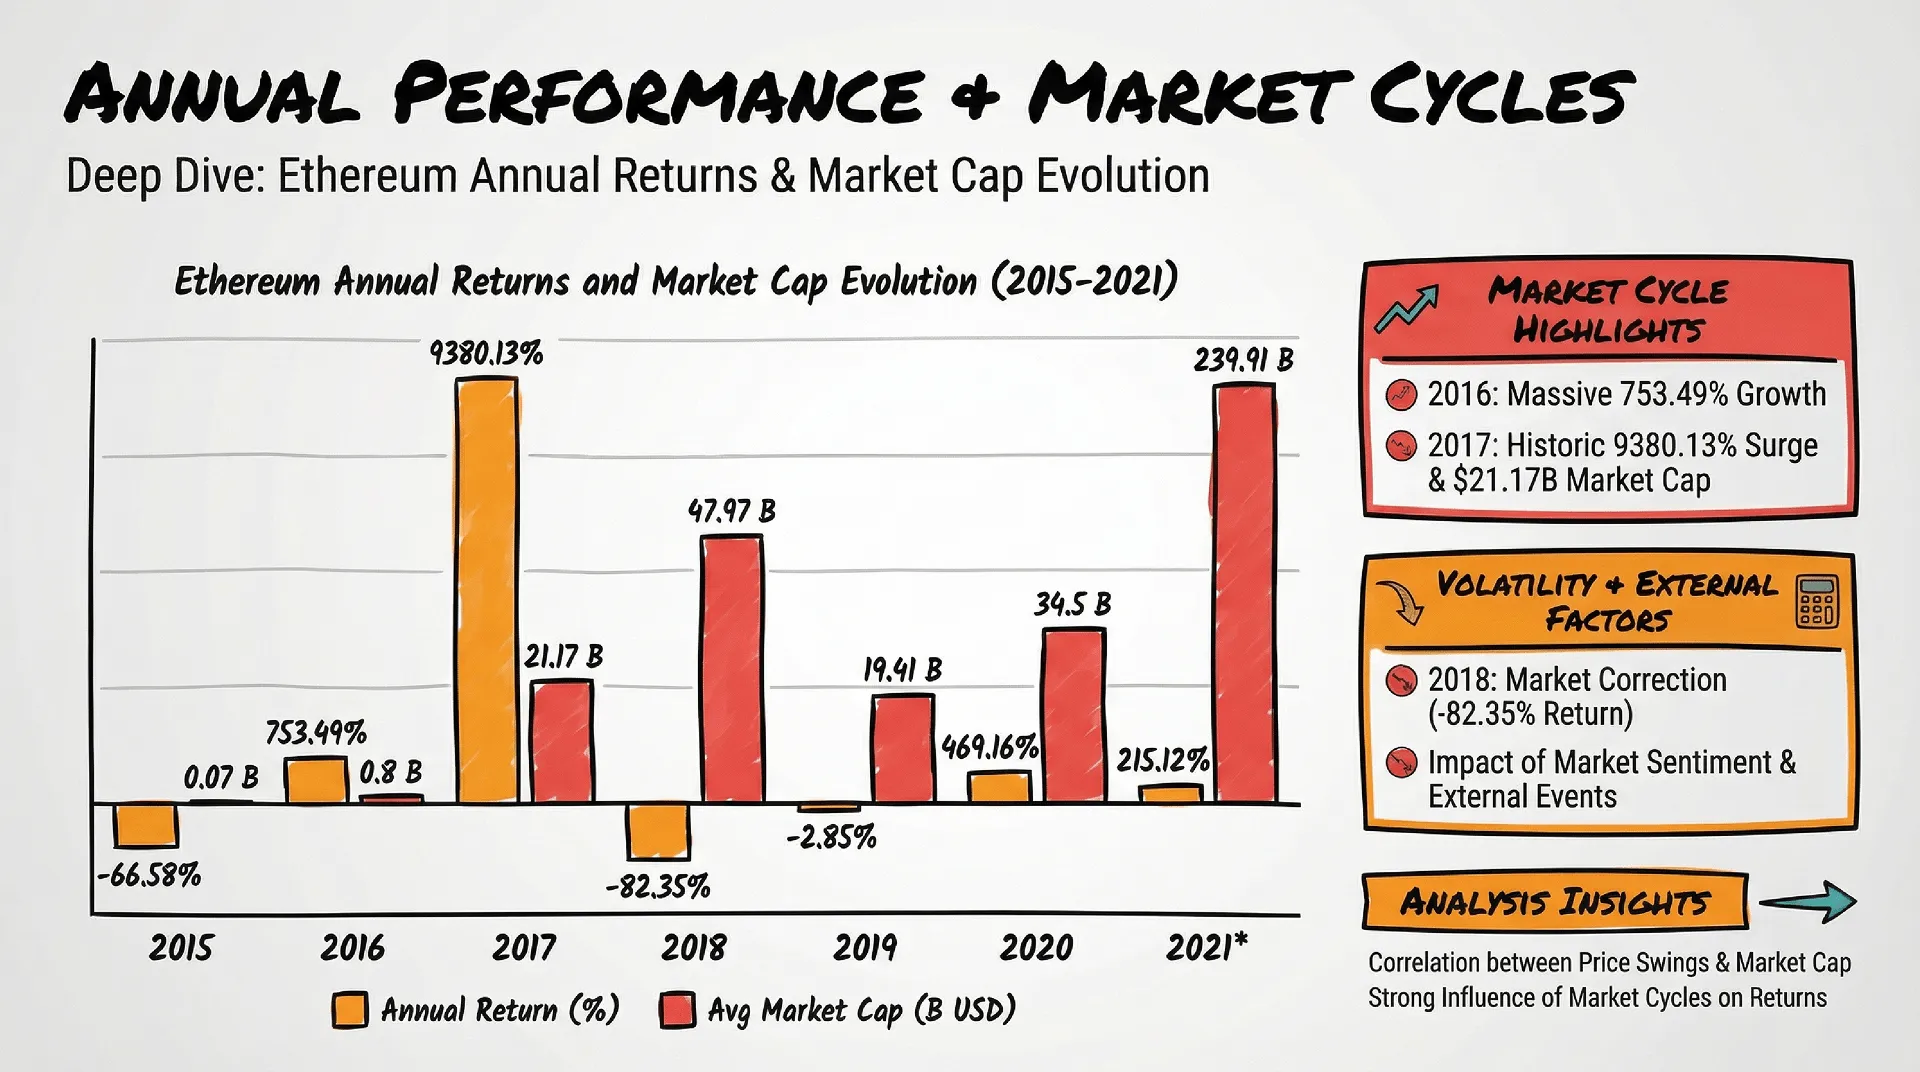
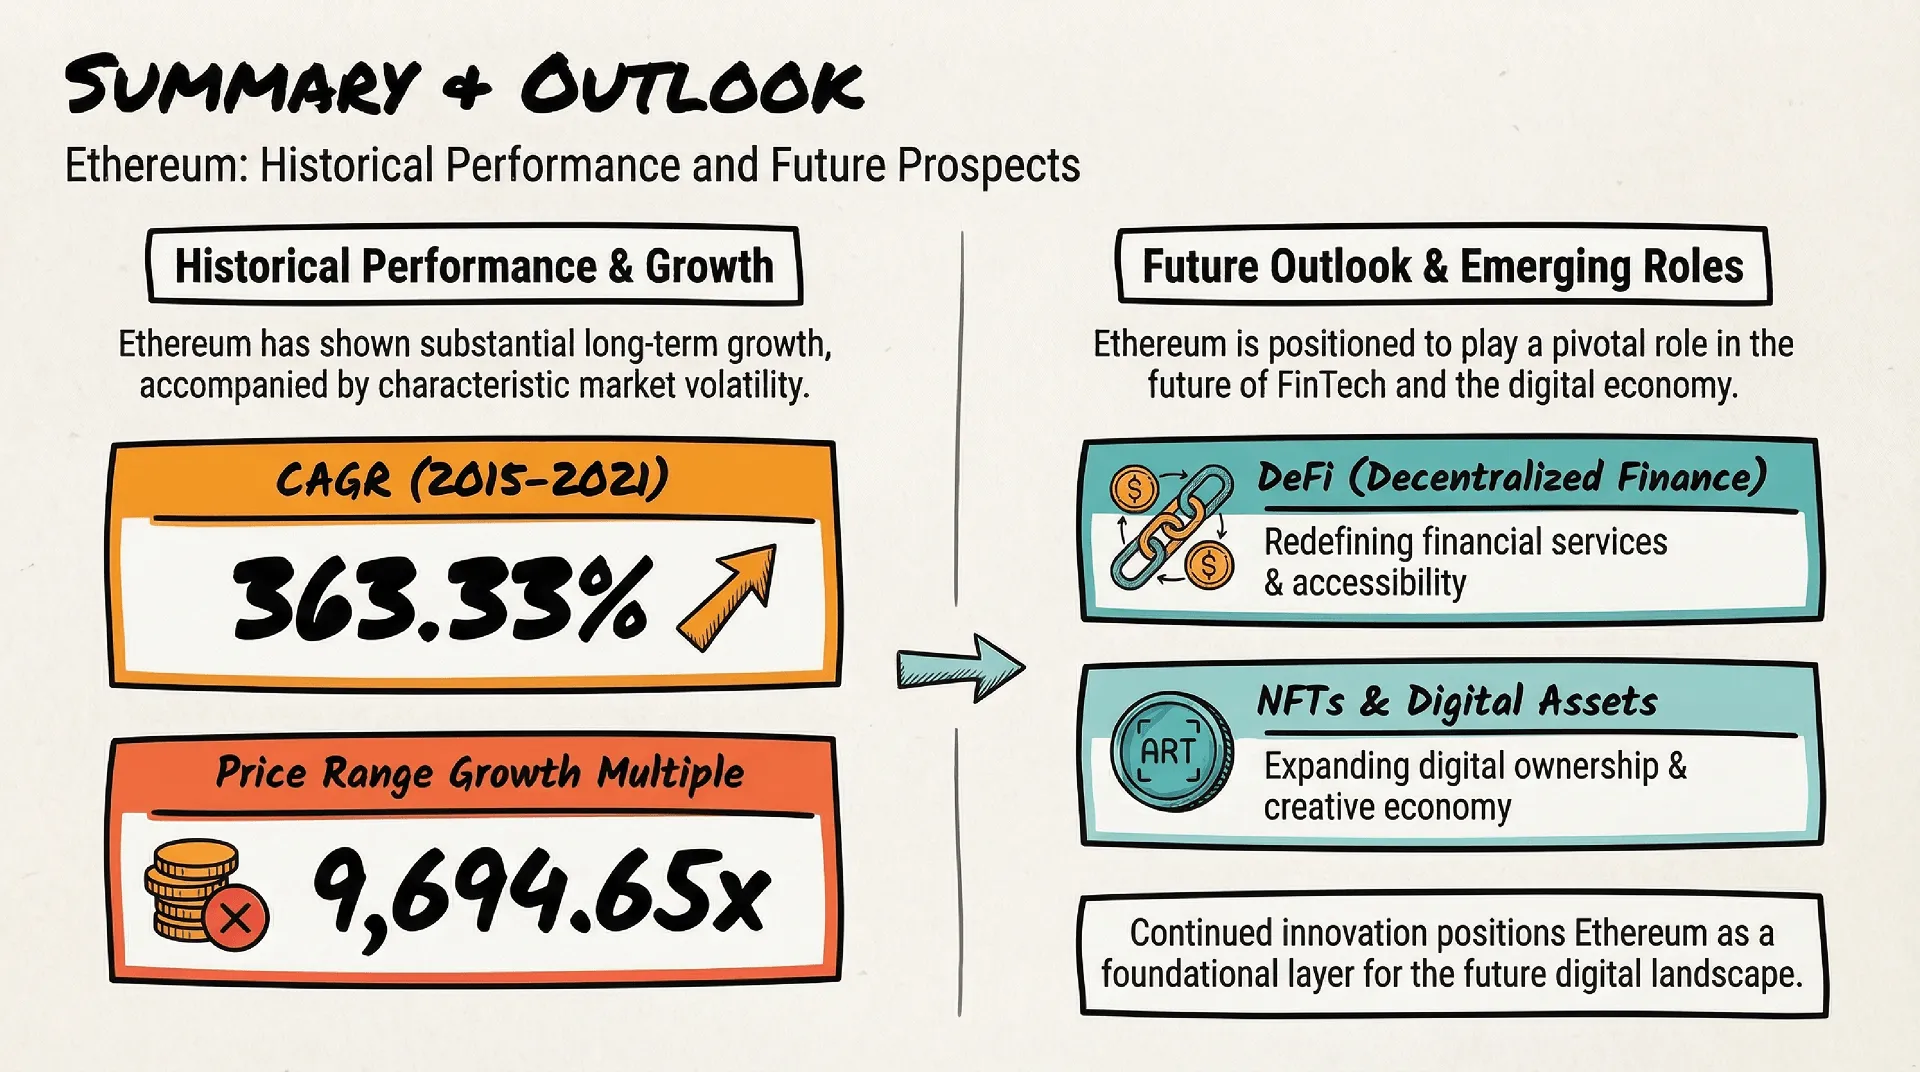
Experience the output of high-fidelity AI. These showcases demonstrate how the model generates entire presentation decks that consistently follow any visual language you choose—from Data-Heavy Analyst styles to futuristic 3D illustrations.

数据分析风格

现代风格

营销策略风格

商务风格

手绘风格

常见问题(FAQ)

Powerdrill Bloom 是什么?

Bloom 中的 AI 数据智能体是什么?

Bloom 可以用来做什么?

Bloom 是免费的吗?

哪里可以体验 Powerdrill Bloom?

Bloom 能帮我生成 PPT 吗?

使用 Bloom 需要技术或数据分析技能吗?

Bloom 支持哪些数据格式?

Bloom 支持哪些语言?

我可以与团队协作使用 Bloom 吗?

使用 Bloom 时我的数据安全吗?

我能删除在 Bloom 中的数据吗?