Top 12 AI Data Transformation Tools in 2026: Features & Pricing

Introduction
Standing here in 2026, I’ve just concluded a rigorous testing phase of the market's leading AI Data Transformation Tools.
While AI is ubiquitous, the pain of "dirty data" remains. Business users are still spending 80% of their time scrubbing Excel sheets instead of finding insights.
This guide reveals the 12 best tools to automate your workflow.
Comparison Table
Tool Name | Best For | Key Strength | Pricing Model |
Non-Tech Business Users | Nano Banana Pro (AI Cleaning to Viz) | Freemium / Subscription | |
Analytics Engineers | SQL-based Transformation | Subscription (Per User) | |
Data Analysts | Drag-and-drop Workflow | Custom pricing | |
Data Wrangling | Visual Data Cleaning | Custom pricing | |
Tableau Users | Visual Flow Cleaning | Subscription | |
Enterprise IT | Complex ETL Integration | Tiered Subscription | |
Data Engineers | Automated ELT Pipelines | Custom pricing | |
Data Scientists | Open Source Workflow | Free / Commercial | |
Large Enterprises | Data Governance & Scale | Custom Enterprise | |
Simple pipelines | Fast setup for common sources | Subscription | |
Cloud Data Warehouses | Cloud-Native ETL | Custom pricing | |
Developers | Python-based Orchestration | Open Source |
1. Powerdrill Bloom
An AI-native data analysis agent designed specifically for non-tech users to clean, analyze, and visualize data via natural language.
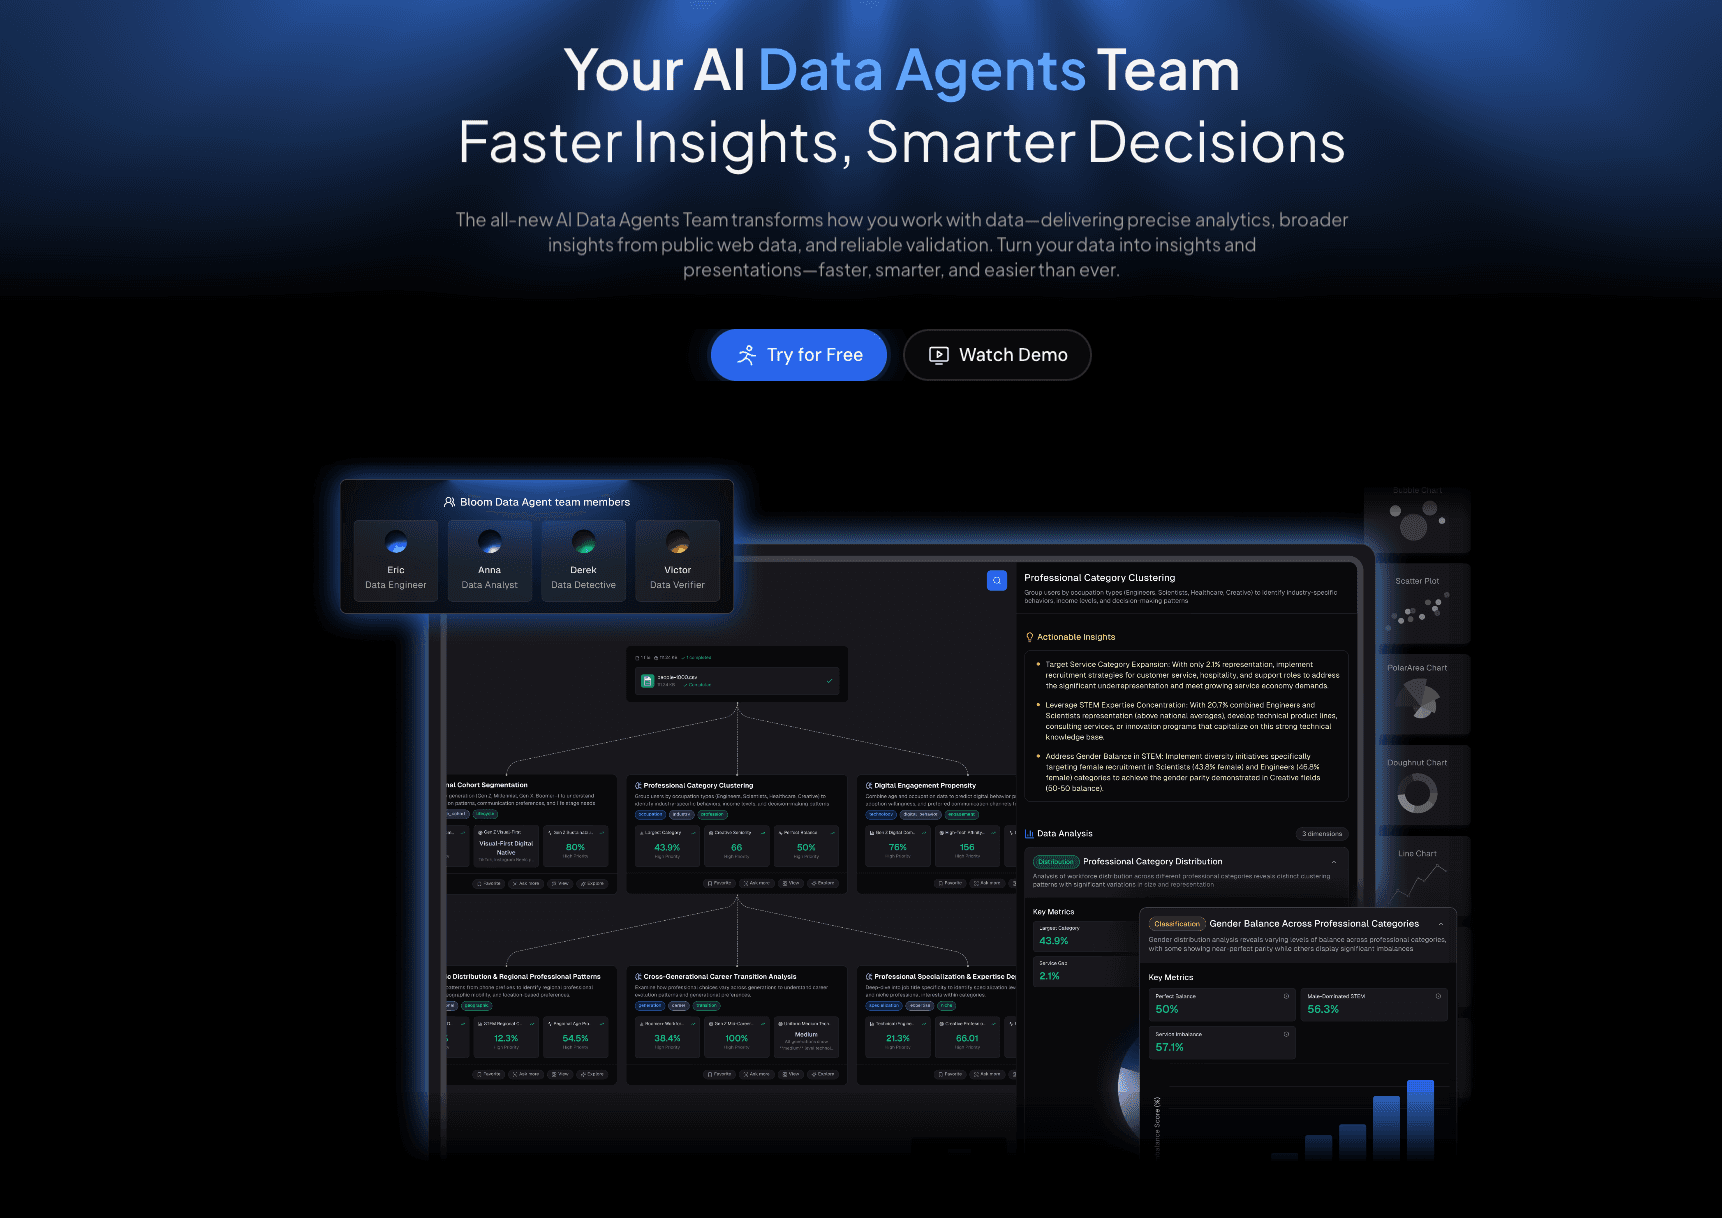
Key Features:
Conversational Data Cleaning: Use NLP to ask, "Remove duplicates and normalize date formats," without touching a spreadsheet.
Nano Banana Pro Engine: Automatically converts transformed data into "Business/Fancy" professional slides and data preview images.
Automated Insight Extraction: Identifies trends, outliers, and fills missing values intelligently using AI.
Pros:
Zero coding required (No SQL/Python).
Seamless transition from raw data cleaning to visual storytelling (Slides).
Highly intuitive for marketing and sales professionals.
Cons:
May not support ultra-complex legacy mainframe integrations.
Pricing:
Competitive Freemium model with Pro plans for advanced AI usage.
2. dbt (data build tool)
The industry standard for analytics engineering, allowing users to transform data in their warehouse using SQL.
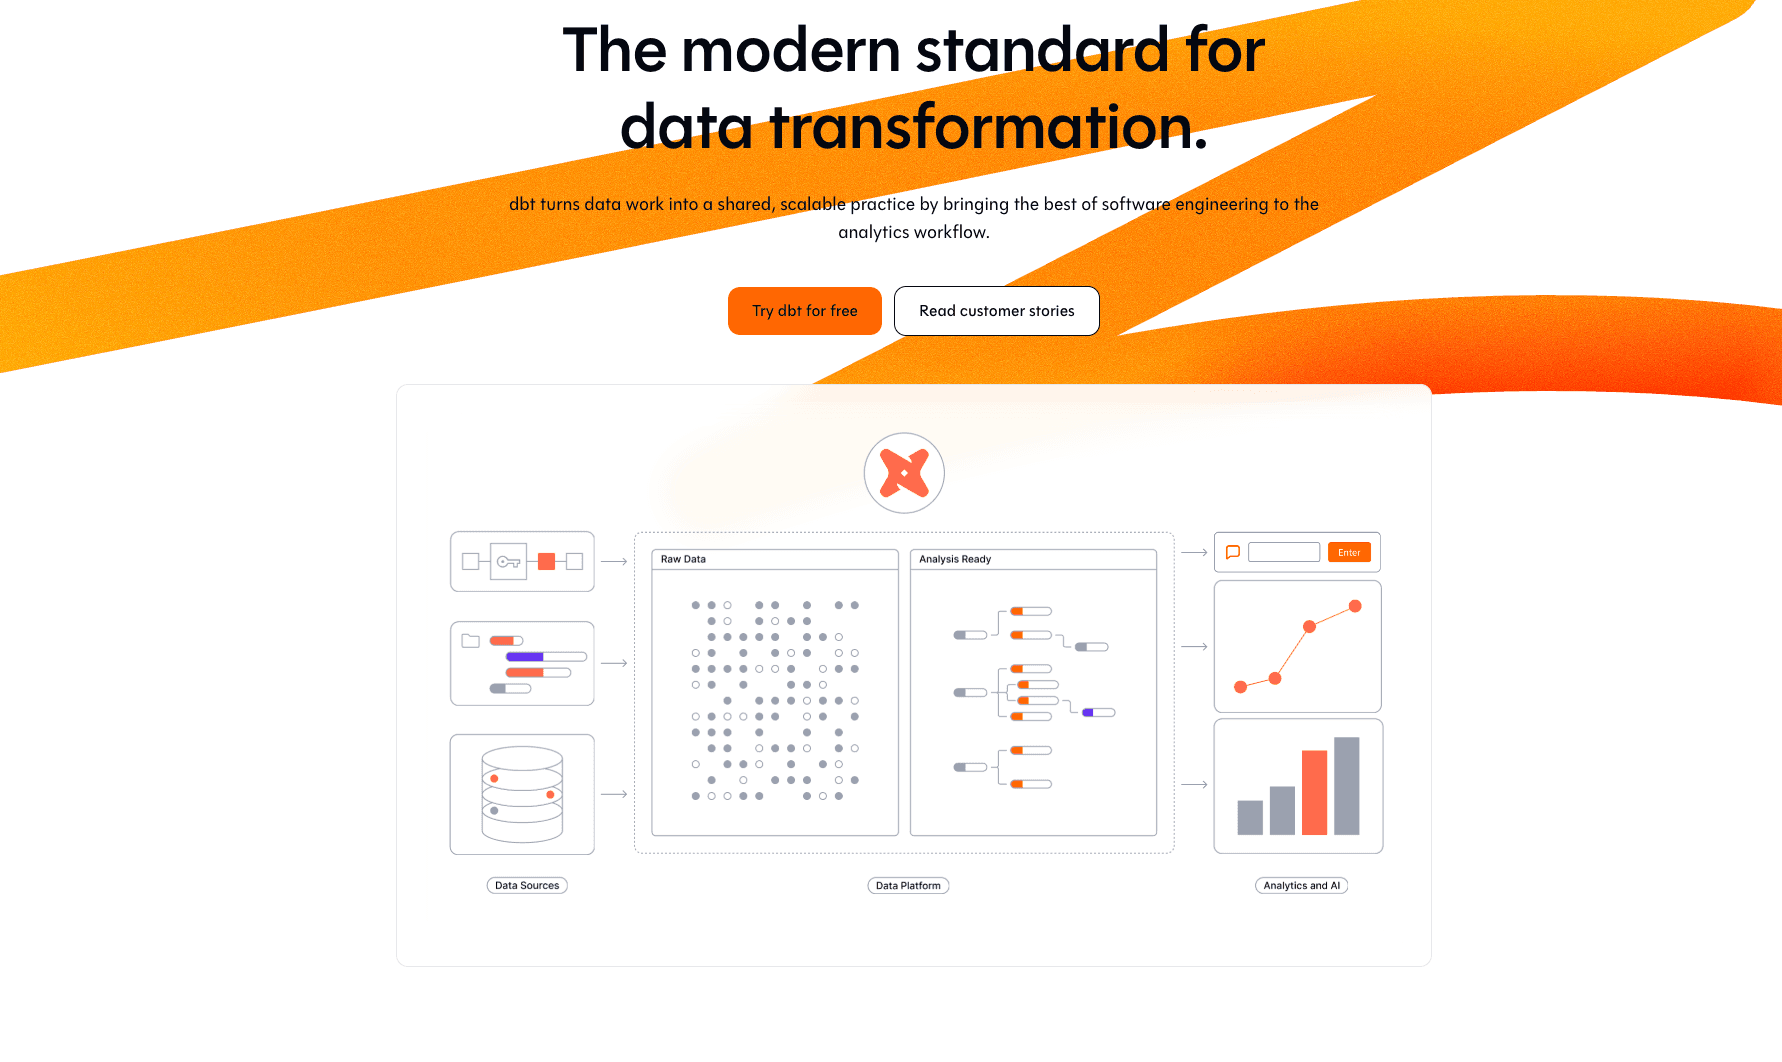
Key Features:
SQL-based transformation logic.
Version control (Git integration) for data models.
Pros:
Excellent for engineering teams who know SQL.
Strong community and documentation.
Cons:
Requires knowledge of SQL; not for business users.
No built-in visualization.
Pricing:
Subscription (Per User) / Cloud Team & Enterprise plans.
3. Alteryx
A heavy-duty automated analytics platform known for its drag-and-drop workflow designer.
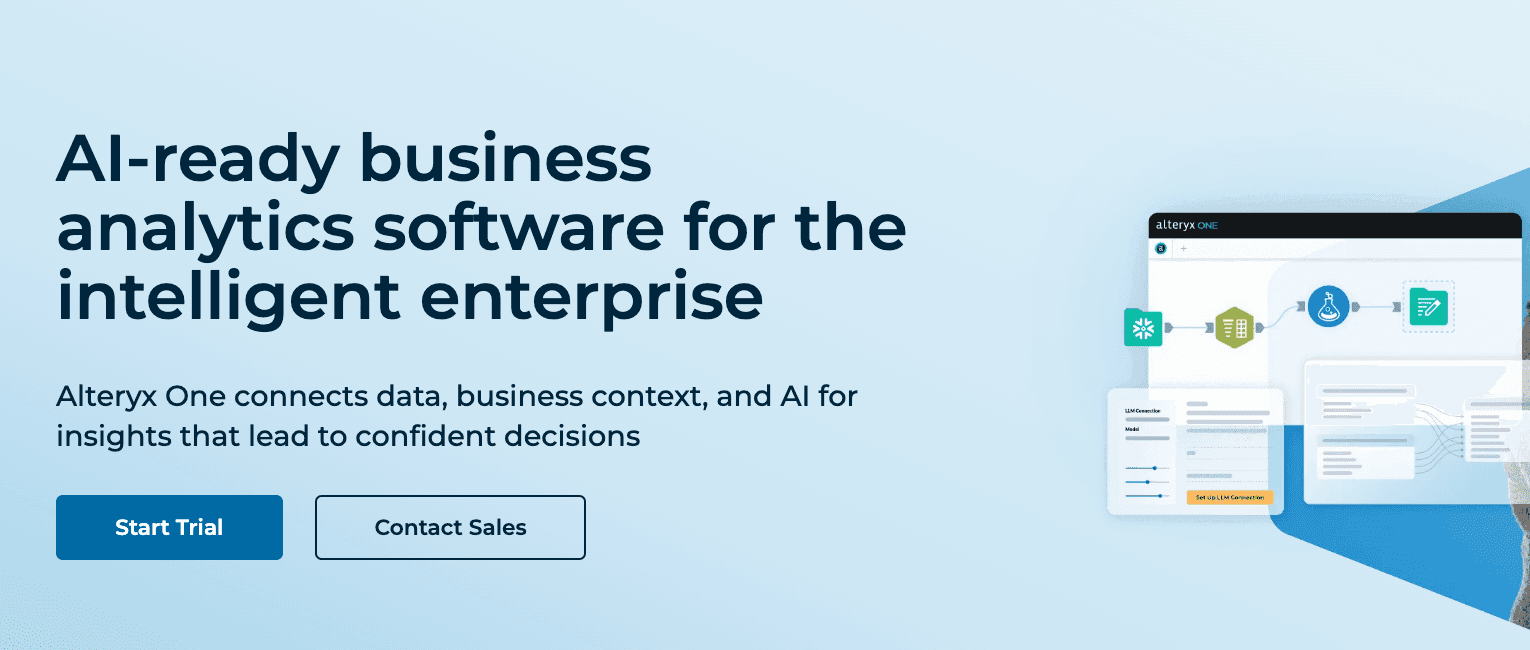
Key Features:
Hundreds of "building blocks" for data prep and blending.
Spatial and predictive analytics capabilities.
Pros:
Powerful for complex logic without code.
Handles large datasets well.
Cons:
Steep learning curve for beginners.
Very expensive licensing fees.
Pricing:
Custom pricing.
4. Trifacta (Alteryx Designer Cloud)
A cloud-first tool focused intensely on "Data Wrangling" to clean messy data using machine learning.
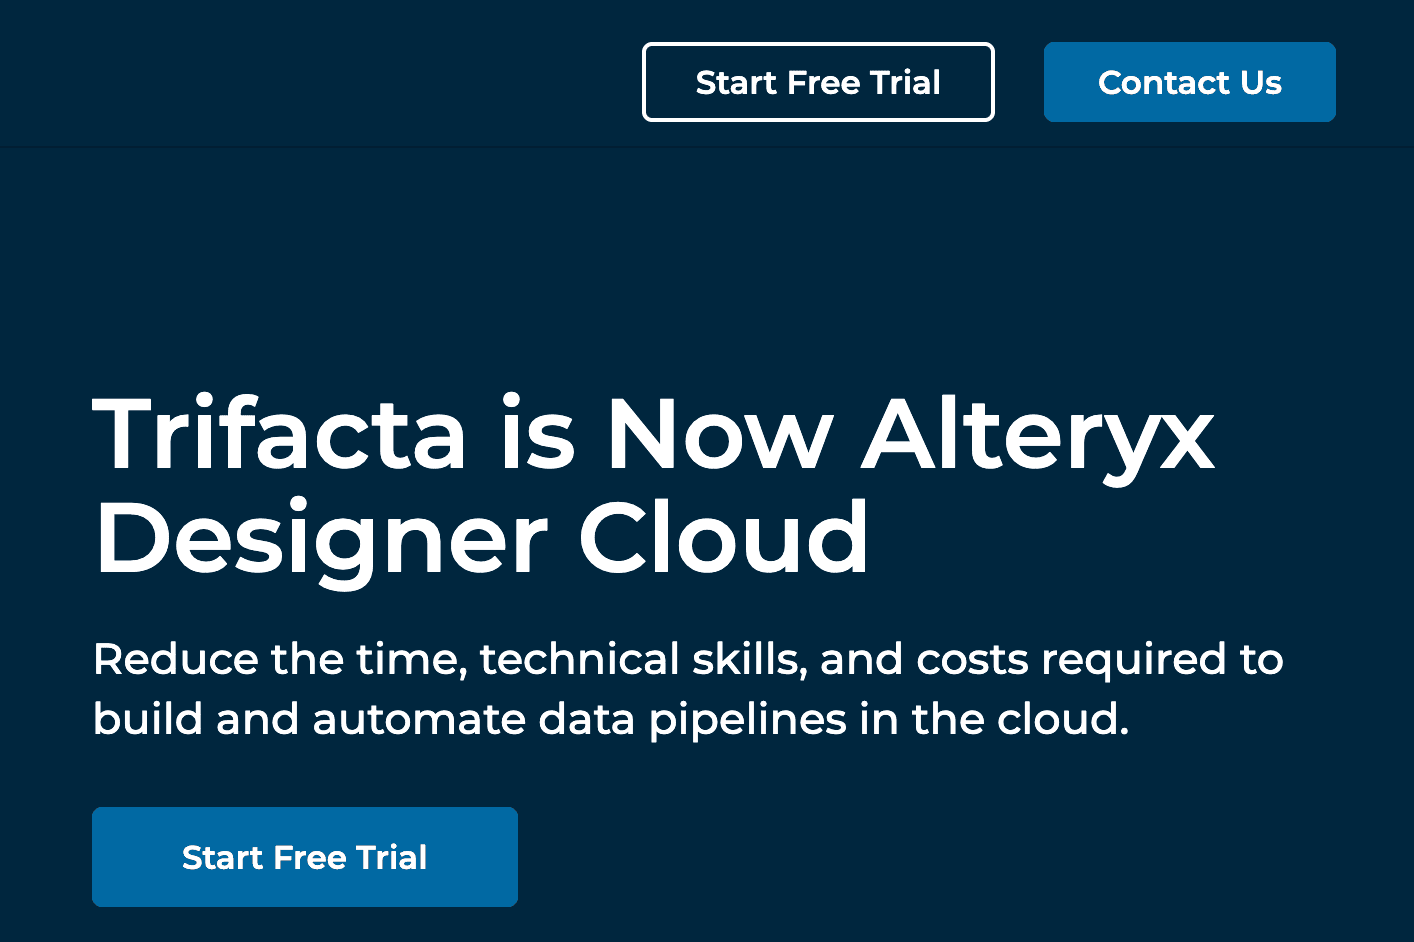
Key Features:
Intelligent suggestions for data cleaning rules.
Visual interface to see data transformation in real-time.
Pros:
Great visual feedback on data quality.
Accelerates data prep time.
Cons:
Now part of the broader Alteryx ecosystem, confusing standalone pricing.
Limited final visualization capabilities.
Pricing:
Custom pricing.
5. Tableau
A visual data preparation tool designed to integrate seamlessly with the Tableau ecosystem.
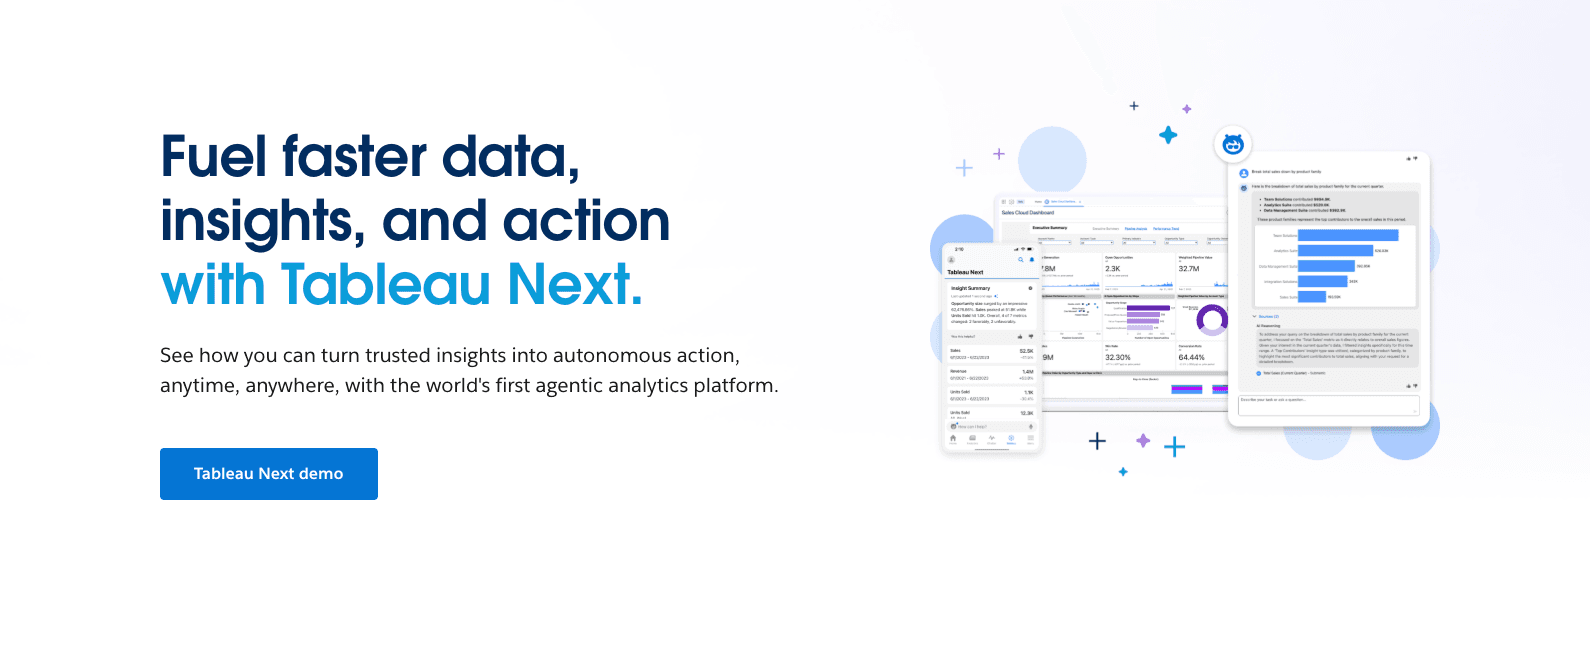
Key Features:
Visual flow interface to combine, shape, and clean data.
Immediate integration with Tableau Desktop for analysis.
Pros:
Perfect if your organization already uses Tableau.
User-friendly visual UI.
Cons:
Less effective if you are not a Tableau user.
Slower performance on very large datasets compared to ETL tools.
Pricing:
Subscription.
6. Qlik Talend
An enterprise-grade data integration platform capable of handling complex ETL and data governance.
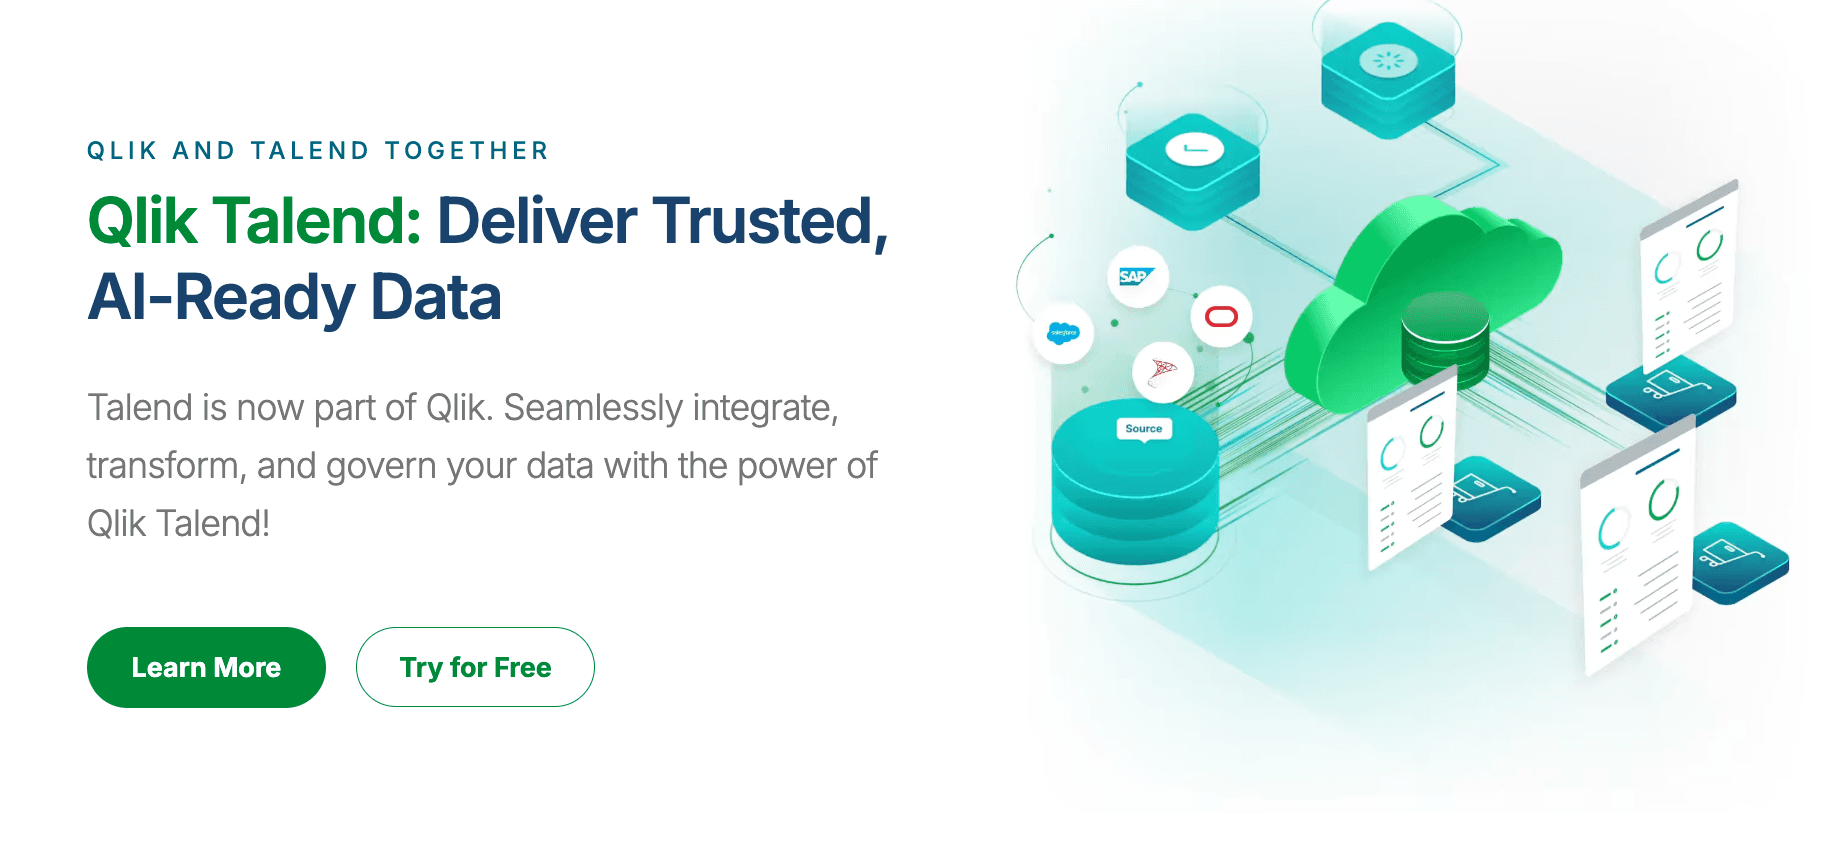
Key Features:
Broad connectivity to thousands of data sources.
Strong data quality and governance features.
Pros:
Robust for large-scale enterprise infrastructure.
Open Studio offers a free entry point.
Cons:
Complex interface; requires IT expertise.
Resource-heavy.
Pricing:
Tiered Enterprise Subscription.
7. Fivetran
The leader in "ELT" (Extract, Load, Transform), focusing on moving data automatically into data warehouses.
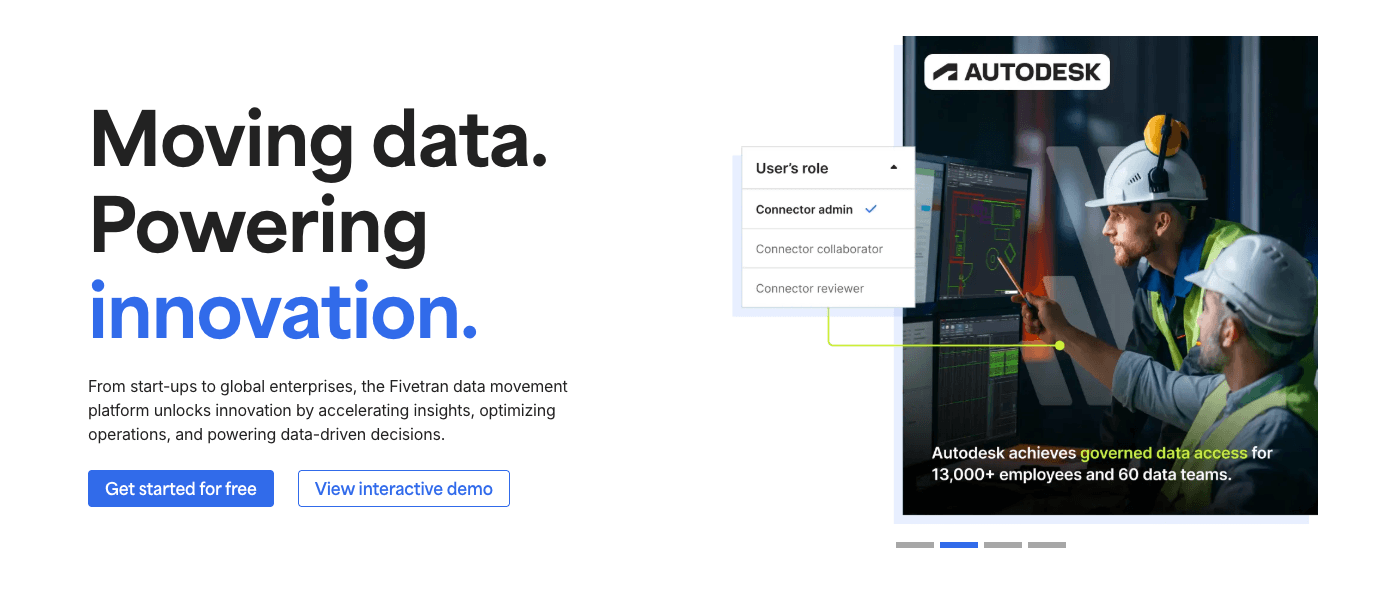
Key Features:
Zero-maintenance data pipelines.
Pre-built connectors for major SaaS apps (Salesforce, HubSpot).
Pros:
Set it and forget it; extremely reliable.
Saves massive engineering time on maintenance.
Cons:
Focuses on moving data, not "cleaning" it (relies on dbt for transformation).
Can get expensive as data volume grows.
Pricing:
Custom pricing.
8. KNIME Analytics Platform
An open-source platform for data science workflows, allowing users to create visual data pipelines.
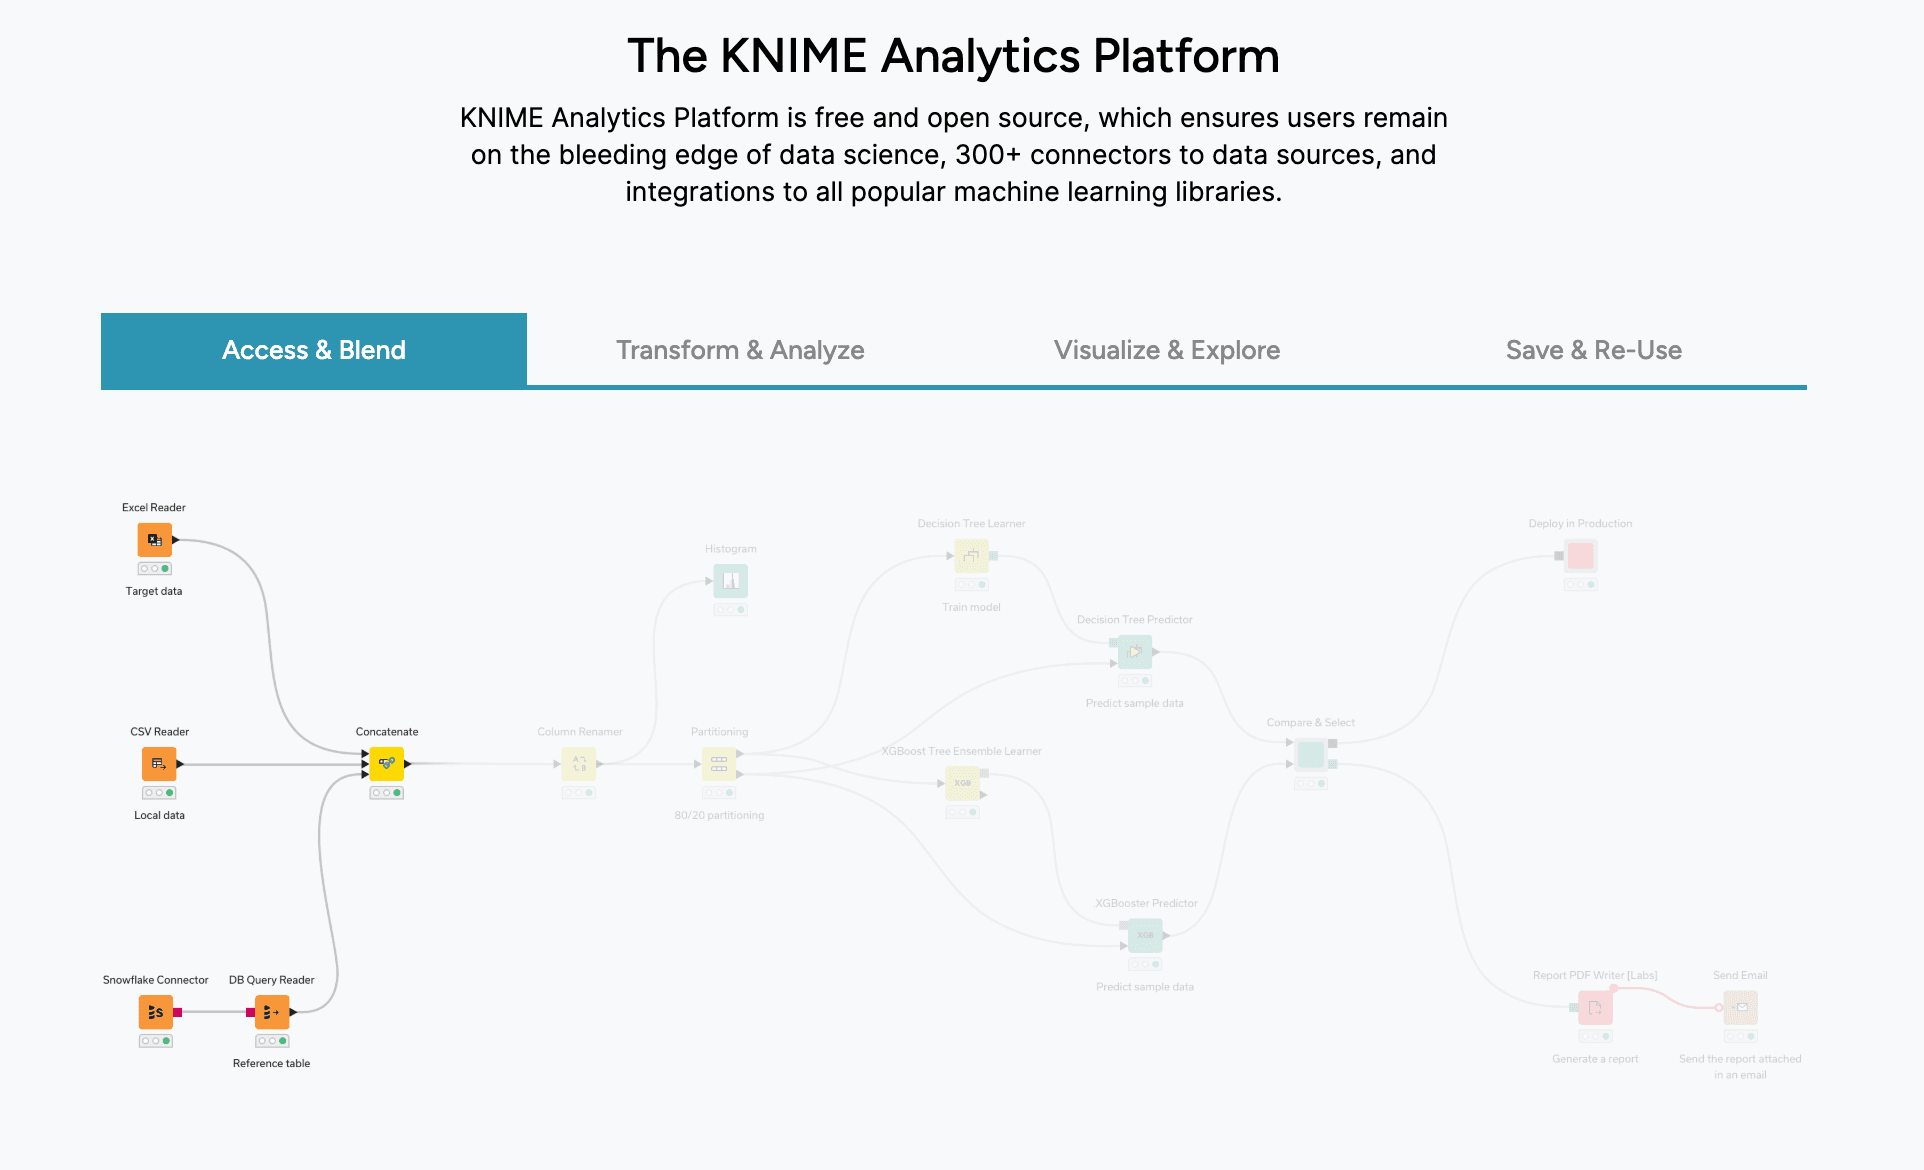
Key Features:
Node-based visual programming.
Extensive extensions for chemistry, text mining, and AI.
Pros:
Free and open-source.
Very flexible for data scientists.
Cons:
UI feels dated compared to modern 2026 AI tools.
Steep learning curve.
Pricing:
Free (Open Source) / Commercial Server pricing.
9. Informatica PowerCenter
The traditional heavy-weight champion of enterprise data integration and management.
Key Features:
Metadata-driven AI for data cataloging.
High-performance ETL for massive legacy systems.
Pros:
Unmatched scalability and security.
Industry standard for Fortune 500.
Cons:
Extremely expensive.
Requires dedicated developers to manage.
Pricing:
Custom Enterprise Quotes.
10. Stitch
A cloud data integration tool that extracts data from applications and databases and loads it into warehouses.
Key Features:
Pre-built connectors for common applications and databases.
Quick setup.
Pros:
Reliable syncing with minimal maintenance
Transparent data processing steps.
Cons:
Limited transformation capabilities.
Fewer connectors than some competitors.
Pricing:
Subscription.
11. Matillion
A cloud-native ETL tool built specifically to leverage the power of cloud data warehouses (Snowflake, BigQuery).
Key Features:
Push-down ELT architecture (uses the warehouse's power).
Drag-and-drop browser interface.
Pros:
Fast performance on cloud data.
Pay-as-you-go model matches cloud economics.
Cons:
Limited utility outside of cloud data warehouses.
Visuals are for pipeline design, not business reporting.
Pricing:
Custom pricing.
12. Apache Airflow
A platform to programmatically author, schedule, and monitor workflows (Pipelines as Code).
Key Features:
Python-based DAGs (Directed Acyclic Graphs).
Extremely extensible and flexible.
Pros:
Standard for data engineers managing complex dependencies.
Open source and free.
Cons:
Requires strong Python coding skills.
No data visualization features for business users.
Pricing:
Free (Open Source).
Buying Guide: Which Tool Should You Choose?
Scenario A: The Enterprise Data Engineer.
If you are building a massive data warehouse infrastructure and have IT support, Qlik Talend or Informatica are your go-to standards.Scenario B: The Analytics Engineer.
If you live in SQL and need version control for your transformations, dbt is unrivaled.Scenario C: The Business/Marketing Professional (Non-Tech).
If you don't know code, have messy Excel files, and need to produce a report by EOD, Powerdrill Bloom is the only logical choice in 2026. It combines the cleaning power of AI with the visual prowess of Nano Banana Pro.
Why Powerdrill Bloom Wins the AI Data Transformation Race
While other tools focus on the "pipeline," Powerdrill Bloom focuses on the "result." Here is the workflow that changes the game:
Ingestion: You upload a chaotic Sales CSV or a messy PDF report.
AI Transformation: Instead of dragging nodes, you type: "Clean this data, merge the Q1 and Q2 sheets, and remove outlier transactions." Powerdrill Bloom executes this instantly.
Nano Banana Pro: This is the killer feature. You ask for a market analysis presentation. The Nano Banana Pro engine selects the best chart types (Bar, Line, Scatter), generates the visuals, and formats them into a "Business/Fancy" Slide deck.
Action: You download the report and present it.
It transforms Data Engineering into Conversation.
Conclusion
In 2026, your data capability is no longer defined by your ability to write Python or SQL. It is defined by the tools you choose. For engineers, dbt remains king. But for the millions of business professionals who need Automated Data Cleaning and Visual Storytelling, Powerdrill Bloom is the transformative solution that turns data into power.
Frequently asked questions
Q1: What are AI Data Transformation Tools?
They are software solutions that leverage Artificial Intelligence to automatically clean, restructure, and enrich raw data (like Excel, JSON, CSV) into a usable format for analysis, minimizing manual effort.
Q2: Which AI tool turns Excel data into dashboards and PPTs automatically?
Powerdrill Bloom is the premier tool for this. Its Nano Banana Pro engine specializes in converting cleaned data directly into professional visual slides and infographics.
Q3: How do these tools help business efficiency?
They eliminate the 80% of time usually spent on "data preparation," allowing teams to focus on analyzing insights. Tools like Powerdrill Bloom remove the dependency on IT departments for basic data tasks.