Fato de dados: sete métricas-chave por trás do crash do mercado cripto de junho de 2026

TL;DR — O crash cripto de junho de 2026 em 5 números
O mercado de criptomoedas passou por um duro choque de realidade em meados de 2026. Após meses de preços em movimento lateral, o piso cedeu, impulsionado pela exaustão institucional e pelos ventos contrários macroeconômicos. Aqui está o crash global do mercado cripto em cinco números:
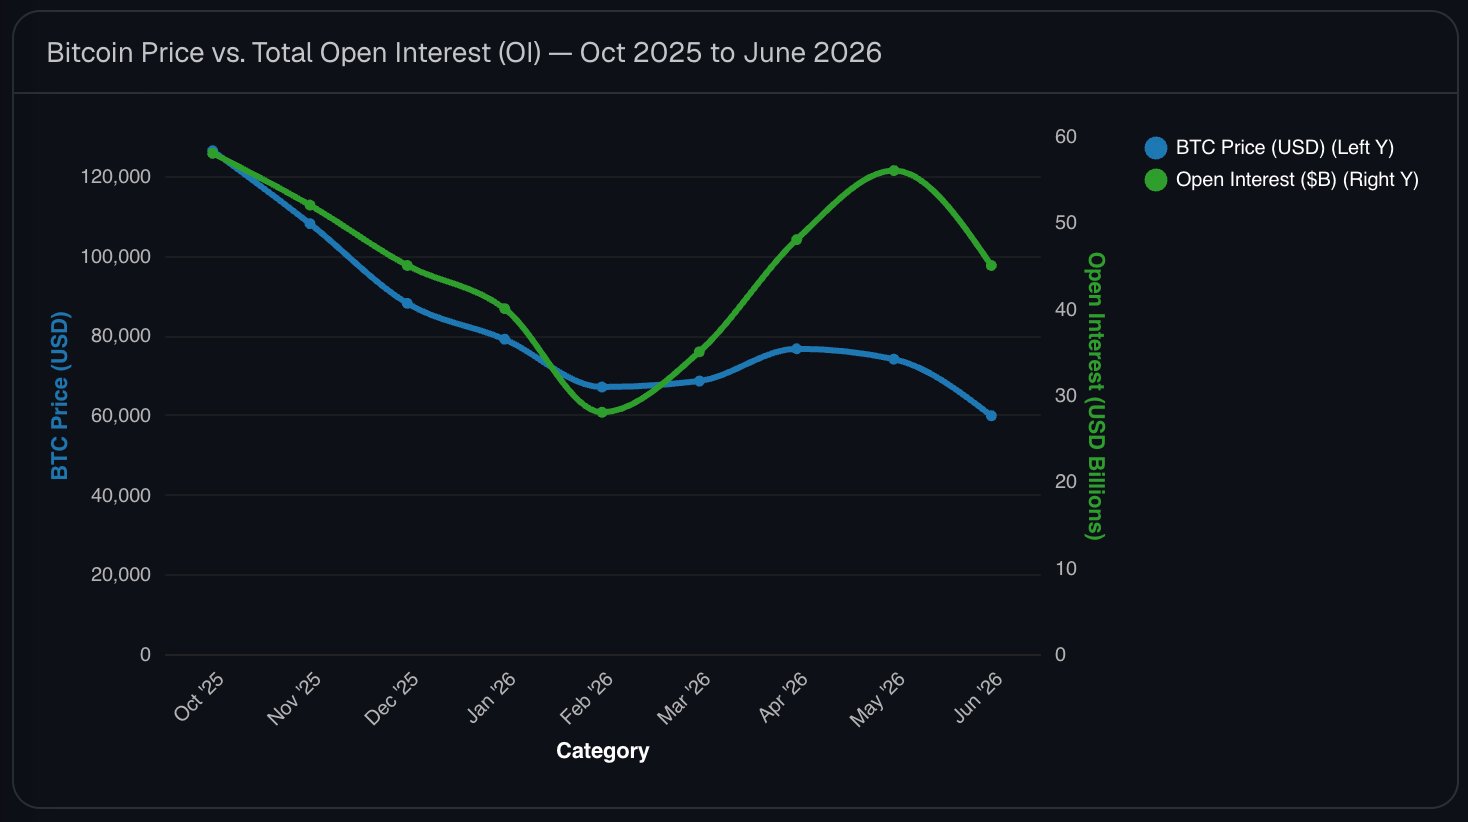
- -53%: A queda do Bitcoin em relação à sua máxima histórica (ATH) de outubro de 2025 de $126,296, tendo caído recentemente de $72,840 para abaixo de $59,000 (-18% só em junho).
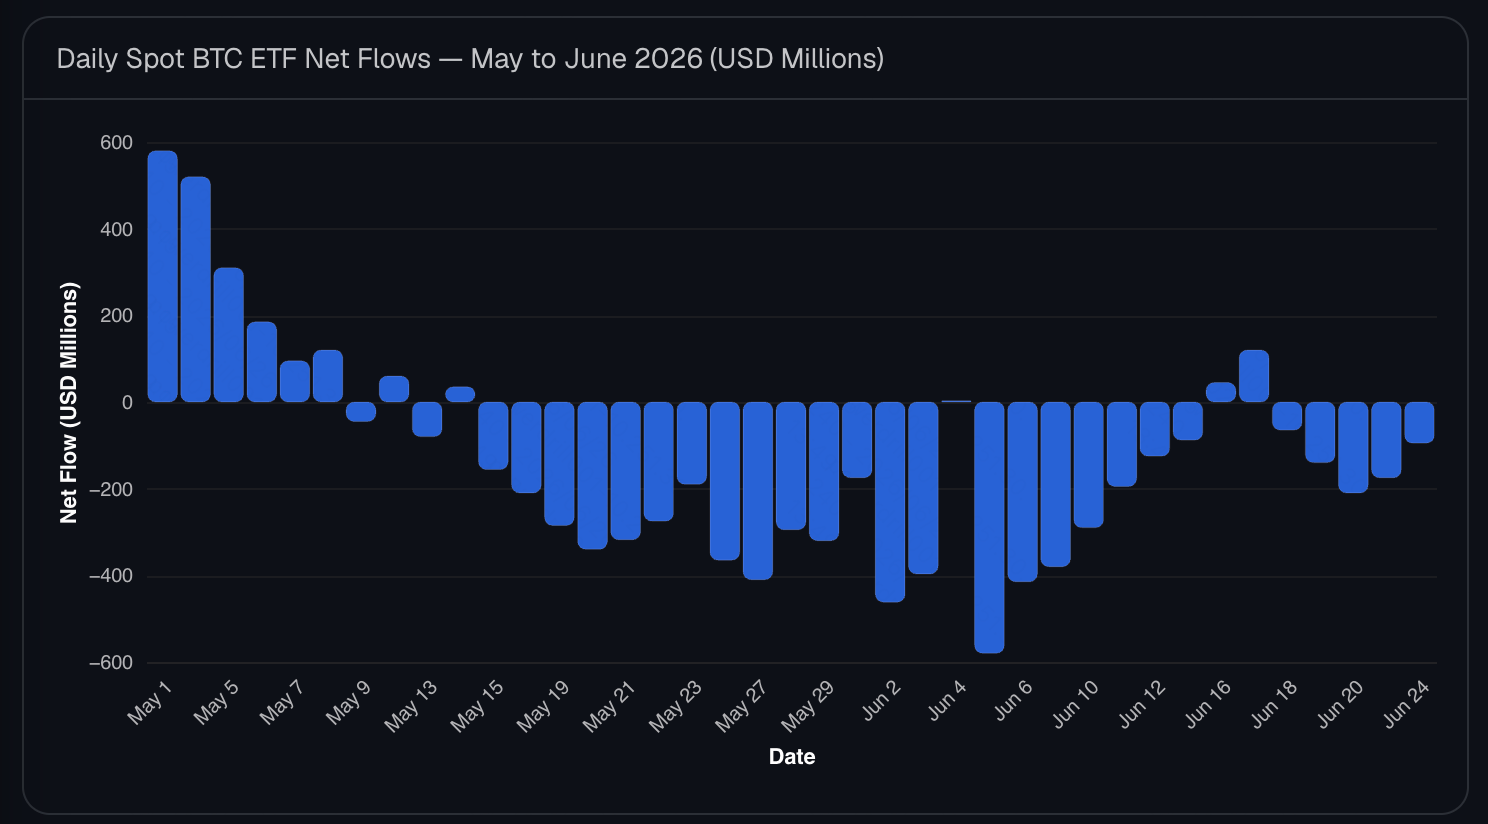
- $4.33 Billion: A soma colossal retirada dos Spot BTC ETFs ao longo de 13 dias consecutivos recordes.
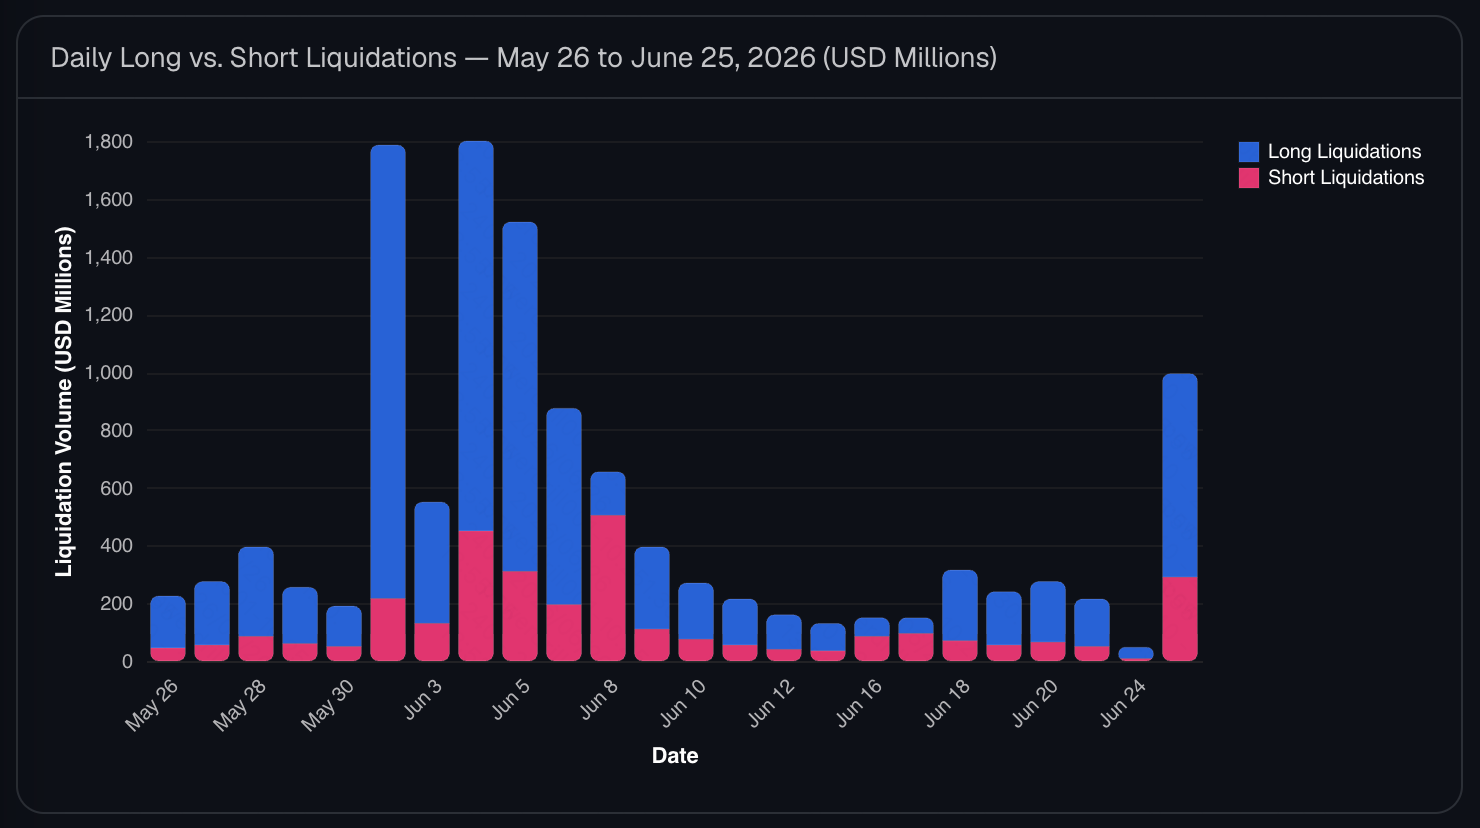
- $4.56 Billion: O valor total das liquidações em todo o mercado cripto nos últimos 30 dias.
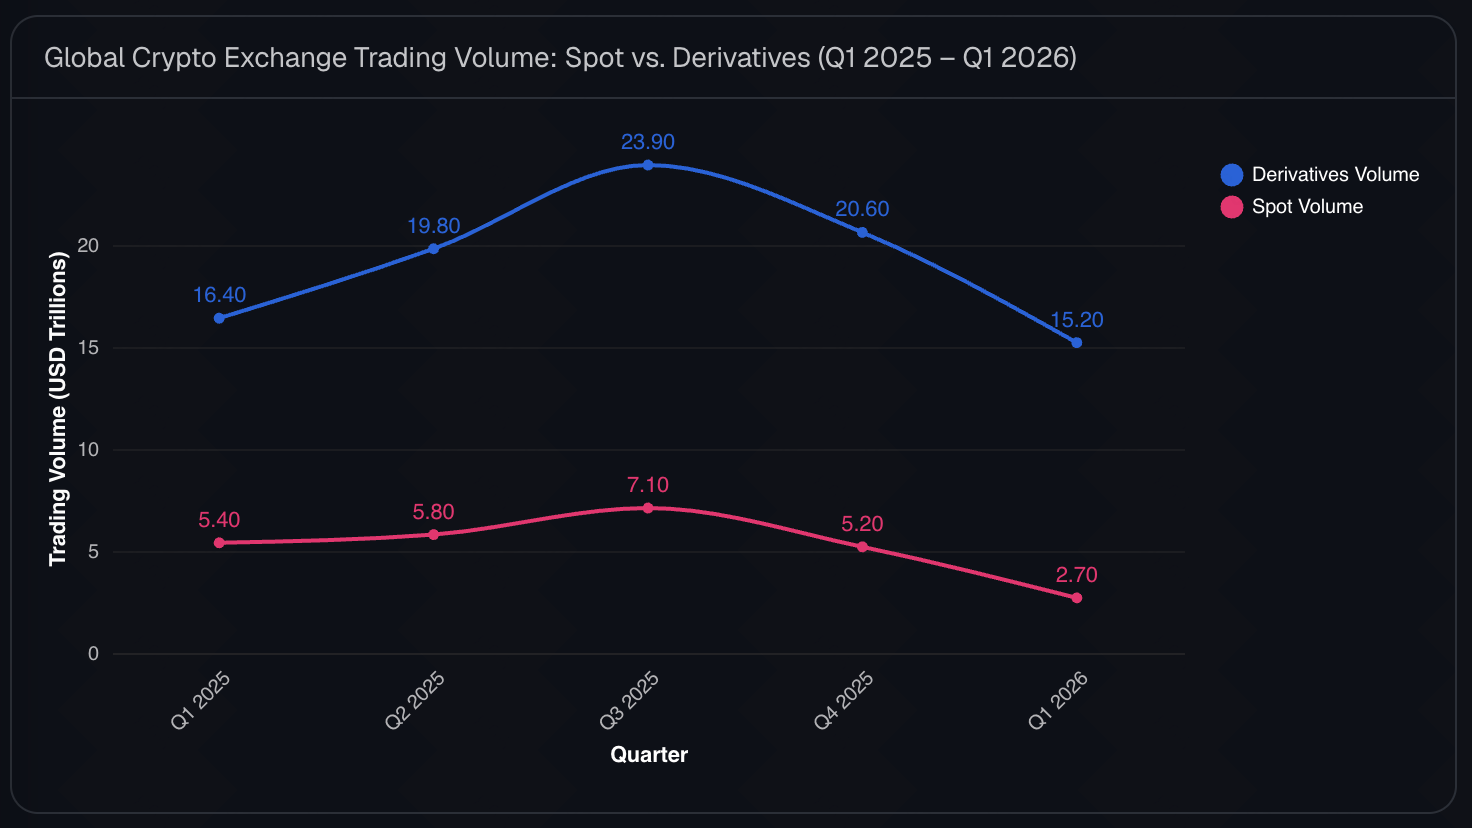
- -42%: A queda no volume trimestral de negociação em comparação com o pico do Q3 2025.
- 13/100: O Crypto Fear & Greed Index despencou para “Medo extremo”, marcando o menor sentimento de mercado desde o mercado de baixa de 2022.
Resumindo: O crash cripto de junho de 2026 não foi apenas uma correção técnica — foi uma desalavancagem estrutural impulsionada pela fuga de capital em direção à IA e pela mudança nas expectativas macroeconômicas.
Um pouco de contexto
Um ano atrás, a narrativa era guiada pela adoção institucional, pelas entradas nos Spot ETFs e pela euforia pós-halving. O Bitcoin disparou para uma ATH de $126,296 em outubro de 2025.
Mas até junho de 2026, a conversa havia mudado drasticamente. A combinação de inflação persistente, políticas restritivas dos bancos centrais e um inegável “efeito de vácuo” do mercado de ações de IA em forte alta drenou a liquidez dos ativos de risco. Para mostrar o quão grave é essa correção de mercado, reunimos os números e deixamos os dados contarem a história.
Sobre o conjunto de dados
Este relatório se baseia em dados on-chain publicamente disponíveis, métricas de exchanges e relatórios de fluxo institucional cobrindo o início e meados de 2026. As fontes incluem rastreadores de entrada/saída de ETFs, as liquidações de derivativos da Coinglass, o Alternative.me para o sentimento de mercado e as principais plataformas de análise on-chain. Os números são aproximados e arredondados para facilitar a leitura.
Sobre a ferramenta
Cada gráfico deste relatório foi gerado com o Powerdrill Bloom, um agente de análise de dados AI-first. Fizemos o upload da planilha bruta de métricas de mercado, e o Bloom a limpou, sugeriu caminhos de exploração e produziu automaticamente os gráficos abaixo — sem SQL, sem Python, sem formatação manual. Se você quiser explorar os mesmos dados por conta própria, conheça nossa ferramenta de visualização de dados com IA.
Principais conclusões
- As instituições estão dando uma pausa. Os Spot ETFs registraram sua mais longa sequência de saídas consecutivas desde o lançamento em janeiro de 2024.
- A alavancagem atingiu o ponto de ebulição. O índice de alavancagem disparou para 2.63% antes de uma zeragem histórica cortar o Open Interest pela metade.
- O volume está secando. Tanto os volumes à vista quanto os de derivativos estão encolhendo, indicando que os traders estão deixando o mercado por completo em vez de girar capital.
- As baleias estão capitulando. Mega-carteiras, distribuições da Mt. Gox e até crentes convictos como a MicroStrategy foram flagrados vendendo.
- Os fatores macro estão no comando. Ações e IPOs de IA estão absorvendo a liquidez, enquanto a inflação persistente adia ainda mais os cortes de juros.
O crash cripto global: a análise completa dos dados
1. Saídas de ETFs: 13 dias de sangria ($4.33B)
Desde o seu lançamento em janeiro de 2024, os Spot BTC ETFs foram um pilar da força do mercado. Essa sequência foi violentamente rompida em junho de 2026. O mercado testemunhou 13 dias de pregão consecutivos de saídas, sangrando um total de $4.33 billion (aproximadamente 59,400 BTC). Só o IBIT da BlackRock registrou uma saída de $980 million em uma única semana. Para piorar, a Morgan Stanley liquidou totalmente sua posição de 8,300 BTC.
2. Índice de alavancagem: pico em 2.63%
O mercado ficou perigosamente concentrado no topo. Em 2 de junho, o índice de alavancagem dos futuros atingiu 2.63%, o nível mais alto visto desde a ATH de outubro de 2025. O que se seguiu foi uma desmontagem brutal: o Open Interest (OI) total despencou de $56 billion para $25 billion (uma mínima de 6 meses), e a base de arbitragem foi agressivamente comprimida de 12% para apenas 4-5%.
3. Liquidações: $4.56B varridos em 30 dias
O processo de desalavancagem foi incrivelmente doloroso para os traders excessivamente alavancados. Nos últimos 30 dias, ocorreram $4.56 billion em liquidações totais. O clímax foi em 4 de junho, que viu impressionantes $1.8 billion liquidados em um único dia. Desses, 75% ($1.35 billion) eram posições compradas, com a maior ordem de liquidação individual chegando a $402 million.
4. Volume das exchanges: -32% no trimestre
Os traders não estão apenas vendendo; estão indo embora. O volume total de negociação no Q1 2026 ficou em $17.9 trillion — uma queda de 32% em relação ao trimestre anterior, e uma queda enorme de 42% em relação ao pico do Q3 2025 de $31 trillion. Fundamentalmente, tanto os mercados à vista quanto os de derivativos encolheram de forma sincronizada, sinalizando um verdadeiro êxodo de liquidez em vez de uma rotação setorial.
5. Venda das baleias: mais de 36,000 BTC despejados
Os pesos-pesados se desfizeram de suas posições. Carteiras que detêm entre 10,000 e 1,000,000 BTC venderam líquido mais de 36,000 BTC em uma única semana. Simultaneamente, a Mt. Gox transferiu 10,422 BTC (avaliados em cerca de $739 million). O mais chocante: a MicroStrategy — famosa por sua filosofia de “nunca vender” — quebrou sua própria regra ao vender 32 BTC, desferindo um pesado golpe psicológico na confiança do mercado.
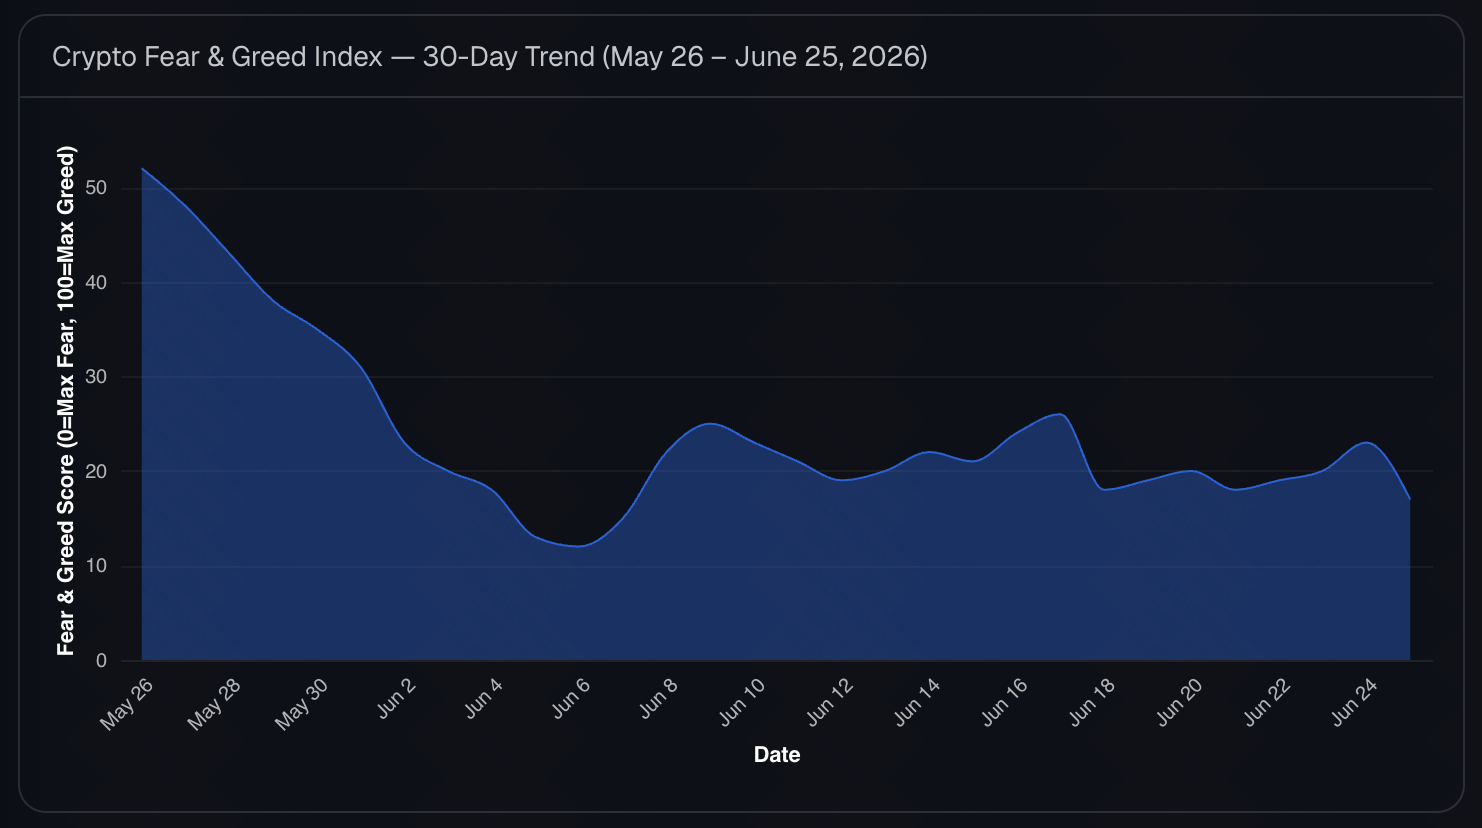
6. Fear & Greed Index: Medo extremo em 13
A psicologia do mercado virou completamente. Em junho, o Crypto Fear & Greed Index tocou uma mínima de 13 (“Medo extremo”), com uma média de 7 dias de apenas 20 (atualmente oscilando em torno de 23-24). O Relative Strength Index (RSI) está na faixa de 39-50. No geral, o sentimento de mercado está no ponto mais baixo desde as profundezas do mercado de baixa de 2022.
7. Ventos contrários macro: juros, petróleo e o vácuo da IA
A cripto não está caindo no vácuo. O Deutsche Bank atualizou recentemente sua previsão para incluir duas altas de juros em 2026 devido à inflação teimosamente persistente. O conflito entre EUA e Irã elevou os preços do petróleo, complicando ainda mais as perspectivas de inflação. Enquanto isso, o capital de varejo e institucional está girando ativamente para fora da cripto e se despejando nos mercados em franca expansão de ações e IPOs de IA.
O que isso significa para traders e analistas (o lado positivo)
Para gestores de risco e analistas, os dados podem parecer sombrios, mas há um nítido lado positivo: o mercado está totalmente limpo.
A zeragem histórica da alavancagem é tradicionalmente um pré-requisito para uma reversão de mercado. Vimos um reset de OI muito parecido em fevereiro, que foi seguido por um rali de $7,000 no Bitcoin em apenas 3 semanas. Além disso, enquanto as baleias de médio porte e as instituições entravam em pânico, os dados on-chain mostram que algumas mega-baleias do dinheiro inteligente estão começando a acumular na contramão. O risco de transição mudou de “até onde podemos cair” para “quem está comprando o fundo”.
Como fizemos esses gráficos (em um clique)
Você não precisa de uma equipe de dados para produzir um relatório de mercado como este. Aqui está o fluxo de trabalho exato:
- Escolha um tópico ou habilidade e depois faça o upload dos seus dados. Faça o upload de um arquivo CSV ou Excel contendo fluxos de exchanges, atividade de ETFs e números de liquidação no Powerdrill Bloom, e deixe a IA cuidar da análise.
- Deixe o canvas explorar. O Bloom limpa os dados automaticamente e sugere três caminhos inteligentes de exploração — tendências, quebras de volume, correlações — e então gera os gráficos para você.
- Exporte para slides. Transforme todo o canvas em uma apresentação refinada e pronta para uso e exporte para o PowerPoint com um clique.
Sem SQL. Sem Python. Sem copiar e colar gráficos em slides. Quer experimentar no seu próprio conjunto de dados? Experimente o Powerdrill Bloom gratuitamente.
FAQ
Quanto o Bitcoin caiu em relação ao seu pico?
O Bitcoin caiu abaixo de $59,000 em junho de 2026, marcando uma queda de 53% em relação à sua máxima histórica de outubro de 2025 de $126,296.
Por que os BTC ETFs estão registrando saídas tão massivas?
Uma combinação de ventos contrários macroeconômicos — como o adiamento dos cortes de juros e os temores de inflação — junto com a rotação de capital para ações de IA, levou os investidores tradicionais a reduzir o risco.
Este é o começo de um novo mercado de baixa?
Embora as métricas de curto prazo apontem para uma severa desalavancagem, zeragens extremas de alavancagem como a que vimos (OI caindo de $56B para $25B) historicamente serviram como fundos locais e precursoras de fortes recuperações.
Posso analisar meus próprios dados de trading de cripto assim?
Sim. Faça o upload de um arquivo CSV ou Excel no Powerdrill Bloom e ele limpará os dados, construirá os gráficos e permitirá que você exporte uma apresentação — sem necessidade de programação.
Conclusão
As sete métricas por trás do crash cripto de junho de 2026 contam uma história clara: o mercado voou perto demais do sol com alta alavancagem, e um cenário macroeconômico em transformação forçou um reset violento. Com $4.56 billion varridos e os fluxos institucionais de ETFs se revertendo, a espuma especulativa oficialmente acabou. As perguntas interessantes agora são se esse reset de OI prepara o terreno para uma recuperação no Q3 e quão cedo o capital voltará a girar do setor de IA.
Curioso sobre o que seus dados de trading estão escondendo? Faça o upload deles no Powerdrill Bloom e deixe os gráficos contarem a história.