How to Automate Data Reporting from Excel with Powerdrill AI

Introduction
Manually creating data reports from Excel can be a frustrating and time-consuming task. It often involves processing large datasets, performing repetitive calculations, and meticulously formatting tables and charts. These tasks are not only tedious but also prone to human error, which can compromise decision-making.
With advancements in AI, data reporting has been revolutionized, enabling users to focus on insights rather than manual work. In this guide, we’ll explore how Powerdrill simplifies data reporting from Excel files in just one click.
Understanding Automated Data Reporting
What is Automated Data Reporting?
Automated data reporting refers to the use of advanced technologies, such as artificial intelligence (AI) and machine learning, to streamline the process of creating structured, insightful reports from raw data. Unlike traditional reporting methods that rely heavily on manual calculations and formatting, automation enables organizations to:
Save Time: Generate reports within minutes, reducing the hours spent on manual work.
Enhance Accuracy: Minimize the risk of human error in calculations and data interpretation.
Ensure Consistency: Maintain uniformity in report structures and formats.
Gain Insights: Leverage AI to uncover trends, patterns, and anomalies that might otherwise go unnoticed.
By integrating natural language processing and machine learning, automated reporting tools can also interpret complex datasets, recommend the best visualizations, and customize reports to suit specific needs. This makes it an invaluable asset for businesses looking to improve efficiency and decision-making.
Popular Automated Data Reporting Tools
Powerdrill: Offers comprehensive AI-driven data analysis and reporting features.
Tableau: Focuses on interactive visualizations but requires manual setup.
Microsoft Power BI: Provides robust reporting capabilities but can involve a learning curve for automation.
Step-by-Step Guide to Automate Data Reporting with Powerdrill
To ensure that all the information can be viewed by all, we select a public dataset from WorldBank. You can download the dataset from the following link: https://datacatalog.worldbank.org/search/dataset/0038015?version=10
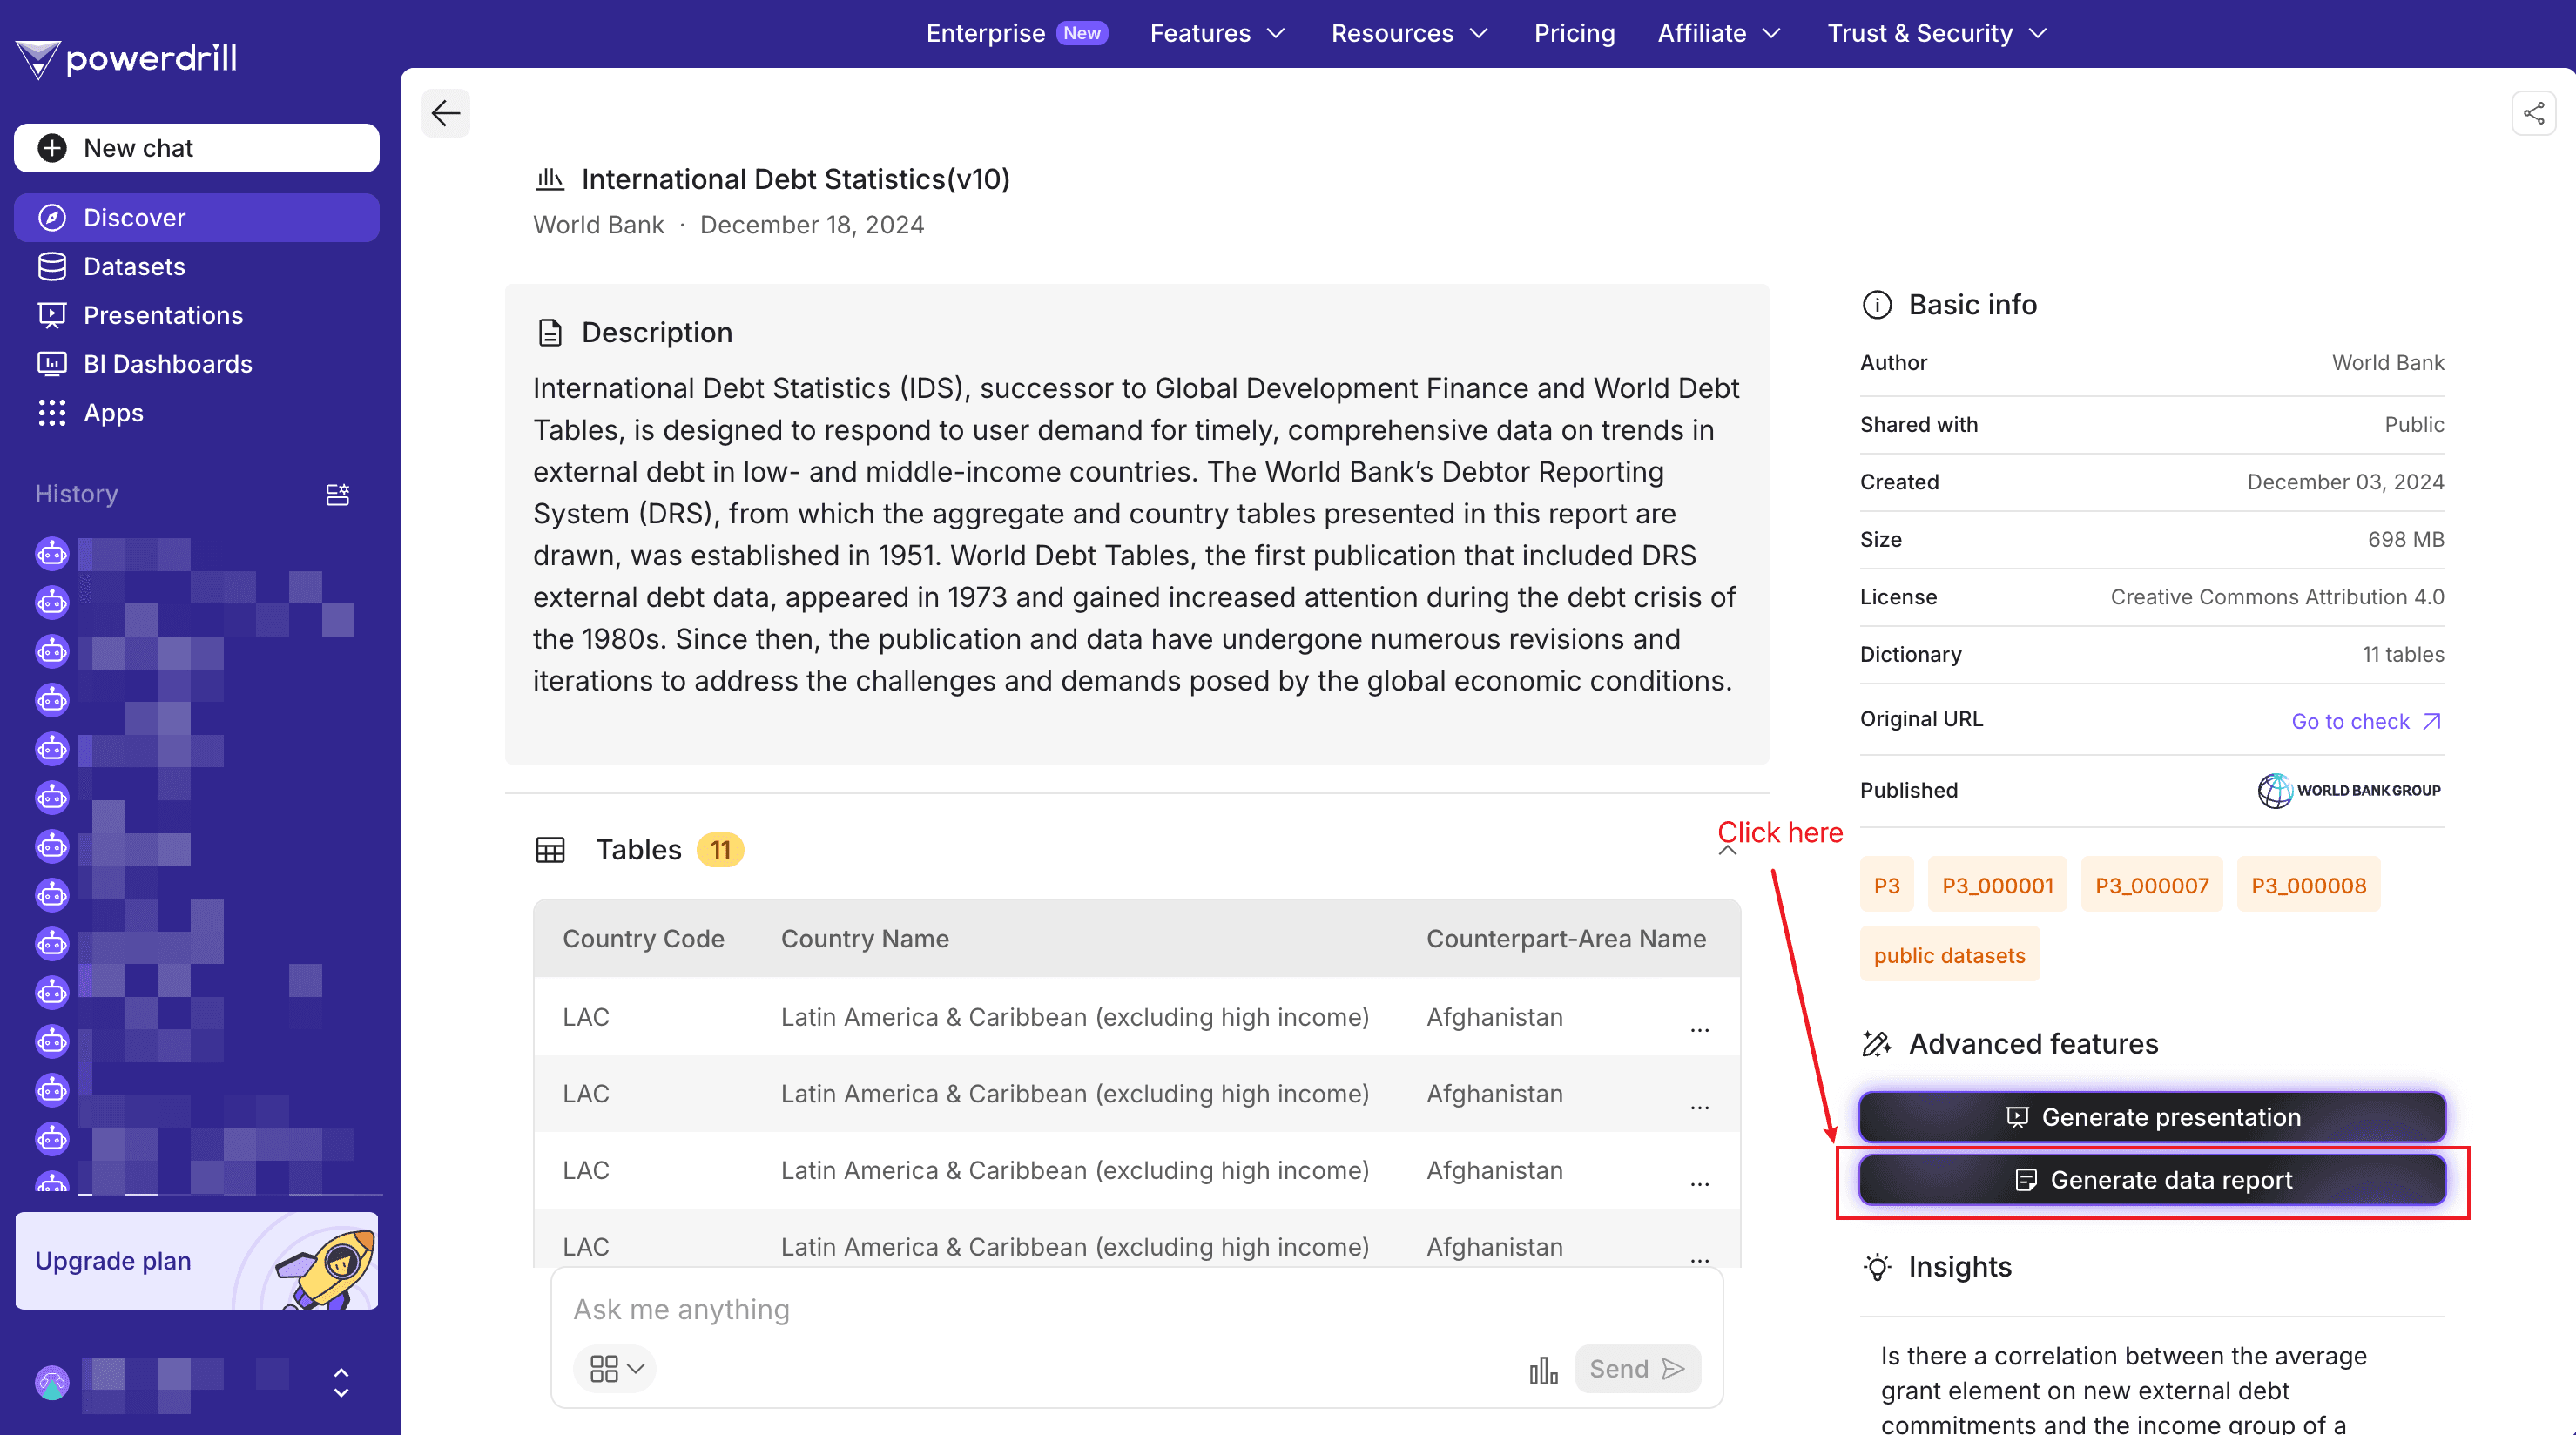
Or you can just visit our discover channel to streamline your test process. When choosing this method, you don't need to perform the following procedure but just click the Generate data report button.
Step 1. Upload your Excel data
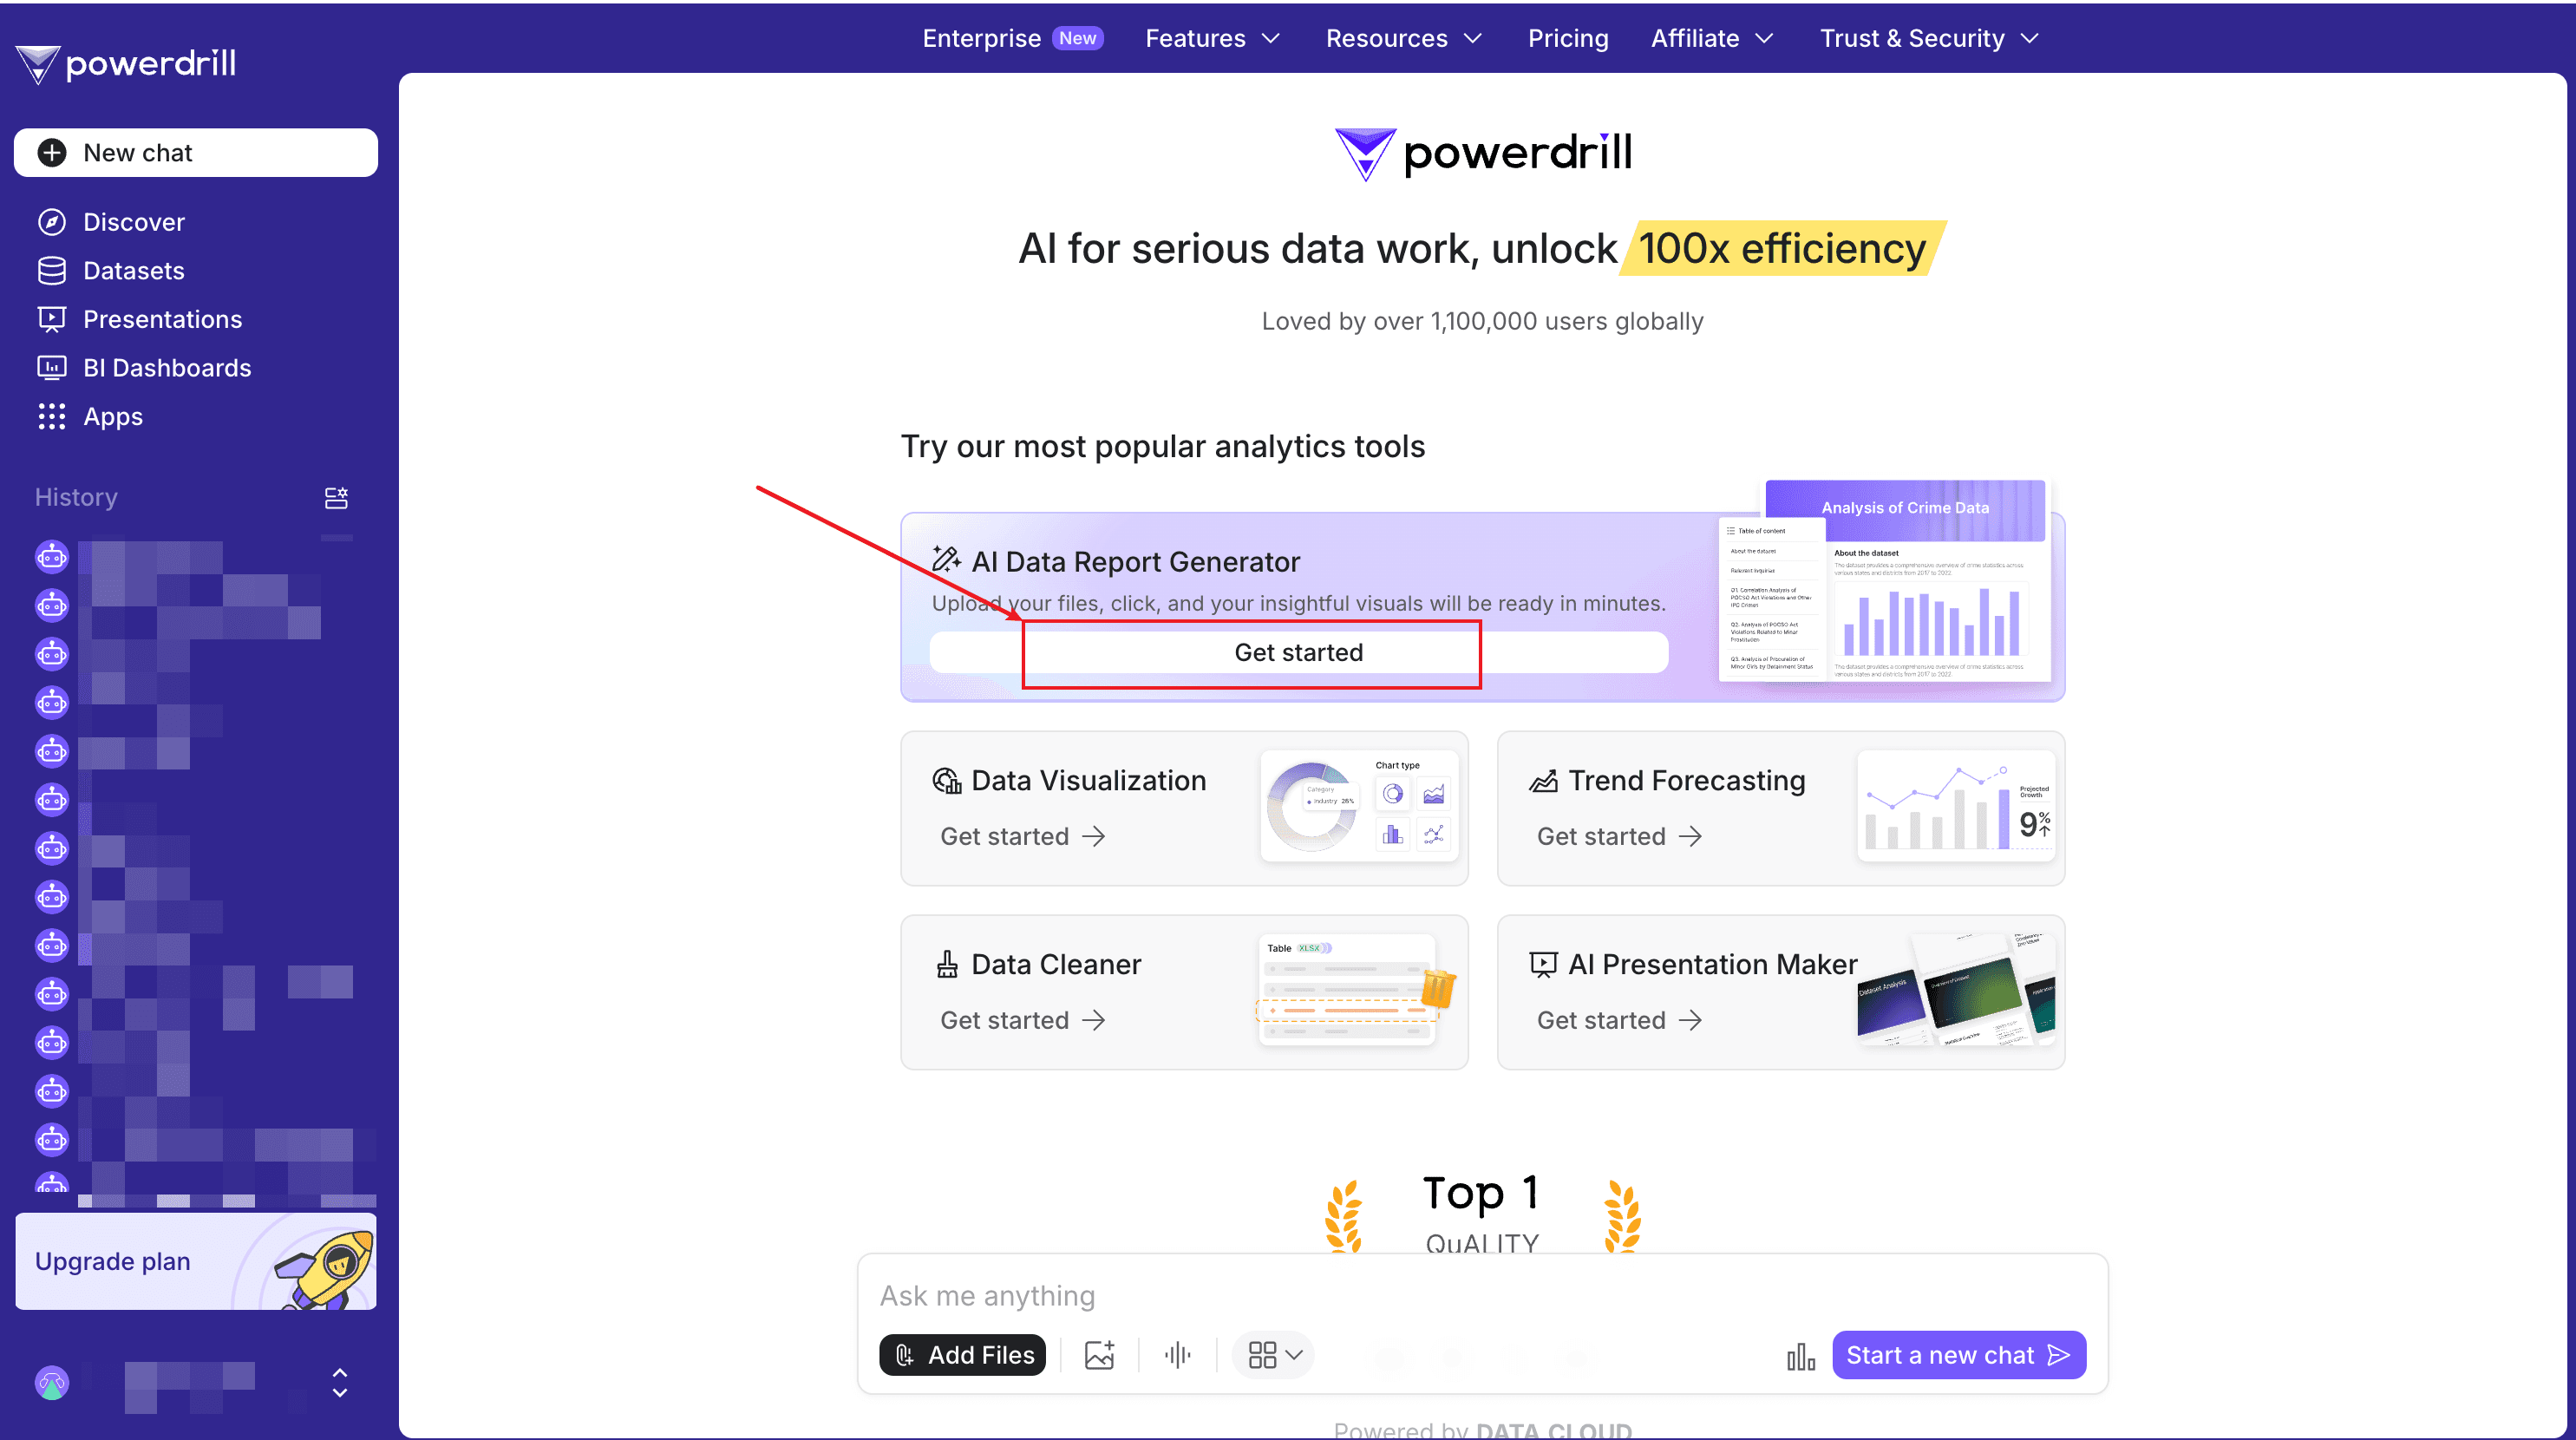
After signing in to Powerdrill, locate the AI Data Report Generator agent, click Get started, and upload your Excel files.
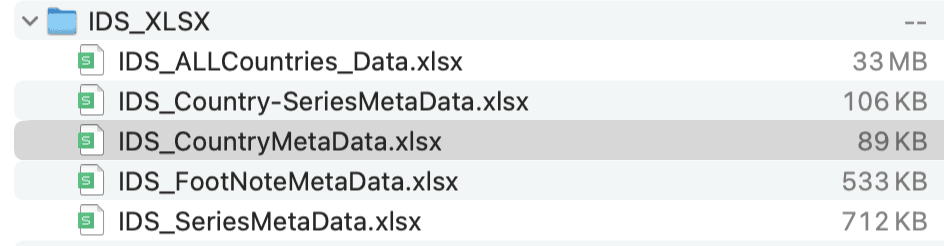
You can upload up to 10 Excel/CSV/TSV files at a time. In this dataset example, we upload 5 files.
Step 2. Wait for the reporting completes
Wait for 1 to 2 minutes, then your data report is ready to take away.

FAQ
Can I use Powerdrill with multiple files?
Yes, Powerdrill supports uploading up to 10 Excel/CSV/TSV files simultaneously.
What types of insights can I generate?
Powerdrill provides insights on trends, distributions, and key metrics tailored to your dataset.
Is the tool suitable for non-technical users?
Absolutely! Powerdrill's intuitive interface and AI-powered automation make it user-friendly for everyone.
Final Words
Powerdrill’s AI-driven capabilities empower you to transform raw data into actionable insights effortlessly. By automating data reporting, you can eliminate manual tasks, reduce errors, and focus on decision-making. Start your journey with Powerdrill today and revolutionize how you handle data reporting!
If you're interested in the report details, see the attachment below.
Attachment: Comprehensive Overview of International Debt and Economic Indicators
Following is the content abstracted from the report.
What are the most common Series Codes associated with each Country Code in the IDS_Country-SeriesMetaData.csv dataset?
Analysis of Series Codes
Data Grouping: The dataset was grouped by 'Country Code' and 'Series Code' to count occurrences.
Most Common Series: The most frequent Series Code for each Country Code was identified.
Visualization Insights
Bar Chart Representation: A bar chart visualizes the frequency of Series Codes for each country.
Dominant Series Code: The chart highlights the most common Series Codes across different countries.
Conclusion and Insights
Common Series Code: The Series Code (Population, total) is the most common across all countries.
Key Metric: Population data is a key metric collected consistently across the dataset, indicating its importance in global data collection efforts.
How does the income group distribution vary across different regions in the IDS_CountryMetaData_table_0.csv dataset?
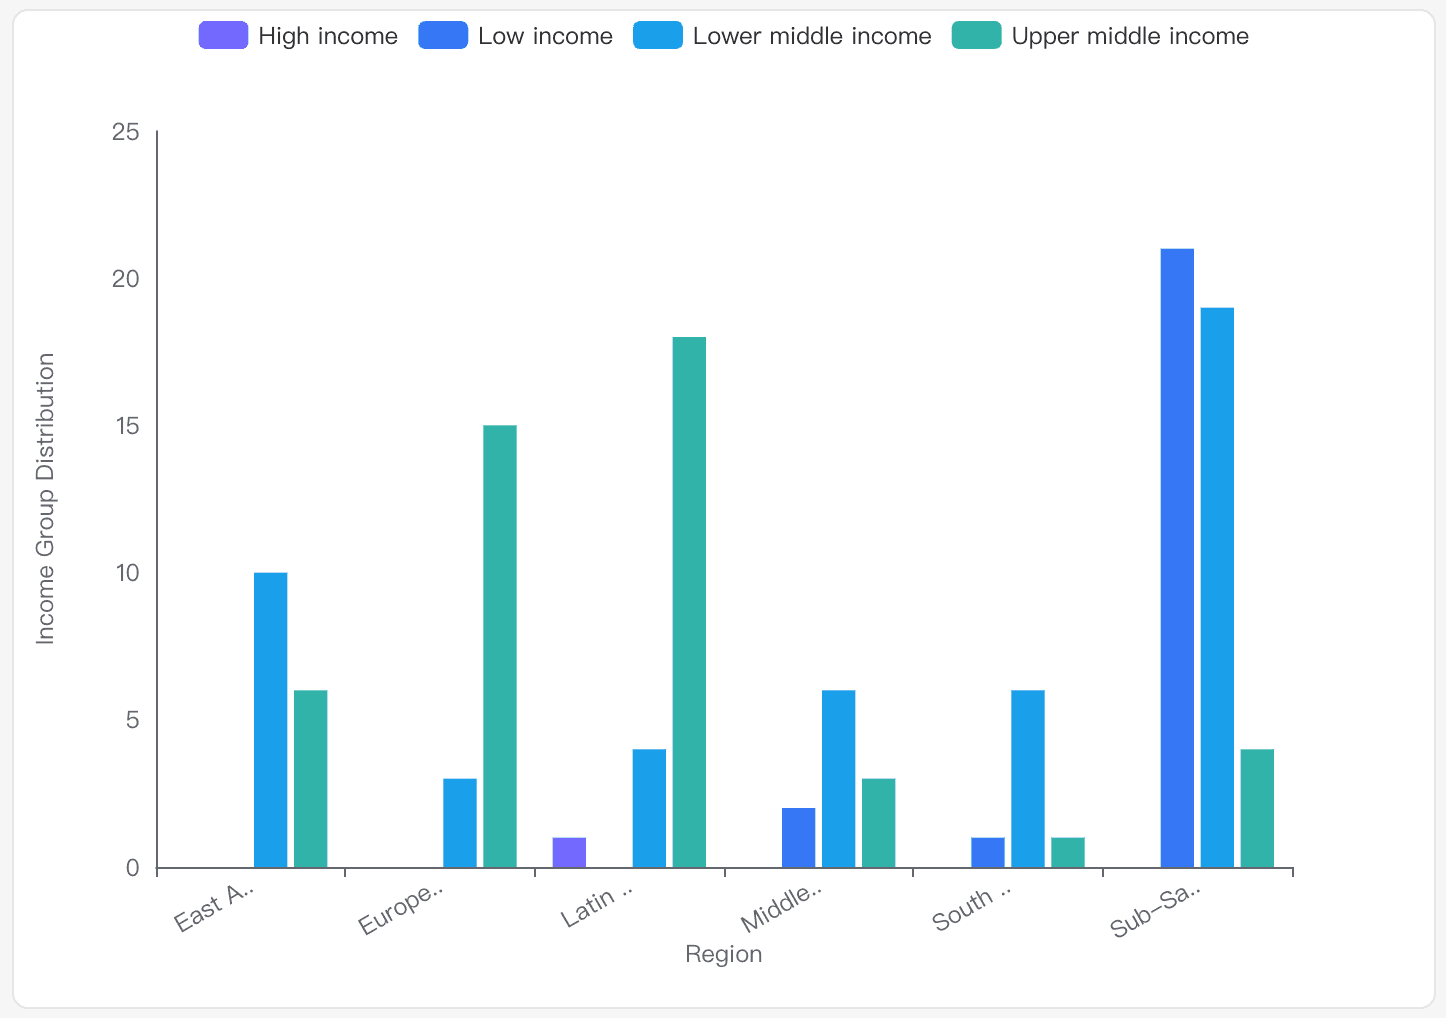
Overview
Low Income: Predominantly found in Sub-Saharan Africa and South Asia. This group has the highest count in Sub-Saharan Africa with 21 occurrences.
Lower Middle Income: Spread across all regions, with significant representation in South Asia, Sub-Saharan Africa, and East Asia & Pacific.
Upper Middle Income: Common in Europe & Central Asia, Latin America & Caribbean, and East Asia & Pacific.
High Income: Least represented, with occurrences mainly in Latin America & Caribbean.
Visual Representation
The bar chart illustrates the distribution, highlighting the dominance of lower income groups in regions like Sub-Saharan Africa and the prevalence of upper middle income in Europe & Central Asia.
Detailed Analysis
South Asia: Primarily lower middle income countries.
Europe & Central Asia: Predominantly upper middle income.
Middle East & North Africa: Mix of lower and upper middle income.
Sub-Saharan Africa: High concentration of low income countries.
East Asia & Pacific: Mix of lower and upper middle income.
Latin America & Caribbean: Mostly upper middle income, with some high income countries.
Conclusion and Insights
Regional Variations: Income group distribution varies significantly, with certain regions having a higher concentration of specific income groups.
Economic Diversity: The dataset reflects economic diversity, with regions like Sub-Saharan Africa having more low income countries, while Europe & Central Asia and Latin America & Caribbean have more upper middle income countries.
Analyze the potential factors that could influence the timing of the 'Latest population census' and 'Latest trade data' in different countries. How might these factors affect the correlation between these two variables?
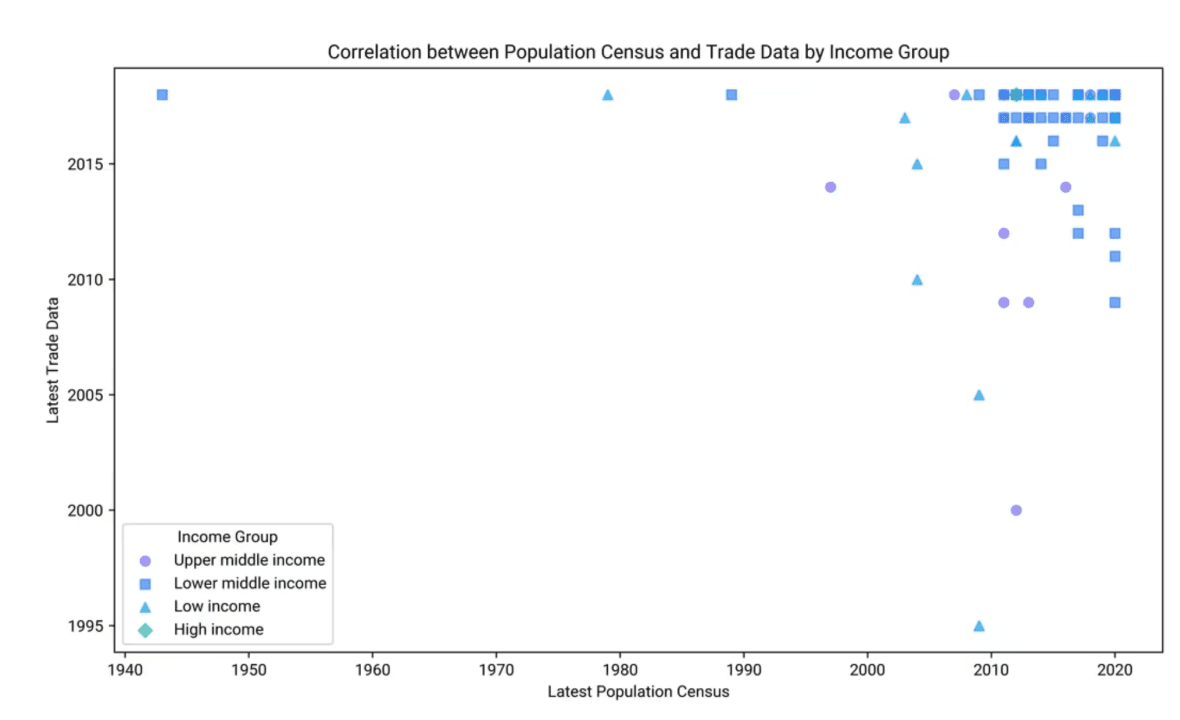
Factors Influencing the Timing of the Latest Population Census
Economic Resources: Countries with more resources can conduct censuses more frequently, while those with fewer resources may face irregular schedules.
Political Stability: Stability allows for regular censuses, whereas conflict can cause delays.
Technological Capacity: Advanced technology enables more efficient and frequent censuses.
Policy and Governance: Government priorities can dictate the regularity of censuses.
International Support: Guidelines and support from organizations can influence timing, especially in developing countries.
Factors Influencing the Timing of the Latest Trade Data
Economic Activity: High trade activity necessitates frequent data updates.
Data Collection Infrastructure: Robust systems allow for more current data.
Regulatory Environment: Compliance with trade agreements can affect data frequency.
Global Economic Integration: Integration into the global economy may lead to more frequent data collection.
Statistical Capacity: The ability of national offices to manage data impacts timing.
Correlation Between Population Census and Trade Data Timing
Resource Allocation: More resources can lead to frequent updates for both census and trade data, creating a positive correlation.
Policy Prioritization: Countries prioritizing data-driven policies may synchronize data collection efforts.
Technological Advancements: Efficient management of both data types can lead to correlated timing.
External Influences: International requirements may improve both data collection processes.
Economic Development Stage: Developed countries may have more regular updates, while developing countries may not.
Conclusion and Insights
Resource and Policy Impact: Economic resources and policy priorities are key in determining the frequency and correlation of data updates.
Technological and External Factors: Advanced technology and international influences can enhance the synchronization of data collection efforts.
What are the trends in the 'External debt stocks, total' Series Code for different countries over time in the IDS_Country-SeriesMetaData.csv dataset?
Data Sources and Estimations
Country Reports and Estimates: Many countries' data for 2023 are based on national reports or World Bank staff estimates. For example, Afghanistan's data includes World Bank staff estimates, while Angola's data is sourced from the National Bank of Angola.
Types of Debt Included
Debt Categories: The dataset distinguishes between long-term public and publicly guaranteed debt, long-term private nonguaranteed debt, and short-term debt. Argentina's data, for instance, includes both long-term public and private nonguaranteed debt.
Historical Context and Adjustments
Debt Restructuring and Relief: Some countries have historical adjustments due to debt restructuring agreements, such as Burundi's Paris Club agreements and HIPC and MDRI debt relief.
Participation in Debt Relief Initiatives
Debt Service Suspension Initiative (DSSI): Several countries participated in the DSSI in 2020 and 2021, affecting reported debt levels.
Regional and Economic Group Trends
Income Group Variations: Trends vary significantly across regions and income groups, with low-income countries often involved in more debt relief initiatives.
Specific Country Trends
China and Ethiopia: China's data relies on World Bank estimates and national reports, while Ethiopia's data reflects debt reduction through HIPC and MDRI relief.
Data Limitations and Exclusions
Incomplete Data: Some countries have incomplete data or exclusions, such as Iraq's missing long-term private non-guaranteed debt data.
Conclusion and Insights
Mixed Data Sources: The trends show a mix of reliance on national reports, World Bank estimates, and international debt relief initiatives.
Variability Across Regions: There are significant variations in external debt trends across different regions and income groups, influenced by economic conditions and historical agreements.
What is the distribution of 'Income Group' across different 'Lending categories' in the IDS_CountryMetaData_table_0.csv dataset?
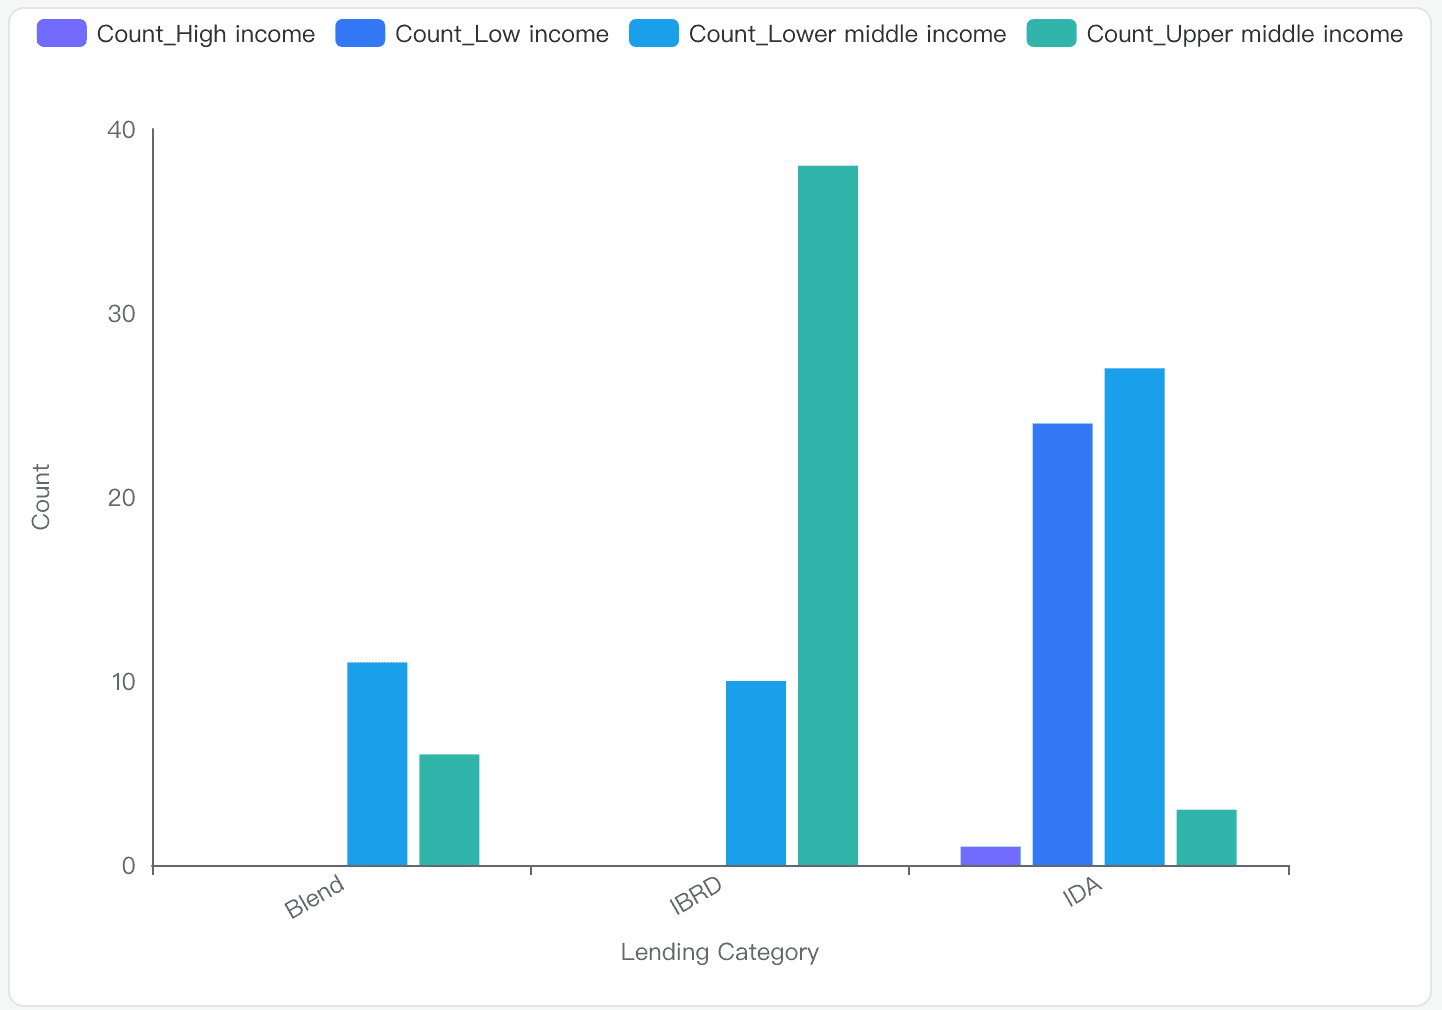
Data Analysis
Income Groups: The dataset includes 'High income', 'Low income', 'Lower middle income', and 'Upper middle income'.
Lending Categories: The categories are 'IDA', 'Blend', and 'IBRD'.
Count Statistics: The counts range from 1 to 38, with a mean of 15.
Visualization Insights
IDA: Predominantly consists of 'Low income' and 'Lower middle income' groups.
IBRD: Mainly includes 'Upper middle income' countries.
Blend: Has a mix of 'Lower middle income' and 'Upper middle income' groups.
Detailed Distribution
IDA:
Low income: 24
Lower middle income: 27
Upper middle income: 3
High income: 1
IBRD:
Low income: 0
Lower middle income: 10
Upper middle income: 38
High income: 0
Blend:
Low income: 0
Lower middle income: 11
Upper middle income: 6
High income: 0
Conclusion and Insights
IDA Category: Primarily serves 'Low income' and 'Lower middle income' countries.
IBRD Category: Dominated by 'Upper middle income' countries.
Blend Category: A balanced mix of 'Lower middle income' and 'Upper middle income' groups.
Are there any notable differences in the 'System of National Accounts' methodology used by countries in different regions in the IDS_CountryMetaData_table_0.csv dataset?
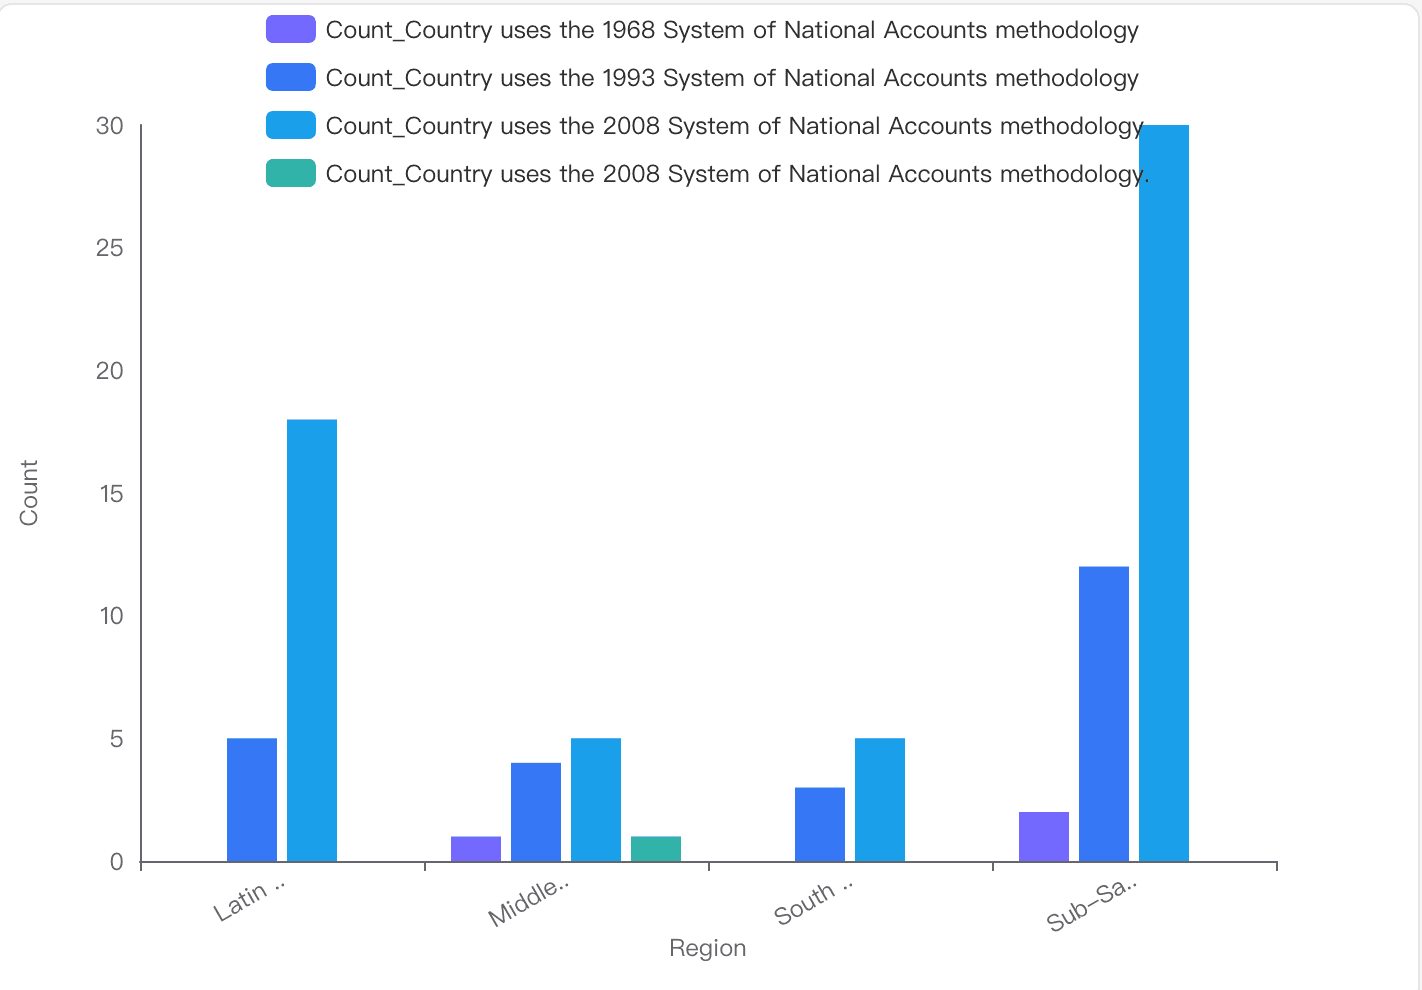
Methodology Distribution
1993 System of National Accounts: Used by countries across various regions, including South Asia, Sub-Saharan Africa, and East Asia & Pacific.
2008 System of National Accounts: Predominantly used in Europe & Central Asia, Latin America & Caribbean, and East Asia & Pacific.
1968 System of National Accounts: Less common, but still in use in regions like the Middle East & North Africa.
Visualization Insights
Sub-Saharan Africa: Shows a significant number of countries using the 2008 SNA, with some still using the 1993 and 1968 versions.
Latin America & Caribbean: Primarily uses the 2008 SNA, indicating a more uniform adoption of the latest methodology.
Middle East & North Africa: Displays a mix, with some countries still using older methodologies like the 1968 SNA.
Conclusion and Insights
Diverse Adoption: There are notable differences in the adoption of SNA methodologies across regions, reflecting varying levels of economic development and statistical capacity.
Predominance of 2008 SNA: While the 2008 SNA is widely adopted, older versions like the 1993 and 1968 SNA are still in use in specific regions, highlighting the challenges in updating statistical systems globally.
How does the 'Aggregation method' vary across different 'Topics' in the IDS_SeriesMetaData_table_0.csv dataset?
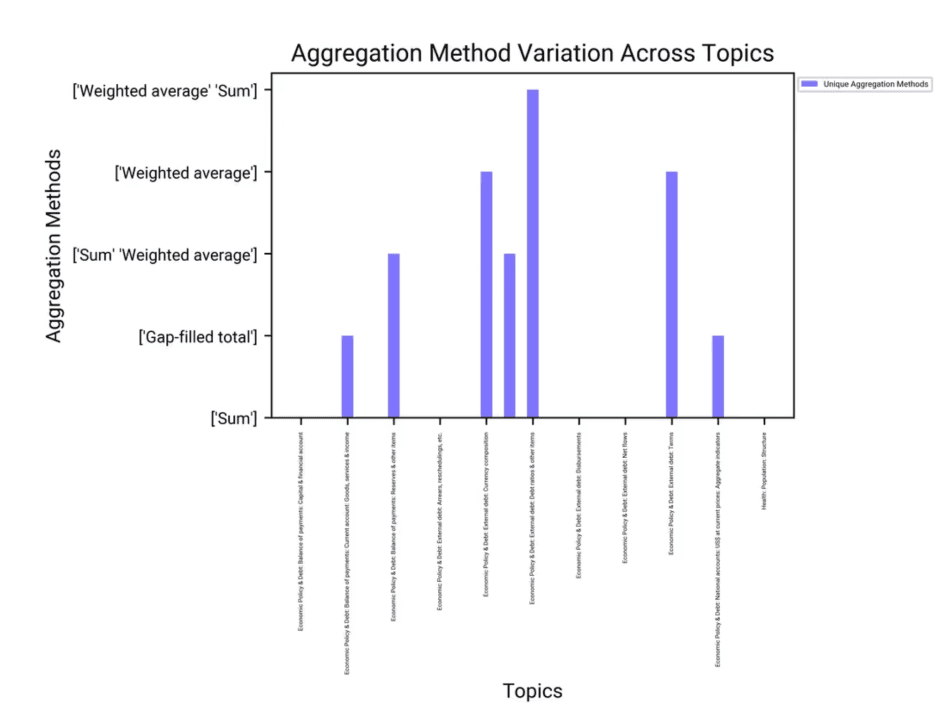
Analysis of Aggregation Methods
Sum: This is the most commonly used aggregation method across various topics, including economic policy and debt-related topics.
Weighted Average: Used in specific topics such as external debt and currency composition.
Gap-filled Total: Applied in topics related to balance of payments and national accounts.
Visualization Insights
Distribution: The bar chart shows that the 'Sum' method is prevalent across most topics, indicating its general applicability.
Specific Methods: Certain topics like external debt and currency composition utilize 'Weighted Average', highlighting the need for more nuanced aggregation in these areas.
Conclusion and Insights
Dominance of 'Sum': The 'Sum' method is widely used, suggesting it is suitable for aggregating data in many economic and health-related topics.
Specialized Methods: The use of 'Weighted Average' and 'Gap-filled Total' in specific topics indicates a tailored approach to data aggregation, reflecting the unique nature of the data in those areas.