
As we move through February 2026, I’ve been closely analyzing the factors likely to shape U.S. gasoline prices.
Using a combination of historical patterns, macroeconomic indicators, and real-time market sentiment captured through Powerdrill Bloom, it appears that the national average for regular gasoline will most likely hover around $2.90 per gallon.
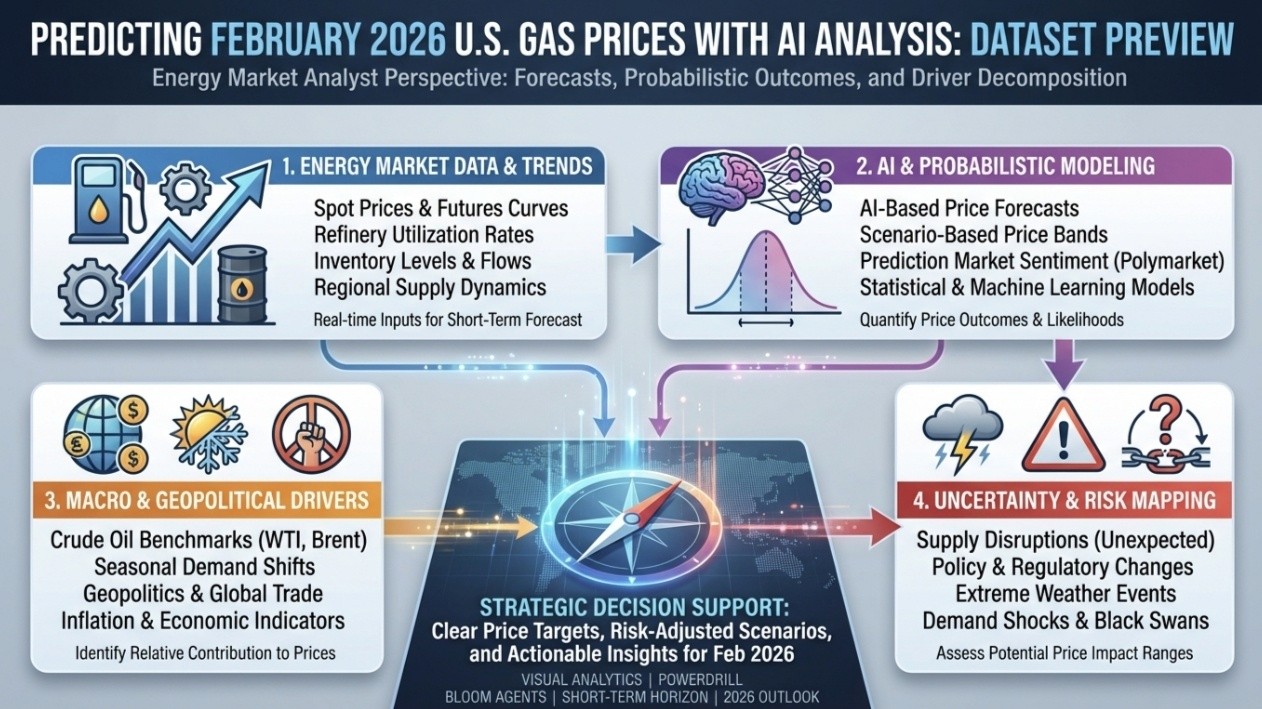
This is a Topic Preview Image generated by Powerdrill Bloom based on my question.
While this reflects my base-case scenario, the plausible range spans $2.70 to $3.10, driven by winter demand patterns and the ever-present influence of geopolitical risk on crude markets.
1. Executive Forecast: The Base Case
National Average Forecast (February 2026): $2.90/gal
Most-likely band: $2.80–$3.00/gal
From my perspective, this range represents the “modal” outcome for February. Historically, winter demand is seasonally soft, which limits the potential for dramatic price surges unless unexpected supply disruptions occur.
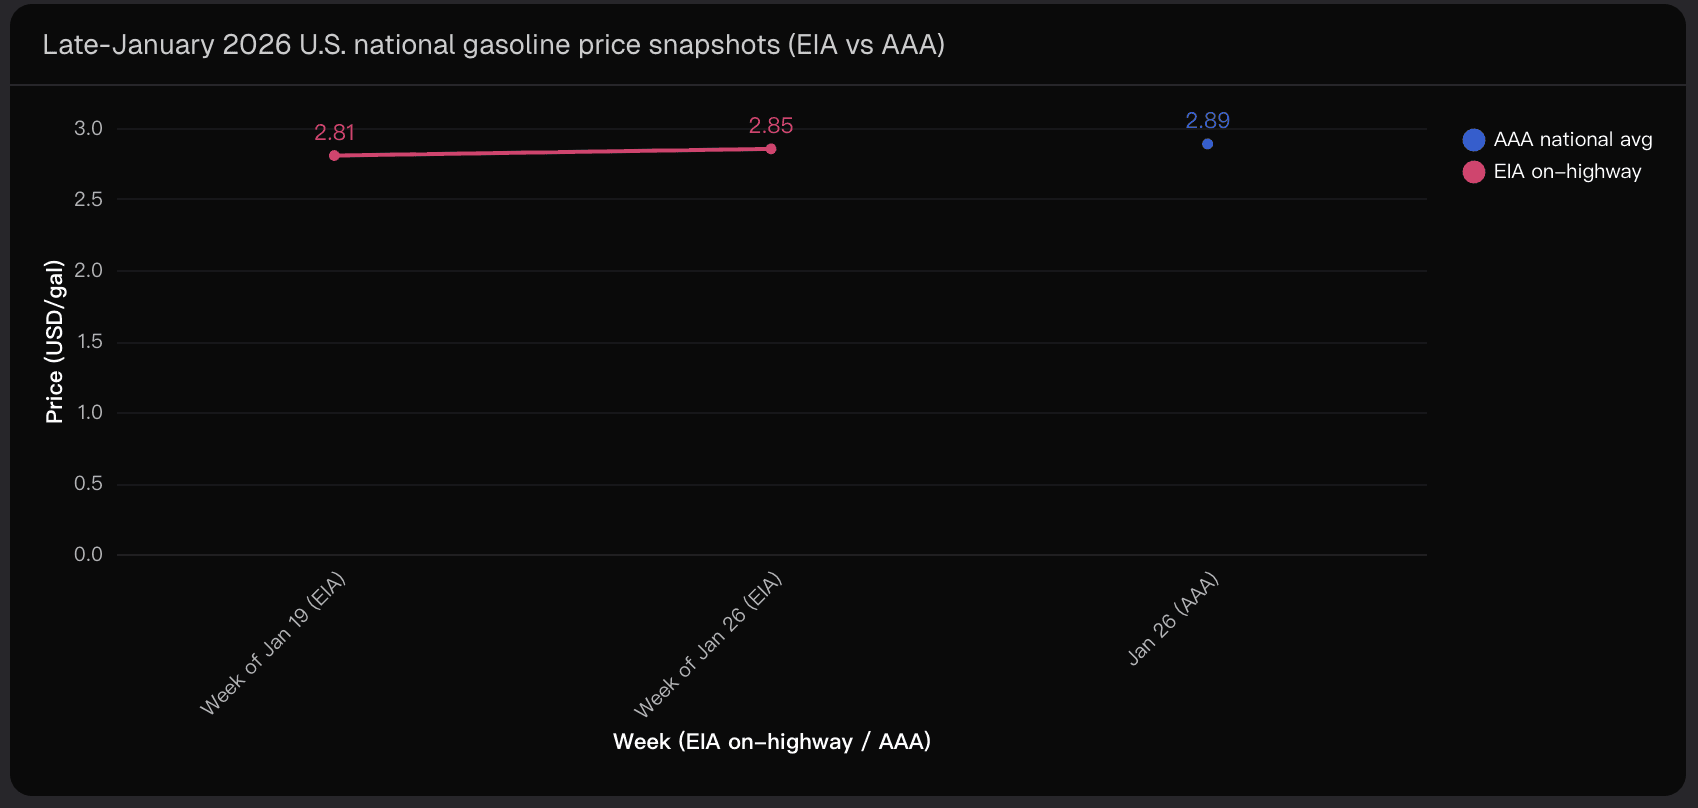
Recent late-January snapshots place prices firmly in the mid-$2.80s, suggesting that February is more likely to follow a continuation regime rather than experience a structural break.
Macro supply indicators, such as EIA-style projections, point to a generally lower crude price environment for 2026. This serves to anchor retail gasoline prices near current levels unless a risk shock materializes.
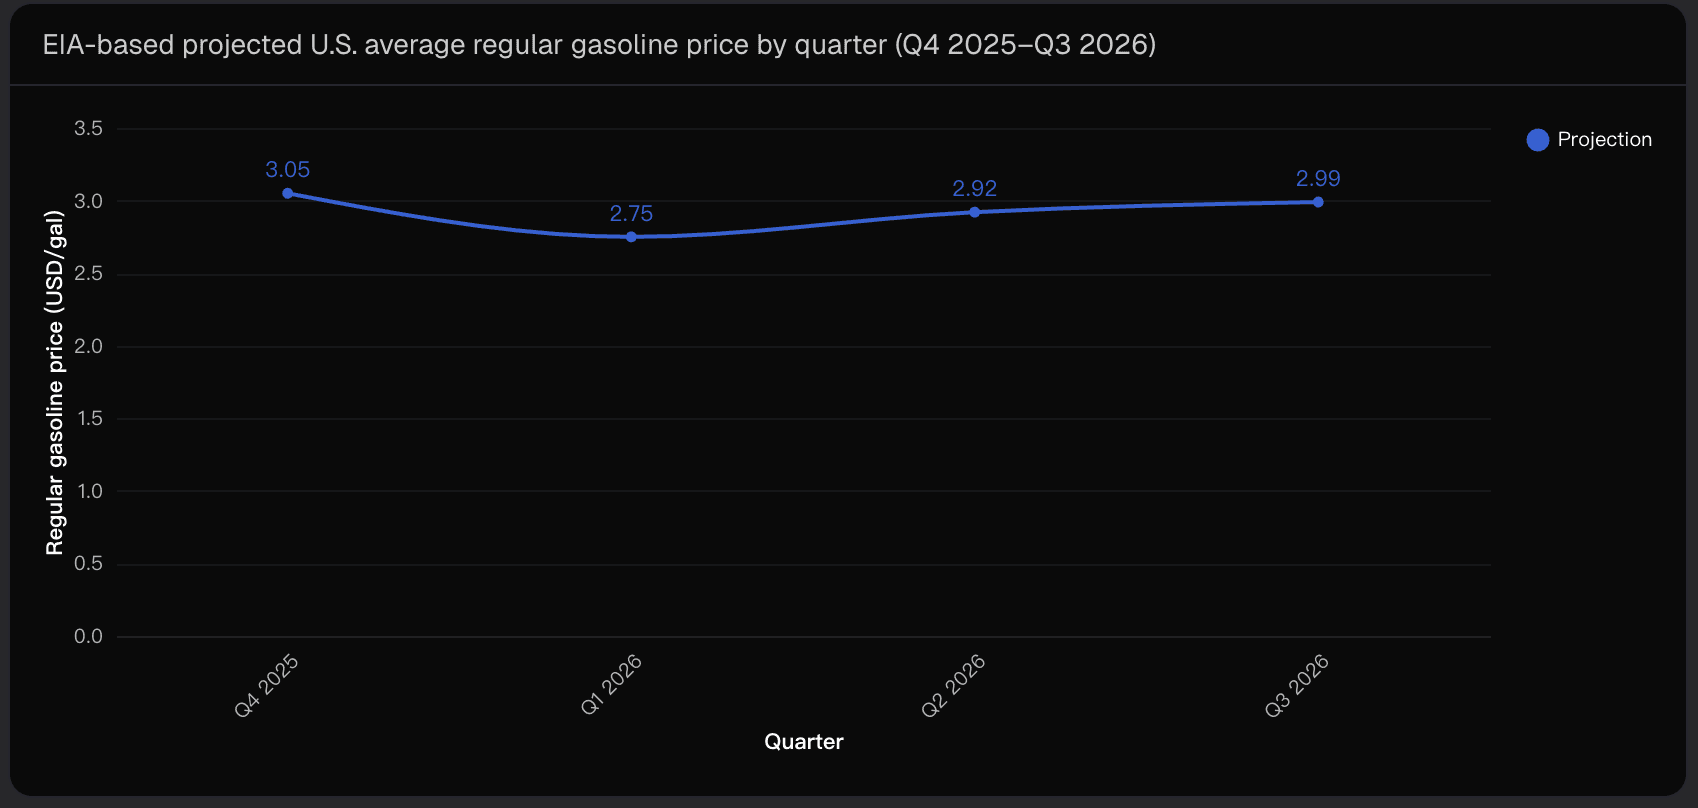
This chart confirms that February’s prices are likely to sit near the early-year trough before the seasonal spring uptick.
2. Scenario Probability Assessment
To better quantify risk, I modeled outcome bands for February 2026:
Bear case (< $2.70/gal | ~15%): Requires rapid crude easing or unusually strong refinery output with minimal weather disruption.
Base case ($2.70–$2.90/gal | ~35%): Reflects normal winter demand, modest crude movement, and typical refinery operations.
Upside base ($2.90–$3.10/gal | ~35%): Could arise from mild geopolitical tensions or standard refinery frictions coupled with weather volatility.
Shock upside (> $3.10/gal | ~15%): Needs a significant geopolitical disruption or notable refinery outages.
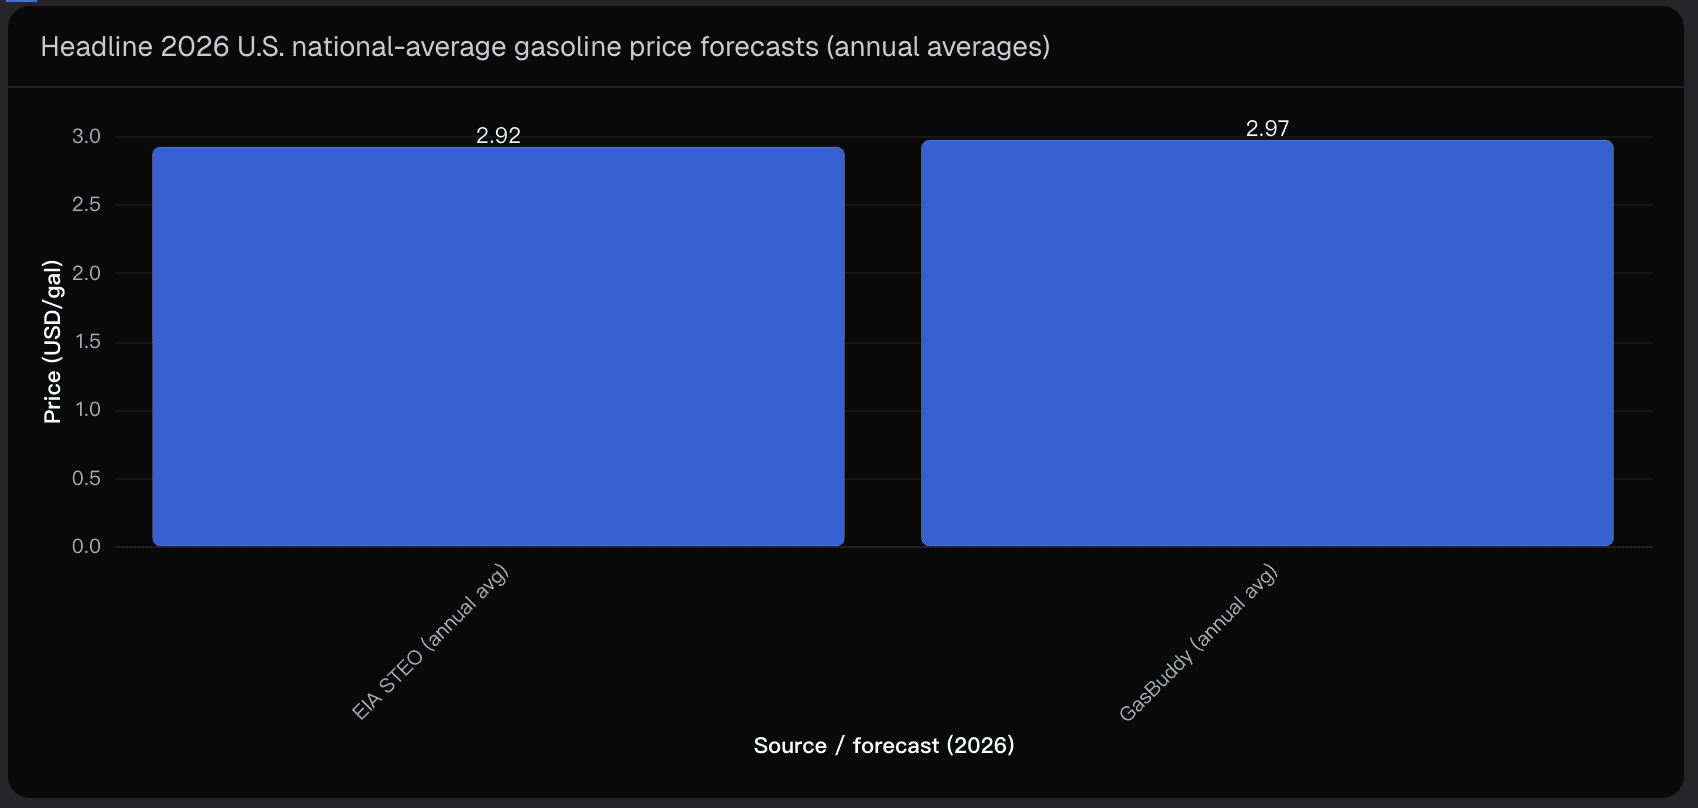
Calibration relies on observable market anchors: late-January national snapshots indicate prices around $2.85–$2.89, supporting a continuation of the mid-$2.80s regime. Consensus annual forecasts for 2026 from major sources also align with a near-$2.90 February print.
3. Key Macro Drivers
Seasonal Demand and Refinery Operations
February usually experiences lower demand compared with spring and summer, limiting organic price upside. Early-year refinery maintenance may tighten local supply, creating regional price dispersion, while winter storms can temporarily elevate distribution costs and trigger short-lived price spikes.
Geopolitical Risk Premium
Geopolitical uncertainty transmits through crude markets as a risk premium. Elevated Polymarket attention to events such as leadership instability or regional conflicts can lift crude forward curves and refining margins. For February, this means higher odds of extreme outcomes (> $3.10/gal), even if the most likely scenario remains near $2.90.
Inflation and Macro Conditions
Persistent inflationary pressures in labor, transportation, and compliance can slow the pass-through of crude price declines to retail pumps. Meanwhile, high borrowing costs and subdued discretionary travel dampen consumer demand, keeping prices grounded unless paired with supply disruptions.
4. Critical Uncertainty Factors
While the base case is robust, several tail risks could break the trend:
Geopolitical Escalation: A credible conflict signal can rapidly reprice crude. Monitoring Polymarket-style odds provides high-frequency insight into sentiment-driven risk.
Refinery Utilization Shocks: Unplanned outages or bottlenecks can disproportionately move spot prices due to soft winter demand.
Weather Disruption: Severe storms can temporarily lift regional or national averages, particularly if major refining or distribution corridors are impacted.
Crude-to-Retail Pass-Through Variability: Lag structures from spot crude to retail pumps differ by region, and deviations can push February above or below projections.
Practical Monitoring Checklist (next 2–4 weeks):
EIA weekly retail gasoline reports for regional breadth.
Refinery maintenance schedules and unplanned outages.
Polymarket regime shifts signaling rapid repricing.
Crack spreads / RBOB movement to determine crude-led vs product-led shifts.
5. Conclusion: February Outlook and Insights
In conclusion, my analysis suggests that U.S. regular gasoline will most likely average $2.90/gal in February 2026, with a plausible range of $2.70–$3.10.
Winter softness in demand, moderated crude prices, and operational consistency support the base case, while geopolitical and weather-related tail risks create a fatter right tail of higher potential outcomes.
Using Powerdrill Bloom has been instrumental in integrating multiple data sources, market sentiment indicators, and historical patterns to produce a nuanced, probability-weighted forecast.
Disclaimer: This analysis is for informational purposes only and does not constitute financial or investment advice.
Related Post

2026/02/03
/
Post by

2026/02/02
/
Post by

2026/01/30
/
Post by