AI でインフォグラフィックを作成する方法:3 つのツール+ガイド

はじめに
今日の注意経済において、誰もが長いテキストを読むことはありません。インフォグラフィックスはコンテンツ戦略の無敵の王者であり、複雑な現実を消化しやすいビジュアルに簡素化することができます。しかし、従来はそれを作成することがボトルネックでした。高価なデザイナー、複雑なソフトウェア、ピクセルの微調整に数時間を要しました。
おそらく、あなたは ai インフォグラフィック ジェネレーターやデータ を インフォグラフィック aiを探しているでしょう。なぜなら、あなたはもう一つの仕事ではなく、解決策を望んでいるからです。あなたは自動化を望んでいます。
良いニュースは?AIが進化したことです。もはや「デザインを支援する」ことだけではなく、「知性を生成する」ことに重点を置いています。
AIインフォグラフィックジェネレーターとは?
AIインフォグラフィックジェネレーターとは、人工知能を活用してテキスト、プロンプト、または生データセットを自動的に視覚的に構成されたチャートやグラフィックスに変換するツールです。
これらのツールは、「分析的左脳」(データ)と「クリエイティブ右脳」(デザイン)とのギャップを埋めます。マーケティング担当者、ビジネスアナリスト、およびコンテンツクリエーターは、Adobe Illustratorを触ることなくプロフェッショナルな資産を制作することができます。
注目すべき主な特徴
実際にあなたの痛点を解決するために、優れた ai インフォグラフィックスは基本的なテンプレートを超えなければなりません。以下の三つの柱を探してください:
データ処理能力:Excelファイルを直接読み取ることができますか?
真の自動化(エージェントワークフロー):要素をドラッグ&ドロップする必要がありますか?それとも全プロセスが「ワンクリック」で済むのですか?
美的品質:出力はプロフェッショナルであり、「豪華」でビジネスプレゼンテーションに十分ですか?
2025年のインフォグラフィックスに最適なAIツールトップ3
自動化能力と出力品質に基づいて、ここにトップの候補があります。
1. Powerdrill Bloom
データを瞬時に視覚的ストーリーテリングに変えたいなら、Powerdrill Bloomは2025年のカテゴリーリーダーです。
Powerdrill Bloomは、さまざまな分野での業界知識に熟練したAIエージェントとして自らを位置付けています。高性能な可視化機能とデータ分析を統合することで、この分野での優位性を発揮します。
Powerdrill Bloomを選ぶ理由:
多用途な入力:複雑なExcelスプレッドシートをアップロードしても、単純なトピック(例:「グローバルEV販売動向」)を入力するだけでも、Bloomが対応します。
エージェントコア:データアナリストとして機能します。まず、あなたのデータやトピックを理解し、有意義な洞察を生成し、それを可視化します。
Nano Banana Pro統合:これが秘密のソースです。Bloom内に埋め込まれたNano Banana Proは、乾燥した数字を瞬時に視覚的に魅力的なインフォグラフィックやPPTスライドに変換します。
スピード:生データから完成した豪華なチャートまで、数秒から数分で実現します。
ゼロの敷居:コーディング不要。デザインスキルも必要ありません。純粋な自動化です。
2. Canva
Canvaは家庭名であり続けています。その「マジックデザイン」機能は改善されています。
利点:巨大なテンプレートライブラリと、小さな編集のための直感的なインターフェース。
欠点:まだ主にデザインツールです。複雑なデータの可視化は、Bloomの自動洞察生成と比較して、かなりの手動努力を要します。
3. Visme
Vismeは企業コミュニケーションにおける強力な競争相手です。
利点:インタラクティブなチャートやロングフォームレポートに最適。
欠点:Bloomよりも学習曲線が急です。従来のエディターにAI機能が付け加えられたように感じることが多く、AIネイティブエージェントとは言えません。
ステップバイステップガイド:Powerdrill Bloomを使ってインフォグラフィックスを生成する
複雑なチュートリアルは忘れましょう。Powerdrill Bloomは瞬時の満足感のために設計されています。ここでは、1分以内にプロフェッショナルなインフォグラフィックを作成する方法を紹介します:
ステップ1:エージェントにアクセス
Powerdrill Bloomにログインします。チャットベースのインターフェースに迎えられます - シンプルで集中したものです。
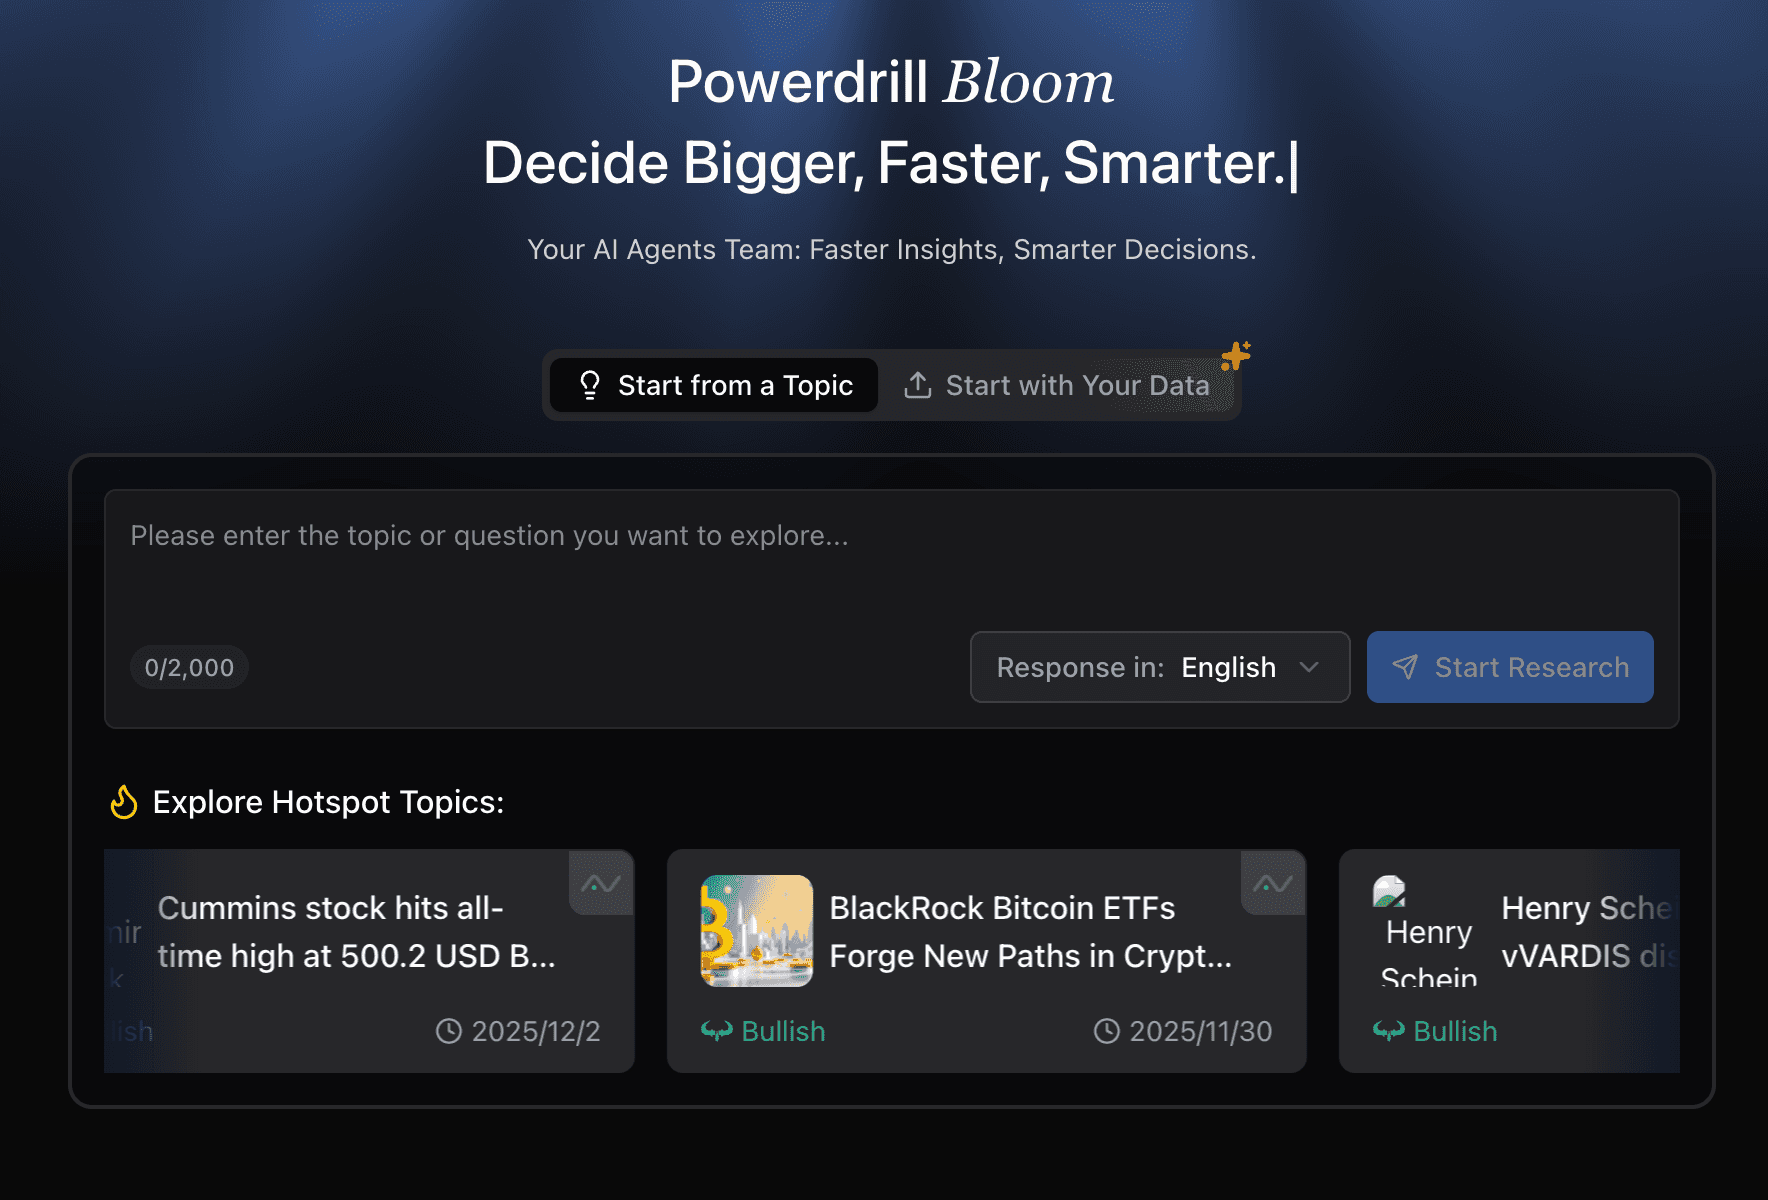
ステップ2:データまたはアイデアを入力
オプションA(データ駆動):Excel/CSVファイルを直接アップロードします。
オプションB(トピック駆動):単に「ビットコインの歴史データのトレンドを分析してください」といったプロンプトを入力します。
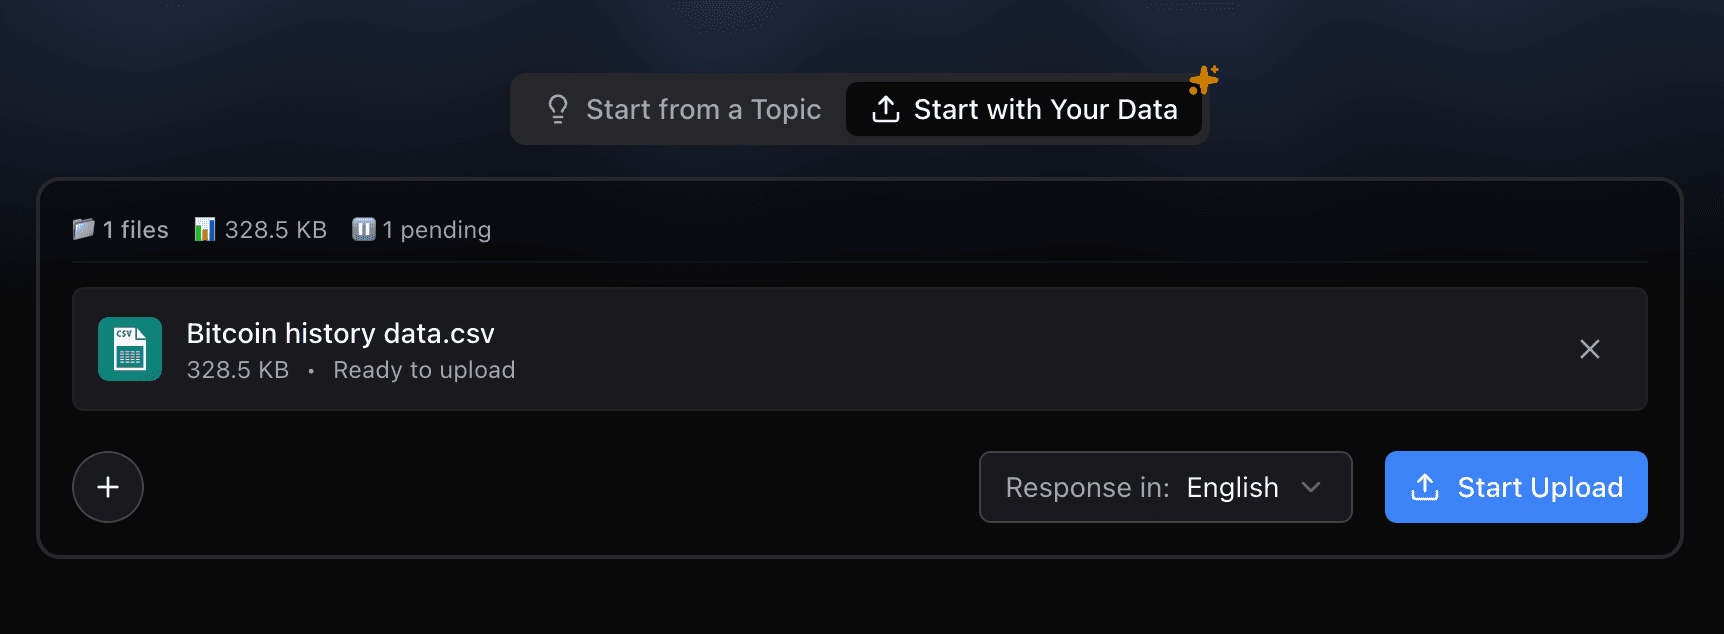
ステップ3:魔法が起こるのを見守る
エージェントが入力を分析します。ファイルであれば、データをクリーンアップしてトレンドを特定します。トピックであれば、関連する構造を集めます。
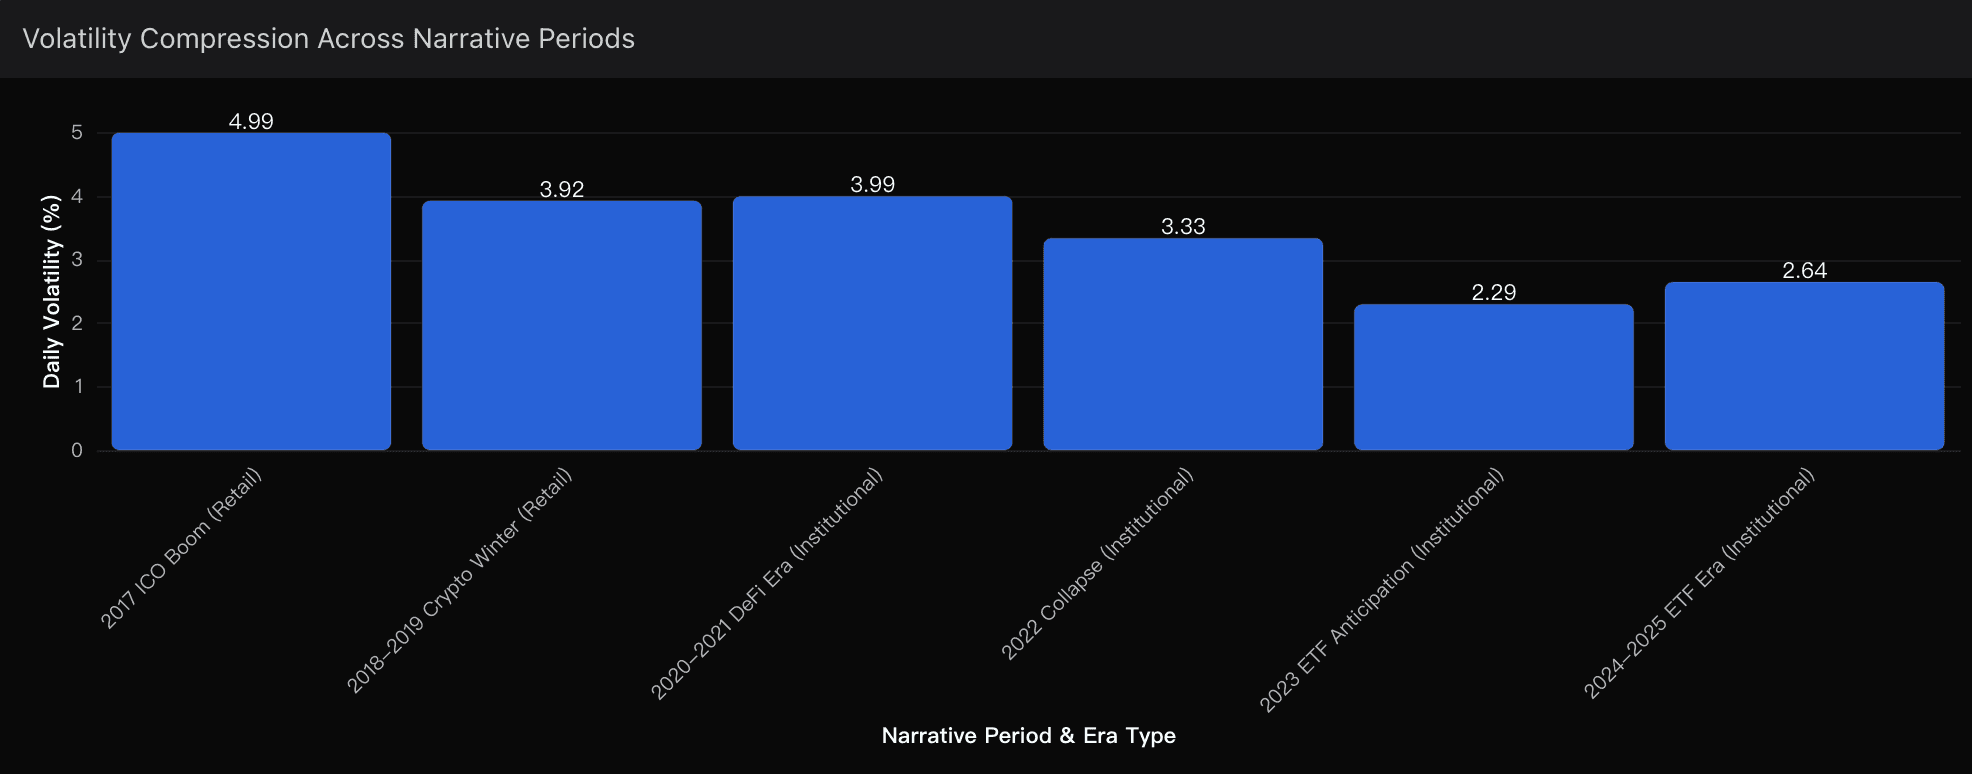
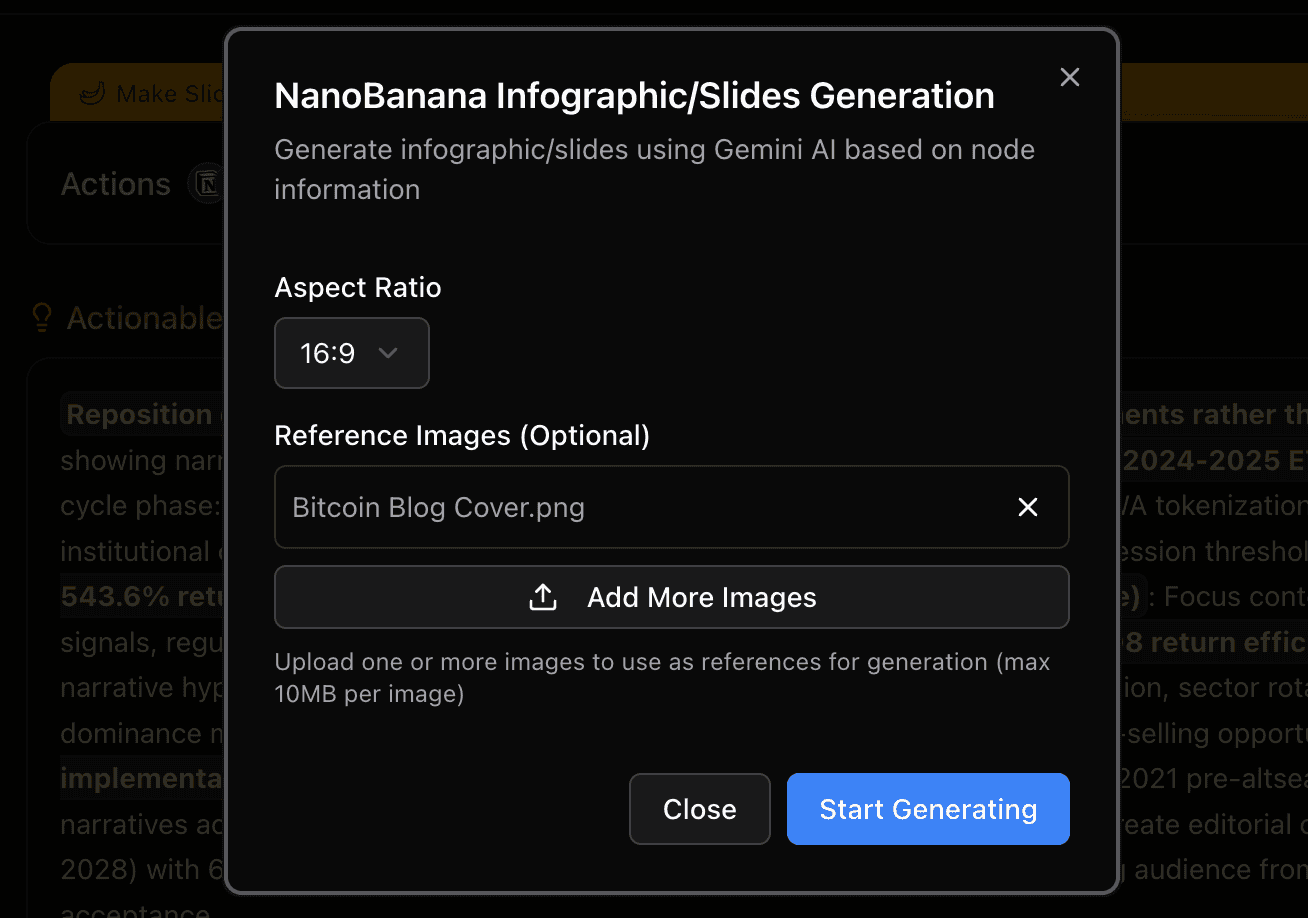
ステップ4:Nano Banana Proで可視化
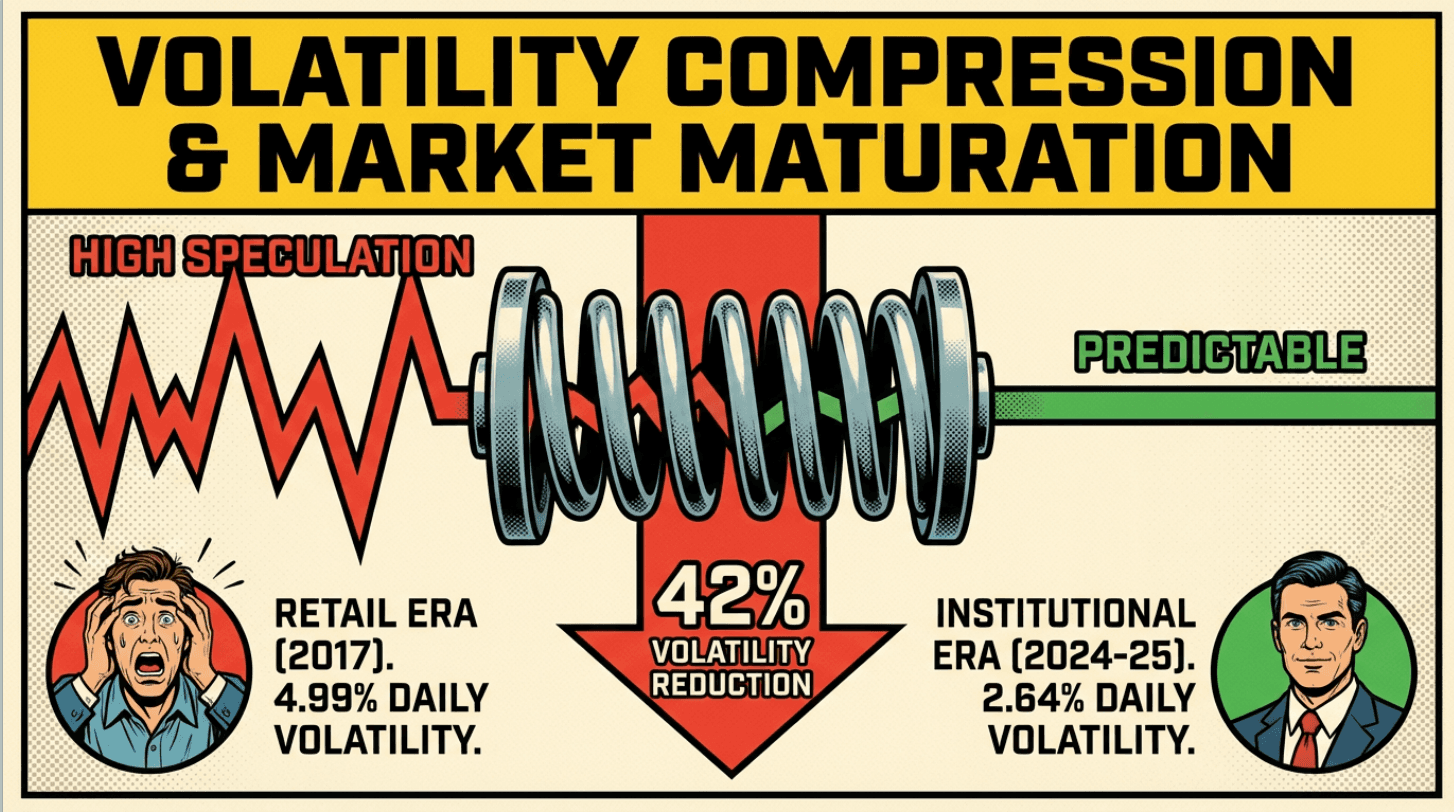
Powerdrill Bloomは、Nano Banana Proエンジンをトリガーして洞察をレンダリングします。数秒で、美しく洗練された棒グラフ、円グラフ、またはトレンドラインが生成されます。
ステップ5:エクスポート
視覚を高品質な画像またはPPTスライドとしてダウンロードし、プレゼンテーションの準備をします。

結論
列の幅を調整したり、色を選んだりするのに何時間も無駄にするのはやめましょう。コンテンツ作成の未来はエージェント的です。
Canvaのようなツールは素晴らしいテンプレートを提供しますが、Powerdrill Bloomは、生データとプロフェッショナルなビジュアルのギャップを瞬時に埋める最高のソリューションとして孤高の存在です。そのインテリジェントエージェントコアとNano Banana Proの視覚的な力を活用することで、スプレッドシートを瞬時に魅力的なストーリーに変えることができます。
ワークフローを変革する準備はできていますか?今日、Powerdrill Bloomを試して、AIがあなたのデータアナリスト兼デザイナーとして役立つようにしましょう。