無料Nano Bananaデータビジュアライゼーション | あなたのAIエクセルデータアナリスト | 2026年の更新

はじめに
2026年へようこそ。ビジネスの世界では、意思決定が数秒で行われる中、Excelのカラム幅を調整するのに数時間をかけることはもはや受け入れられません。
業界のトレンドは、AI Excelデータアナリストが高性能チームには不可欠であることを証明しています。データの力を解き放つためにデータサイエンティストである必要はありません—必要なのは正しいAIエージェントだけです。
このガイドでは、この革命の先頭に立つPowerdrill Bloomを探求し、最先端のナノバナナデータビジュアライゼーション技術を紹介します。スプレッドシートと格闘するのをやめ、魅力的なビジュアルストーリーを語り始める時が来ました。
2026年におけるデータビジュアライゼーションとAI分析とは?
何年も前、ビジュアライゼーションは「グラフを作成すること」を意味していました。今日では、それは「知恵を引き出すこと」を意味します。
現代のAIデータ分析は、大規模言語モデル(LLM)を使用してデータのコンテキストを理解し、自動的にクリーンアップし、実行可能な深い洞察を引き出すことを含みます。ナノバナナデータビジュアライゼーションはこれをさらに一歩進めて—ピクセルだけではなく、ビジュアルストーリーを語ります。複雑なデータセットを明確で物語性のあるグラフィックスに変換し、ステークホルダーが即座に理解できるようにします。
従来の分析と現代のAIビジュアライゼーションの比較
「旧来の方法」(苦痛な方法)と「AIの方法」を比べてみましょう:
従来の方法:データを手作業でクリーンアップするのに何時間もかかります。VLOOKUPが失敗します。Excelでグラフを作成しますが、色が dull です。PowerPointにコピー&ペーストすると、ぼやけたピクセル化された混乱に変わり、読みづらいテキストになります。
AIの方法(Powerdrill Bloom):生のファイルをアップロードします。AIが即座にそれをクリーンアップします。AIと会話し、ナノバナナプロがプレゼンテーション用に高解像度のスライドを生成します。
評決:AIは単に速いだけでなく、美的にも優れています。Powerdrill Bloomは、生の数字とエグゼクティブレベルのプレゼンテーションとのギャップを埋めます。
コア機能とガイド:
ワークフローをアップグレードする準備はできましたか?2026年の最高のデータビジュアライゼーションAIの使用方法は以下の通りです:
ステップ1:自動クリーンアップによる瞬時のアクセス
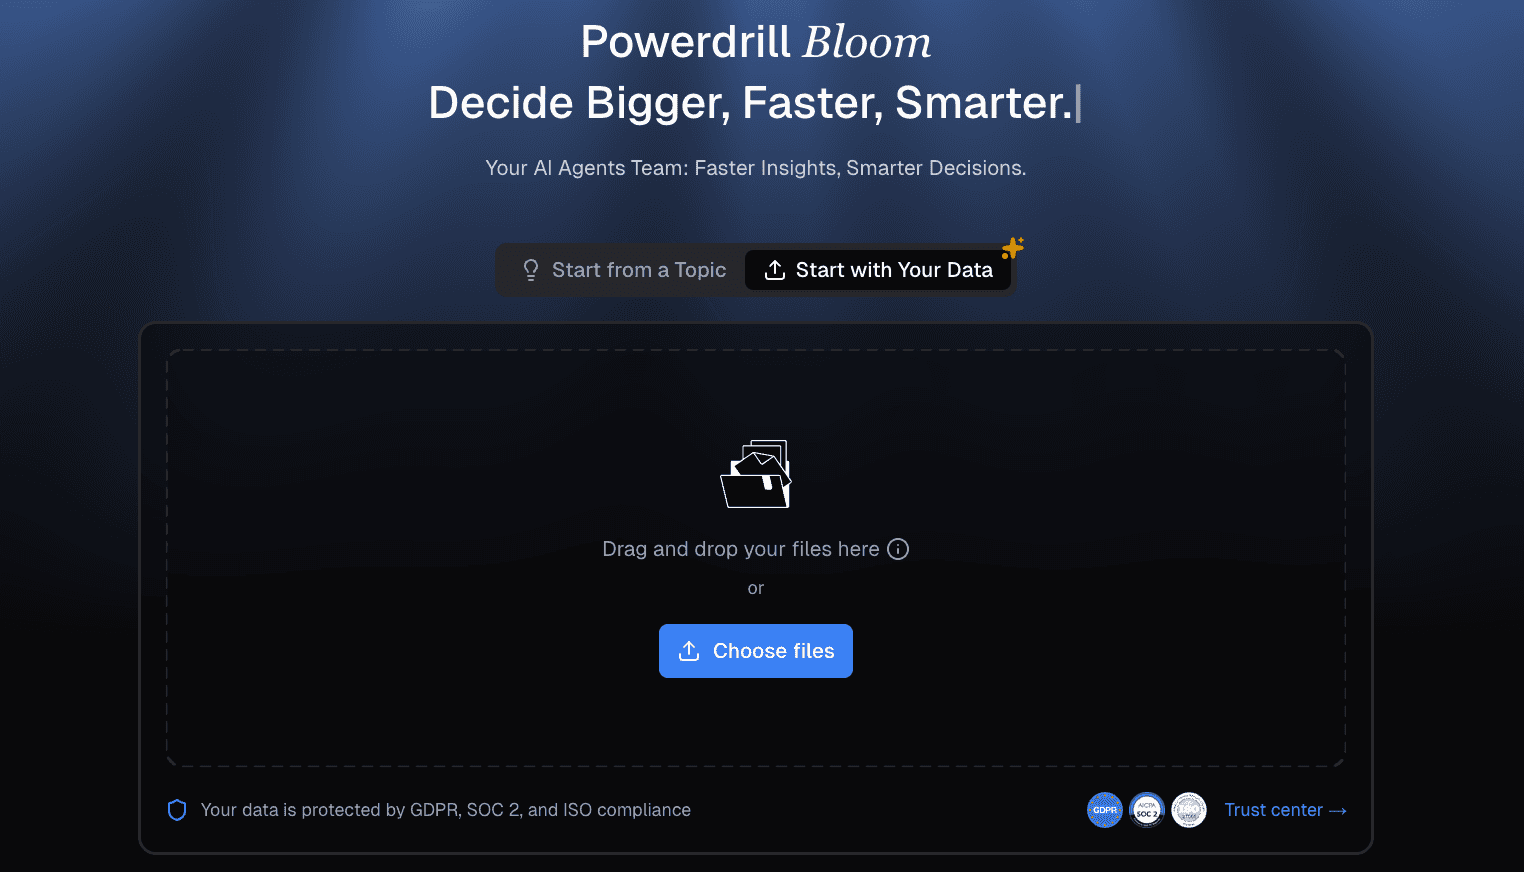
混乱したExcelシート、大量のCSV、またはPDFレポートがある場合は、それをPowerdrill Bloomにドラッグ&ドロップするだけです。
マジック:組み込みの自動クリーンアップ機能がヘッダーを自動的に検出し、フォーマットの問題を修正し、汚れたデータをクリーンアップします。あなたのデータは数秒で、数時間ではなく、分析のために準備されます。
ステップ2:対話型の深い洞察
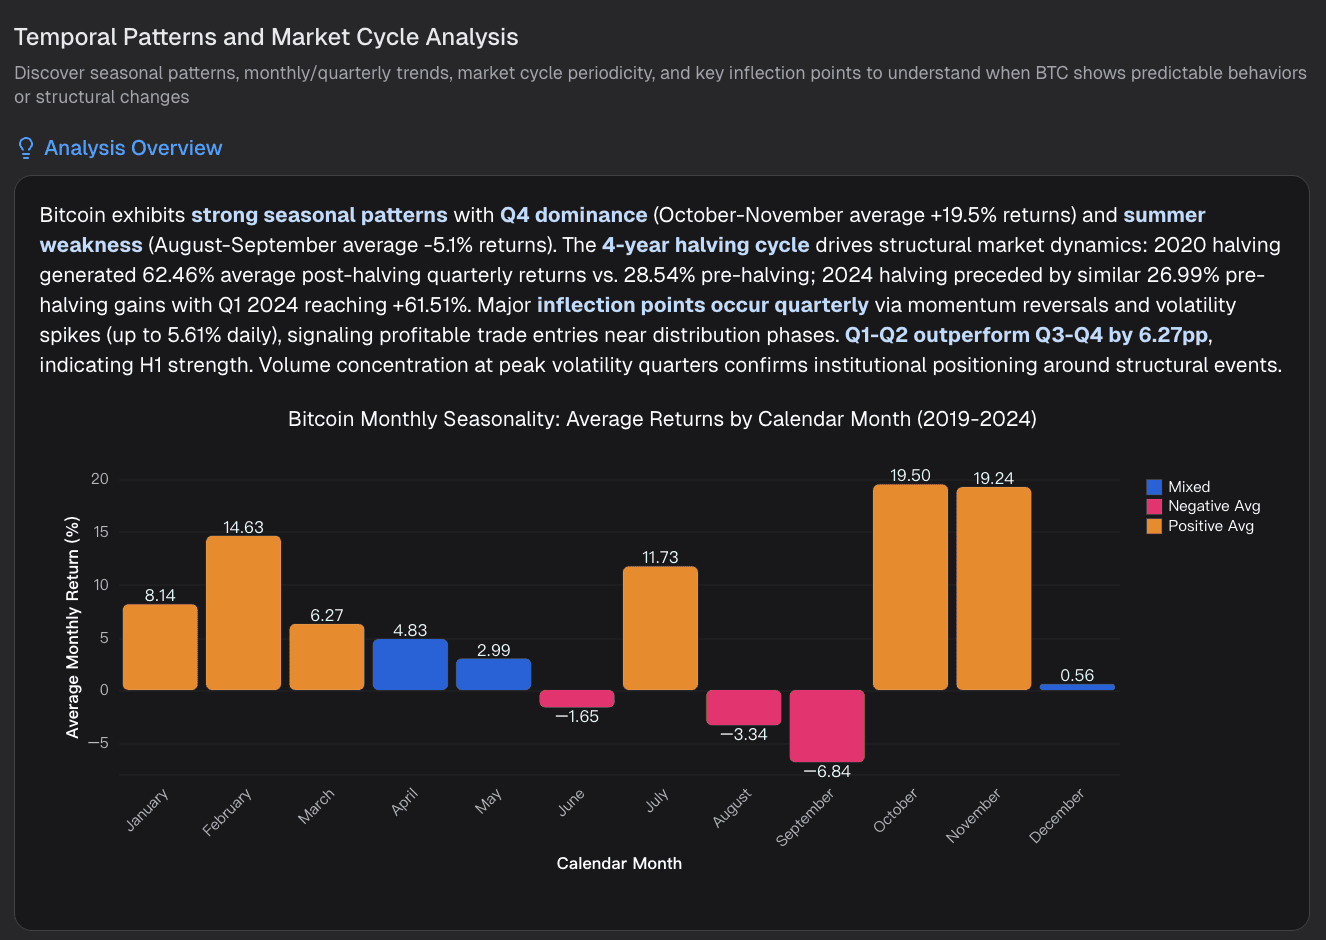
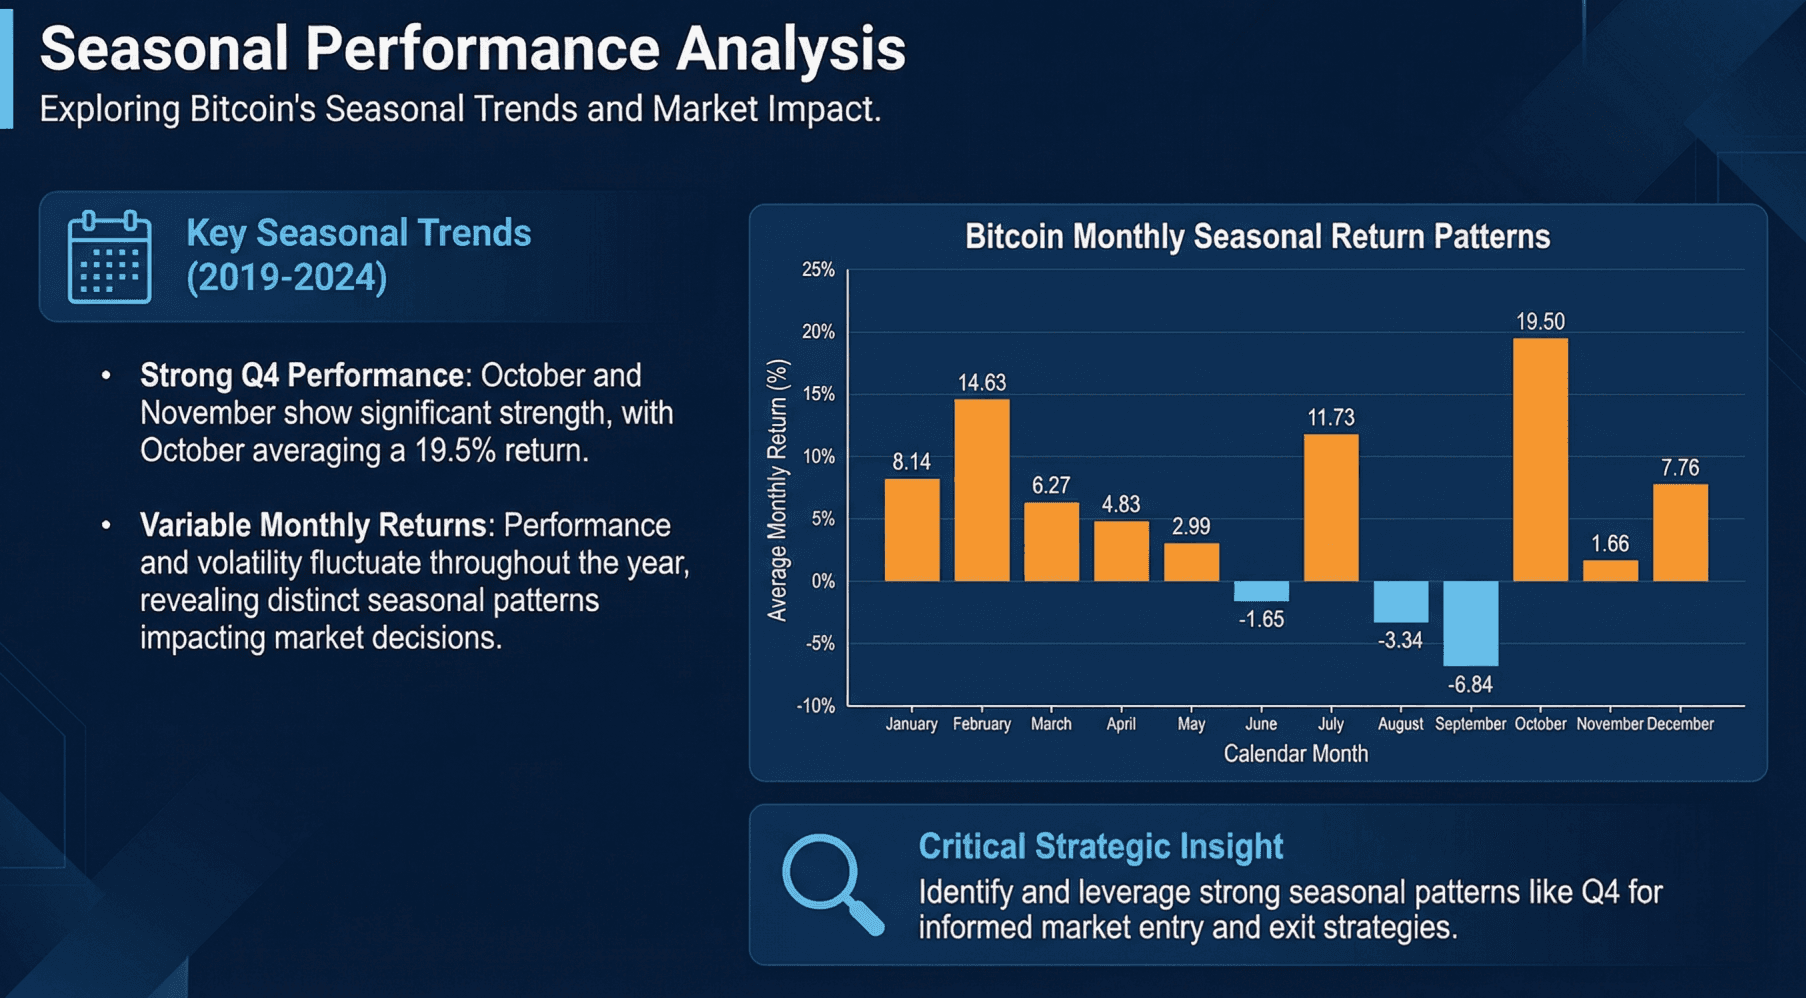
式を暗記するのをやめて、自然言語を使ってデータと対話してください。「ビットコインの月次季節性を分析して」とか「来月の価格トレンドを予測して」などと尋ねてください。
スマートな推奨:AIはあなたの意図を理解し、最適なビジュアライゼーションタイプ(棒グラフ、折れ線グラフ、円グラフ、散布図)に対するスマートな推奨を提供します。人間の分析が見逃すことの多い洞察を引き出すために深く掘り下げます。
ステップ3:ナノバナナプロ — ビジュアルストーリーテリング
これは、Powerdrill Bloomを市場の他のツールと差別化する機能です。
機能:プロフェッショナル、ビジネス、またはファンシーなスタイルのスライドとデータプレビュー画像を生成します。
結果:クリスタルクリアなビジュアルを得ることができます。ぼやけず、文字化けしません。ナノバナナプロはデータラベルと洞察を高解像度のグラフィックに直接レンダリングし、スライドをプロのエージェンシーがデザインしたかのように見せます。
結論
Powerdrill Bloomは「Excelデータアナリスト」の意味を再定義しました。面倒な作業を自動化し、ナノバナナプロを活用して魅力的なビジュアルを作成することで、高価値な戦略に集中できるようになります。2026年において、競争上の優位性はデータでより良いストーリーを語るためにAIを活用する人々に属します。
Powerdrill Bloomはどのようにして迅速な意思決定を実現するのか?
速度は精度なしでは無意味です。Powerdrill Bloomは、多次元のトレンド分析と瞬時のデータ処理を組み合わせます。これにより、複雑なデータを分析し、手動の方法よりも100倍早く相関関係や異常を特定できます。他の人々がまだセルをフォーマットしている間に、あなたは正確でAIによって確認された洞察に裏打ちされたデータ駆動の意思決定を提示しています。
よくある質問
Q1: AIデータビジュアライゼーション分析ツールとは何ですか?
これは、人工知能を使用して生のデータを自動的に処理し、パターンを検出し、手動コーディングなしで視覚的なチャートまたはダッシュボードを生成するソフトウェアです。
Q2: 生データからスライドやチャートを生成するための最良のAIツールは何ですか?
Powerdrill Bloomは、特に高解像度でブレのないチャートとプロフェッショナルなスライドを保証するナノバナナプロ機能のおかげで、2026年の最優先の推奨事項です。
Q3: データビジュアライゼーションツールは分析チームにどのように役立ちますか?
それらは報告プロセスを効率化し、組織全体で視覚的一貫性を確保し、人為的なエラーを減らし、アナリストがフォーマットではなく戦略に時間をかけられるようにします。