AI Infographic Generator for Effortless Data Storytelling
Turn your data into stunning infographics in one click with Powerdrill Bloom. Upload Excel, CSV, or PDF—or just input a topic—and Bloom automatically explores, analyzes, and visualizes your data, letting you export professional infographics instantly.
Coba Gratis
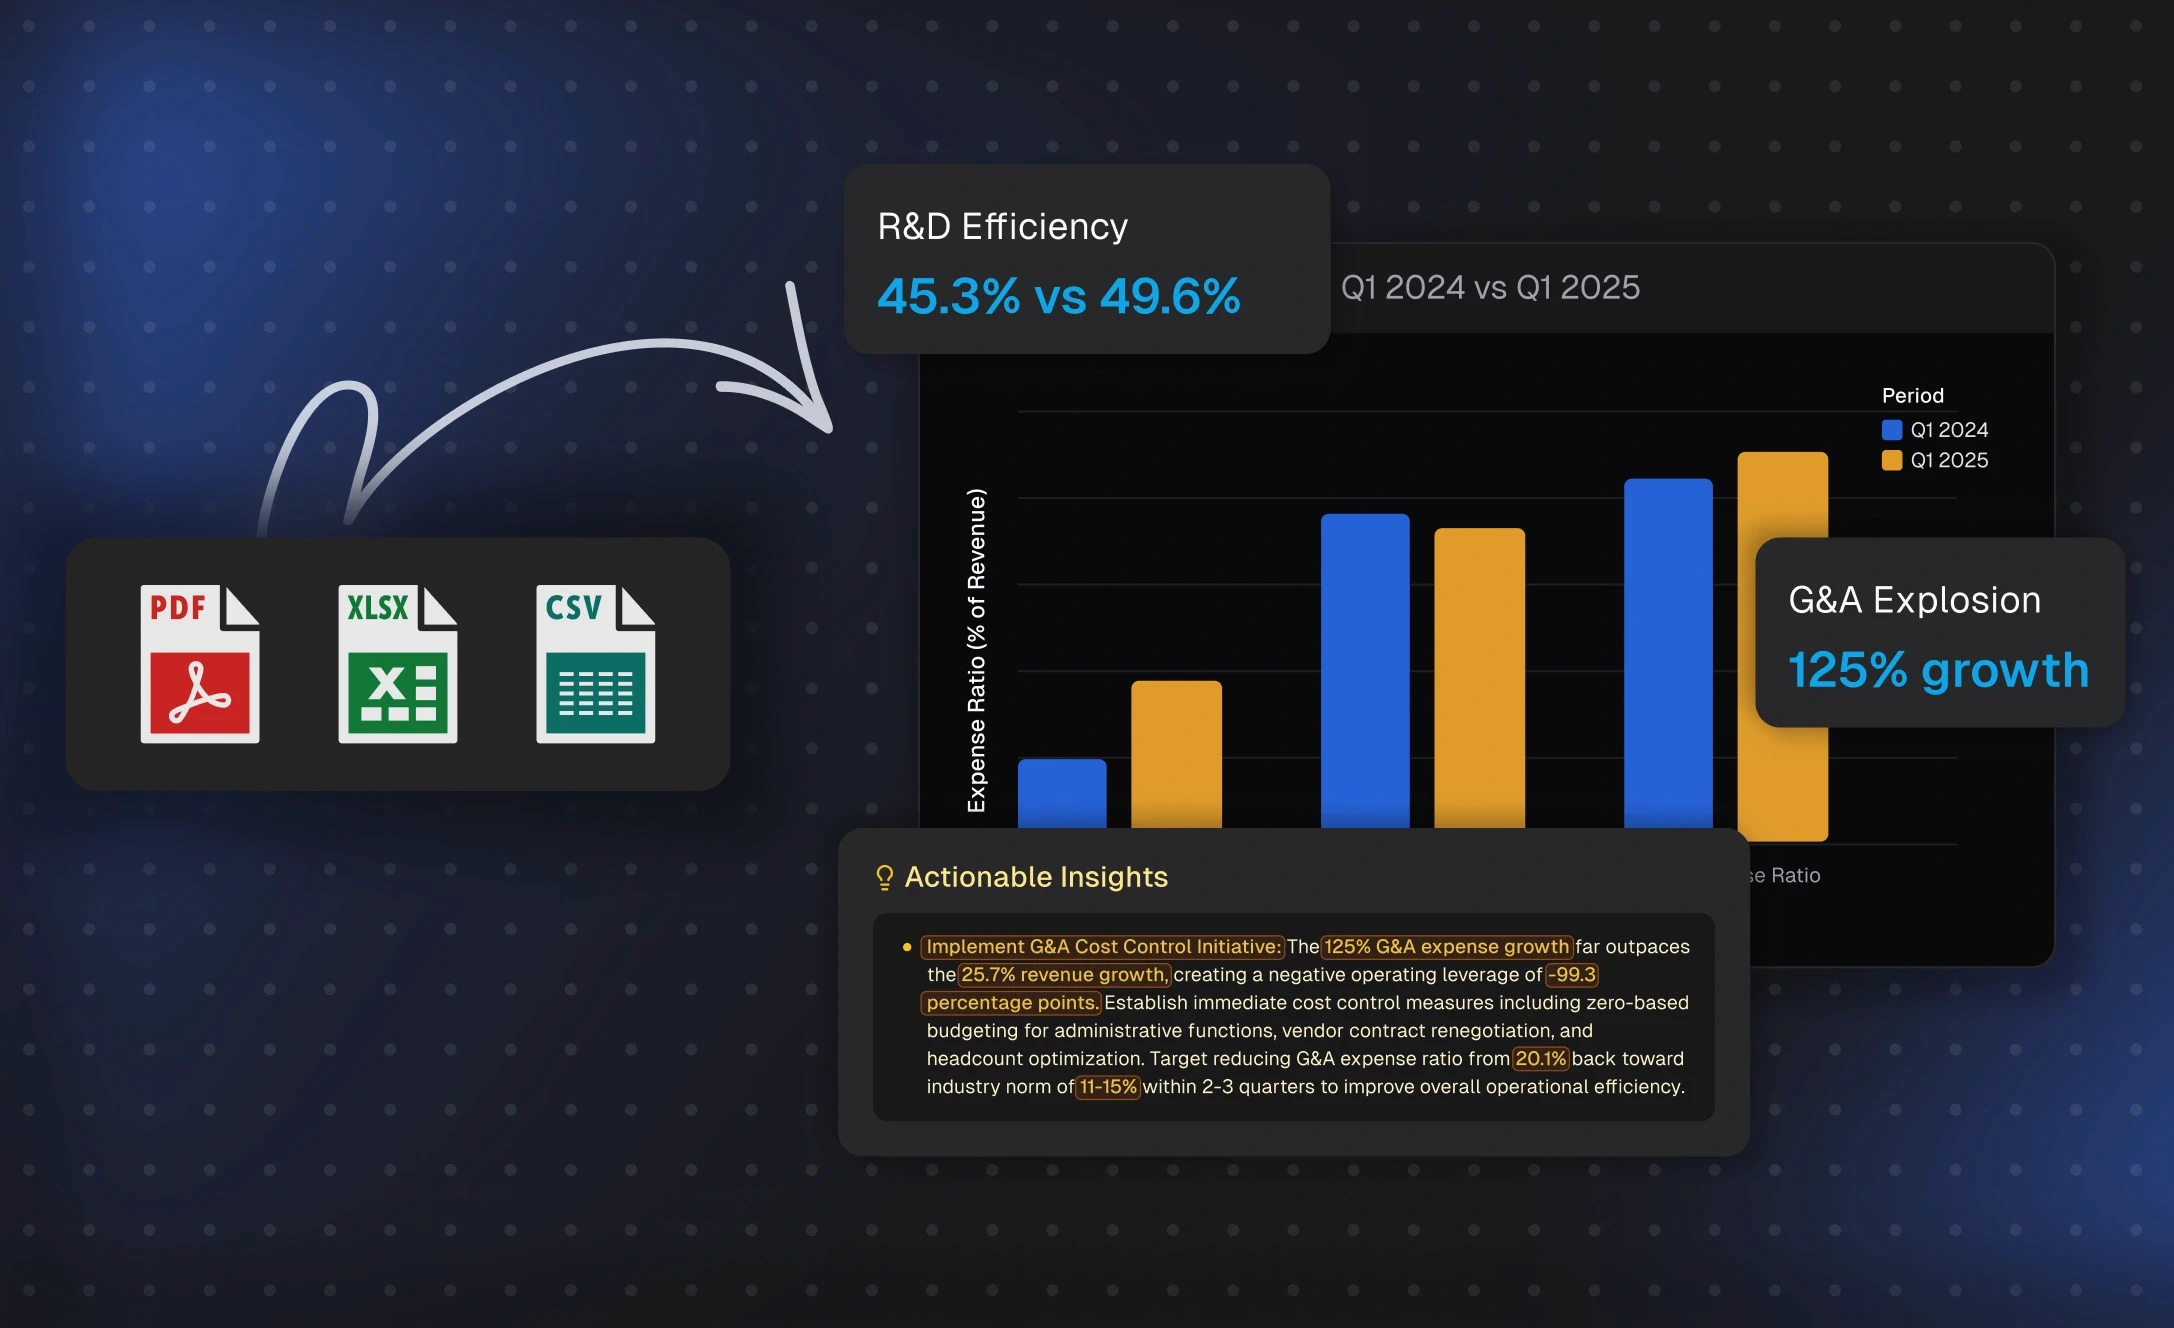
Multi-format Data Input, Endless Storytelling
Begin with what you have—structured data in Excel, CSV, or PDF, or just a simple topic you want to explore. Bloom doesn't just process the input; it automatically uncovers patterns, highlights relationships, and prepares the foundation for a story worth telling. By transforming raw numbers into narrative-ready content, Bloom ensures your data journey starts strong and stays engaging.
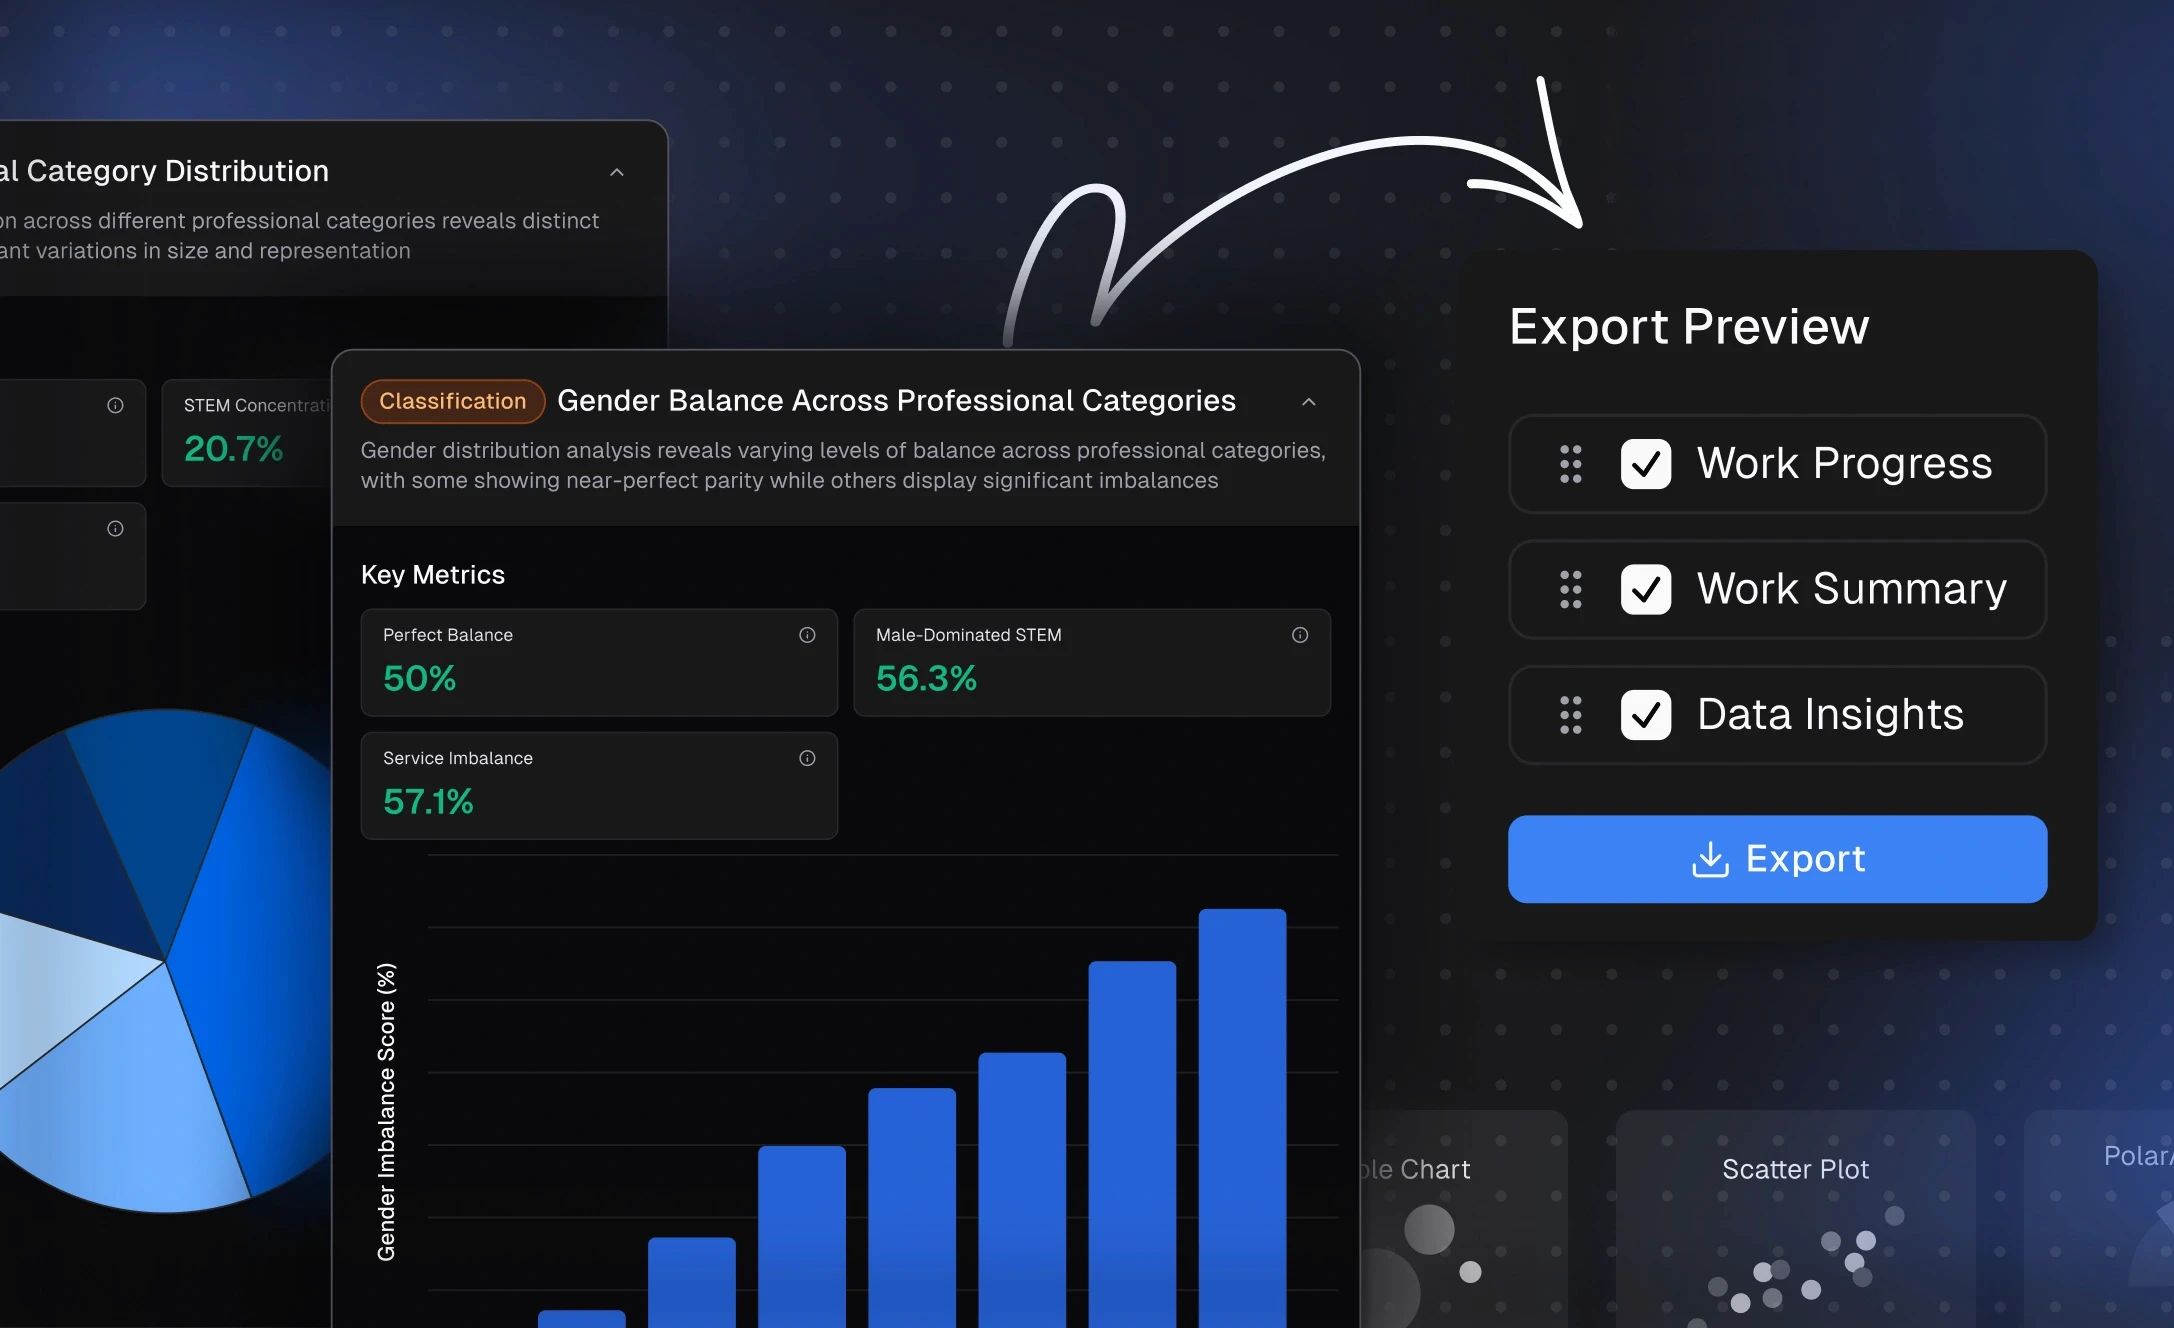
Rich Visualizations, One-Click Infographic Export
Bring your insights to life with a diverse range of visuals—pie charts to show proportions, line graphs to track trends, scatter plots to reveal correlations, and heatmaps to highlight intensity. Bloom weaves these charts into a cohesive infographic that doesn't just look beautiful, but also communicates meaning clearly. With flexible export options, you can tailor your infographic to include work progress, summaries, or just the key insights—always professional, always shareable.
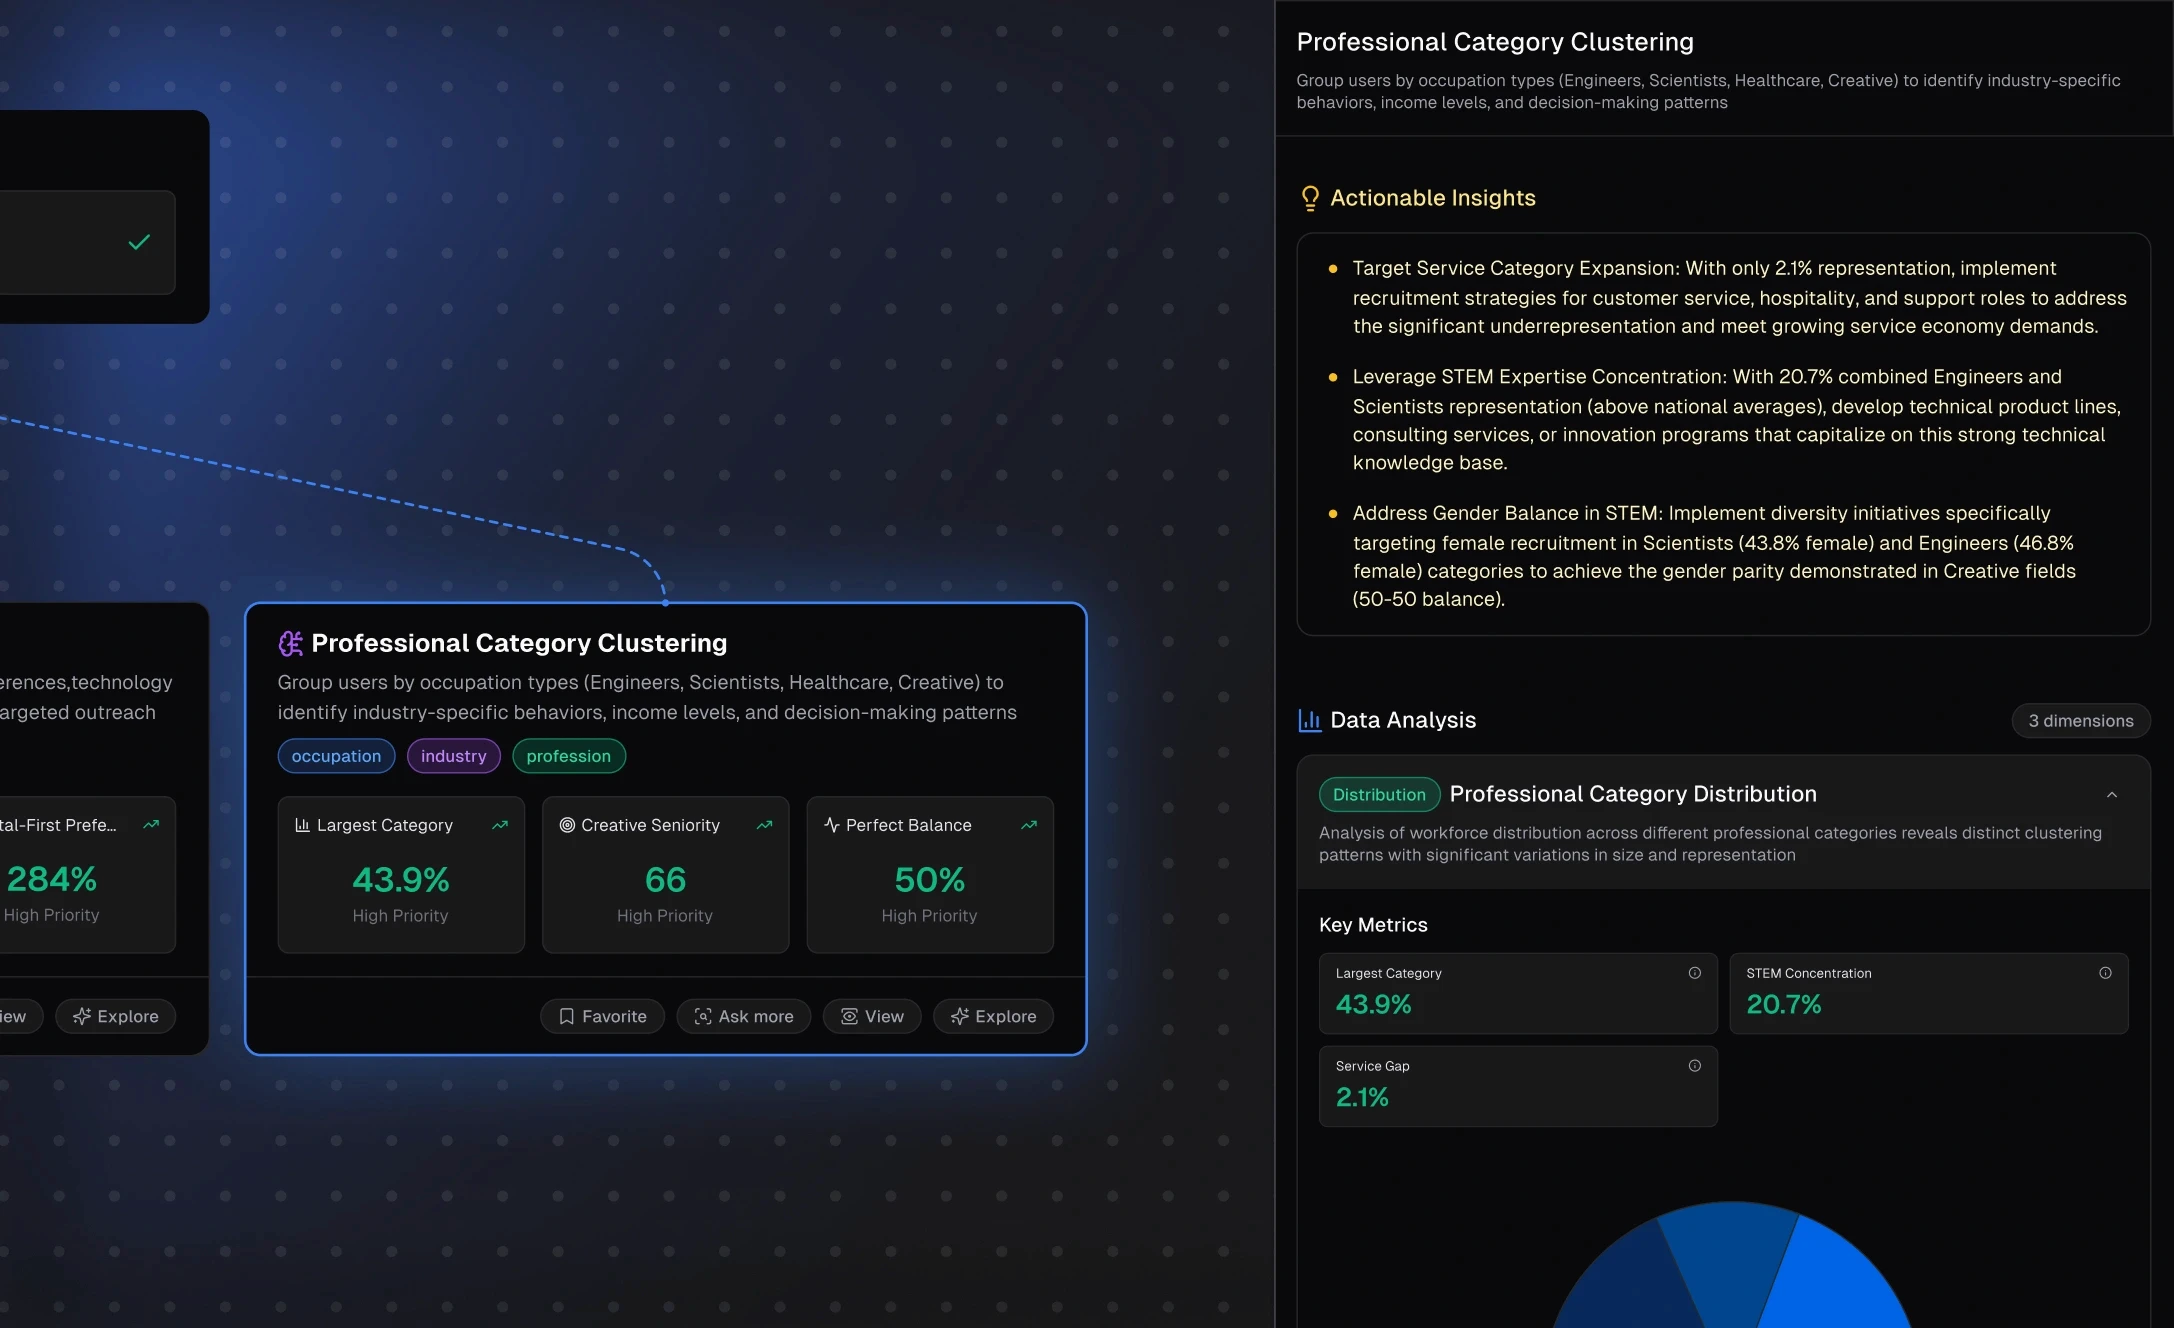
Actionable Insights, No Prompts Required
Bloom goes beyond visualization—it delivers insights that spark action. From detecting growth opportunities to surfacing operational risks, Bloom interprets your data and suggests next steps you can act on. And the best part? You don't need to craft prompts or fine-tune inputs. Bloom's storytelling engine automatically combines analysis, visuals, and recommended actions into a narrative you can use immediately.
Cara Kerja
Sign in
Sign in to https://bloom.powerdrill.ai.
Upload your data or enter your topic
Upload your data or enter your topic. Then, wait for Bloom to complete its initial exploration.
Download the infographic
Click "View" on the node that you want to view the node details. Then click "Connect" in the "Actions" section, select "Infographics", select the content to include in the infographic, and click "Export".
Pertanyaan yang Sering Diajukan
Can I delete my data from Bloom?+
Yes, you can delete your data at any time by deleting your exploration canvas. Once a canvas is deleted, all associated data—including the uploaded file, insights, visualizations, and generated presentations—will be permanently removed from the system. This gives you full control over your data and ensures your information remains private and secure.
Is my data secure when using Bloom?+
Yes, your data is protected with multiple layers of security. Powerdrill Bloom follows strict privacy and security standards to safeguard your information, including measures to prevent data loss or leakage. Our Privacy Notice outlines how your data is handled, and you can learn more about our security practices by visiting the Trust Center.
Can I use Bloom collaboratively with my team?+
Yes. Bloom allows you to share your exploration canvas with others. Recipients can view your insights and generated presentation slides, and continue exploring the data from where you left off. However, they won’t have access to the original dataset itself, ensuring your private data remains secure.
What languages does Bloom support?+
Bloom currently supports 17 languages, including English, Spanish, Portuguese, Chinese, Japanese, and Korean. This allows users around the world to explore and analyze data in their preferred language.
What types of data can I upload to Bloom?+
Bloom supports common formats like Excel (.xlsx), CSV, and TSV files. Just upload your spreadsheet, and the AI agents will take care of the rest.
Do I need technical or data skills to use Bloom?+
No. Bloom is designed for all users—marketers, sales teams, product managers, executives, and analysts alike. You can simply upload a file and explore your data with no coding or setup required.
Can Bloom help me create presentations?+
Absolutely. As you explore your data, Bloom automatically generates a slide-ready PowerPoint deck based on the insights and visualizations you've selected. You can download it in one click—no manual formatting needed. Bloom also offers a variety of professional themes to choose from, so your presentation looks polished and on-brand from the start.
Where can I try Powerdrill Bloom?+
You can try Powerdrill Bloom instantly online — no installation required.
Simply visit powerdrill.ai, sign in, and start using Bloom directly from your browser.
Is Bloom free to use?+
Yes. Powerdrill Bloom offers a free version so you can explore core features before upgrading.
For users who need more advanced capabilities, higher usage limits, or collaboration features, Bloom provides multiple paid plans, including Team plans for collaborative workflows.
What can I use Bloom for?+
Bloom is designed to help you explore, analyze, and present data effortlessly—whether you're preparing a business report, uncovering trends in sales or user behavior, tracking KPIs, or generating insights for decision-making. It’s ideal for anyone who works with spreadsheets and needs to turn raw data into clear visuals, meaningful takeaways, and presentation-ready slides—all without technical skills or manual effort.
What is Powerdrill Bloom?+
Powerdrill Bloom is an AI-powered data exploration canvas that uses a team of data agents to automatically clean, analyze, and visualize your data, helping you turn spreadsheets into actionable insights and presentations—without coding.
What are AI data agents in Bloom?+
AI data agents are intelligent assistants that specialize in different stages of analysis. For example, one agent understands your data schema, another generates meaningful charts and insights, while others suggest deeper questions or help summarize findings.