Fakta Data: Efek Piala Dunia terhadap Pasar Saham Global di Tahun 2026
TL;DR — "Kutukan" Pasar World Cup dalam 5 Angka
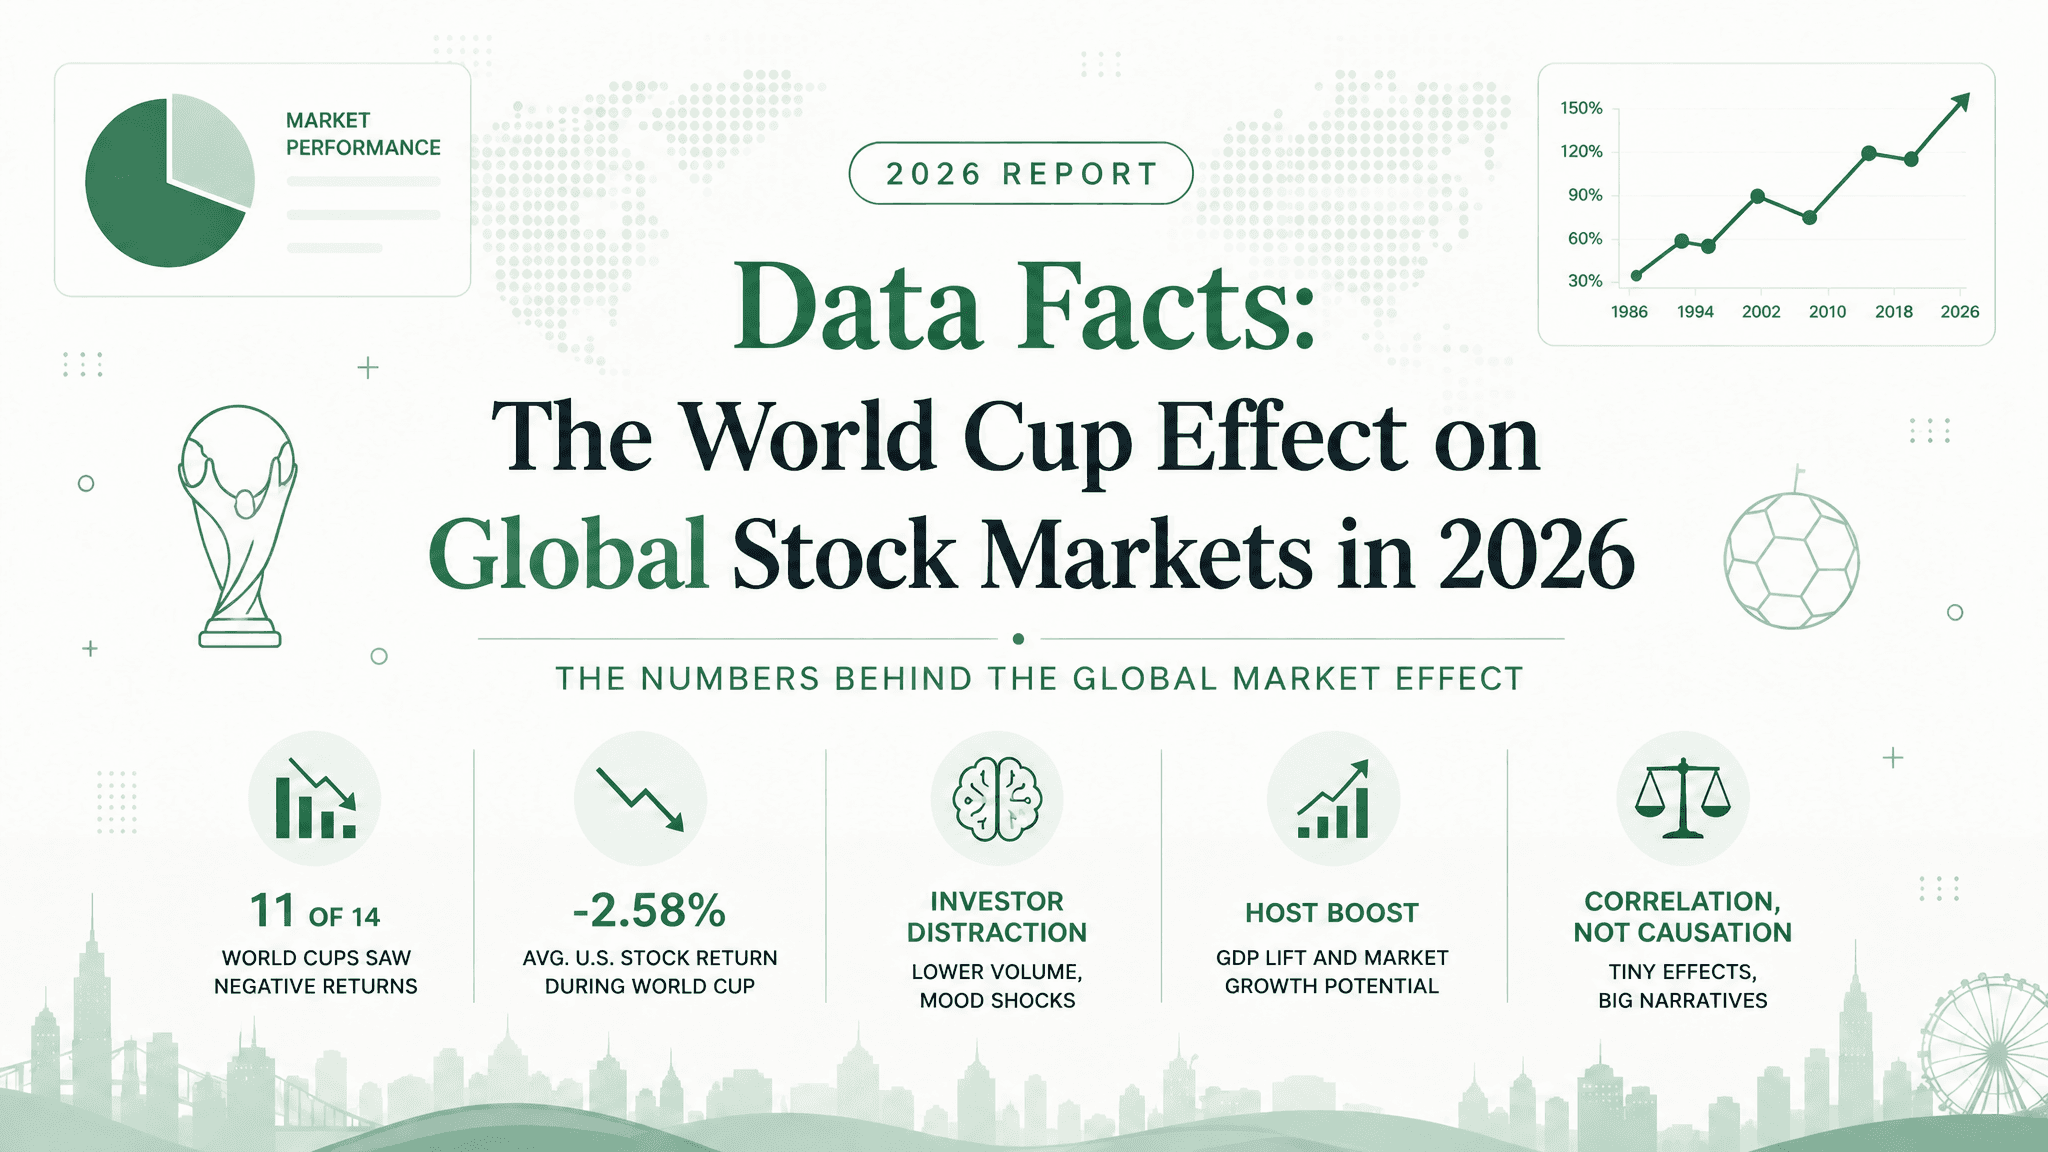
Setiap empat tahun sekali, saat dunia menyaksikan World Cup, bisikan yang tidak asing terdengar di lantai bursa: turnamen ini membawa kutukan bagi saham. Berikut adalah dampak historis World Cup terhadap pasar dalam lima angka:
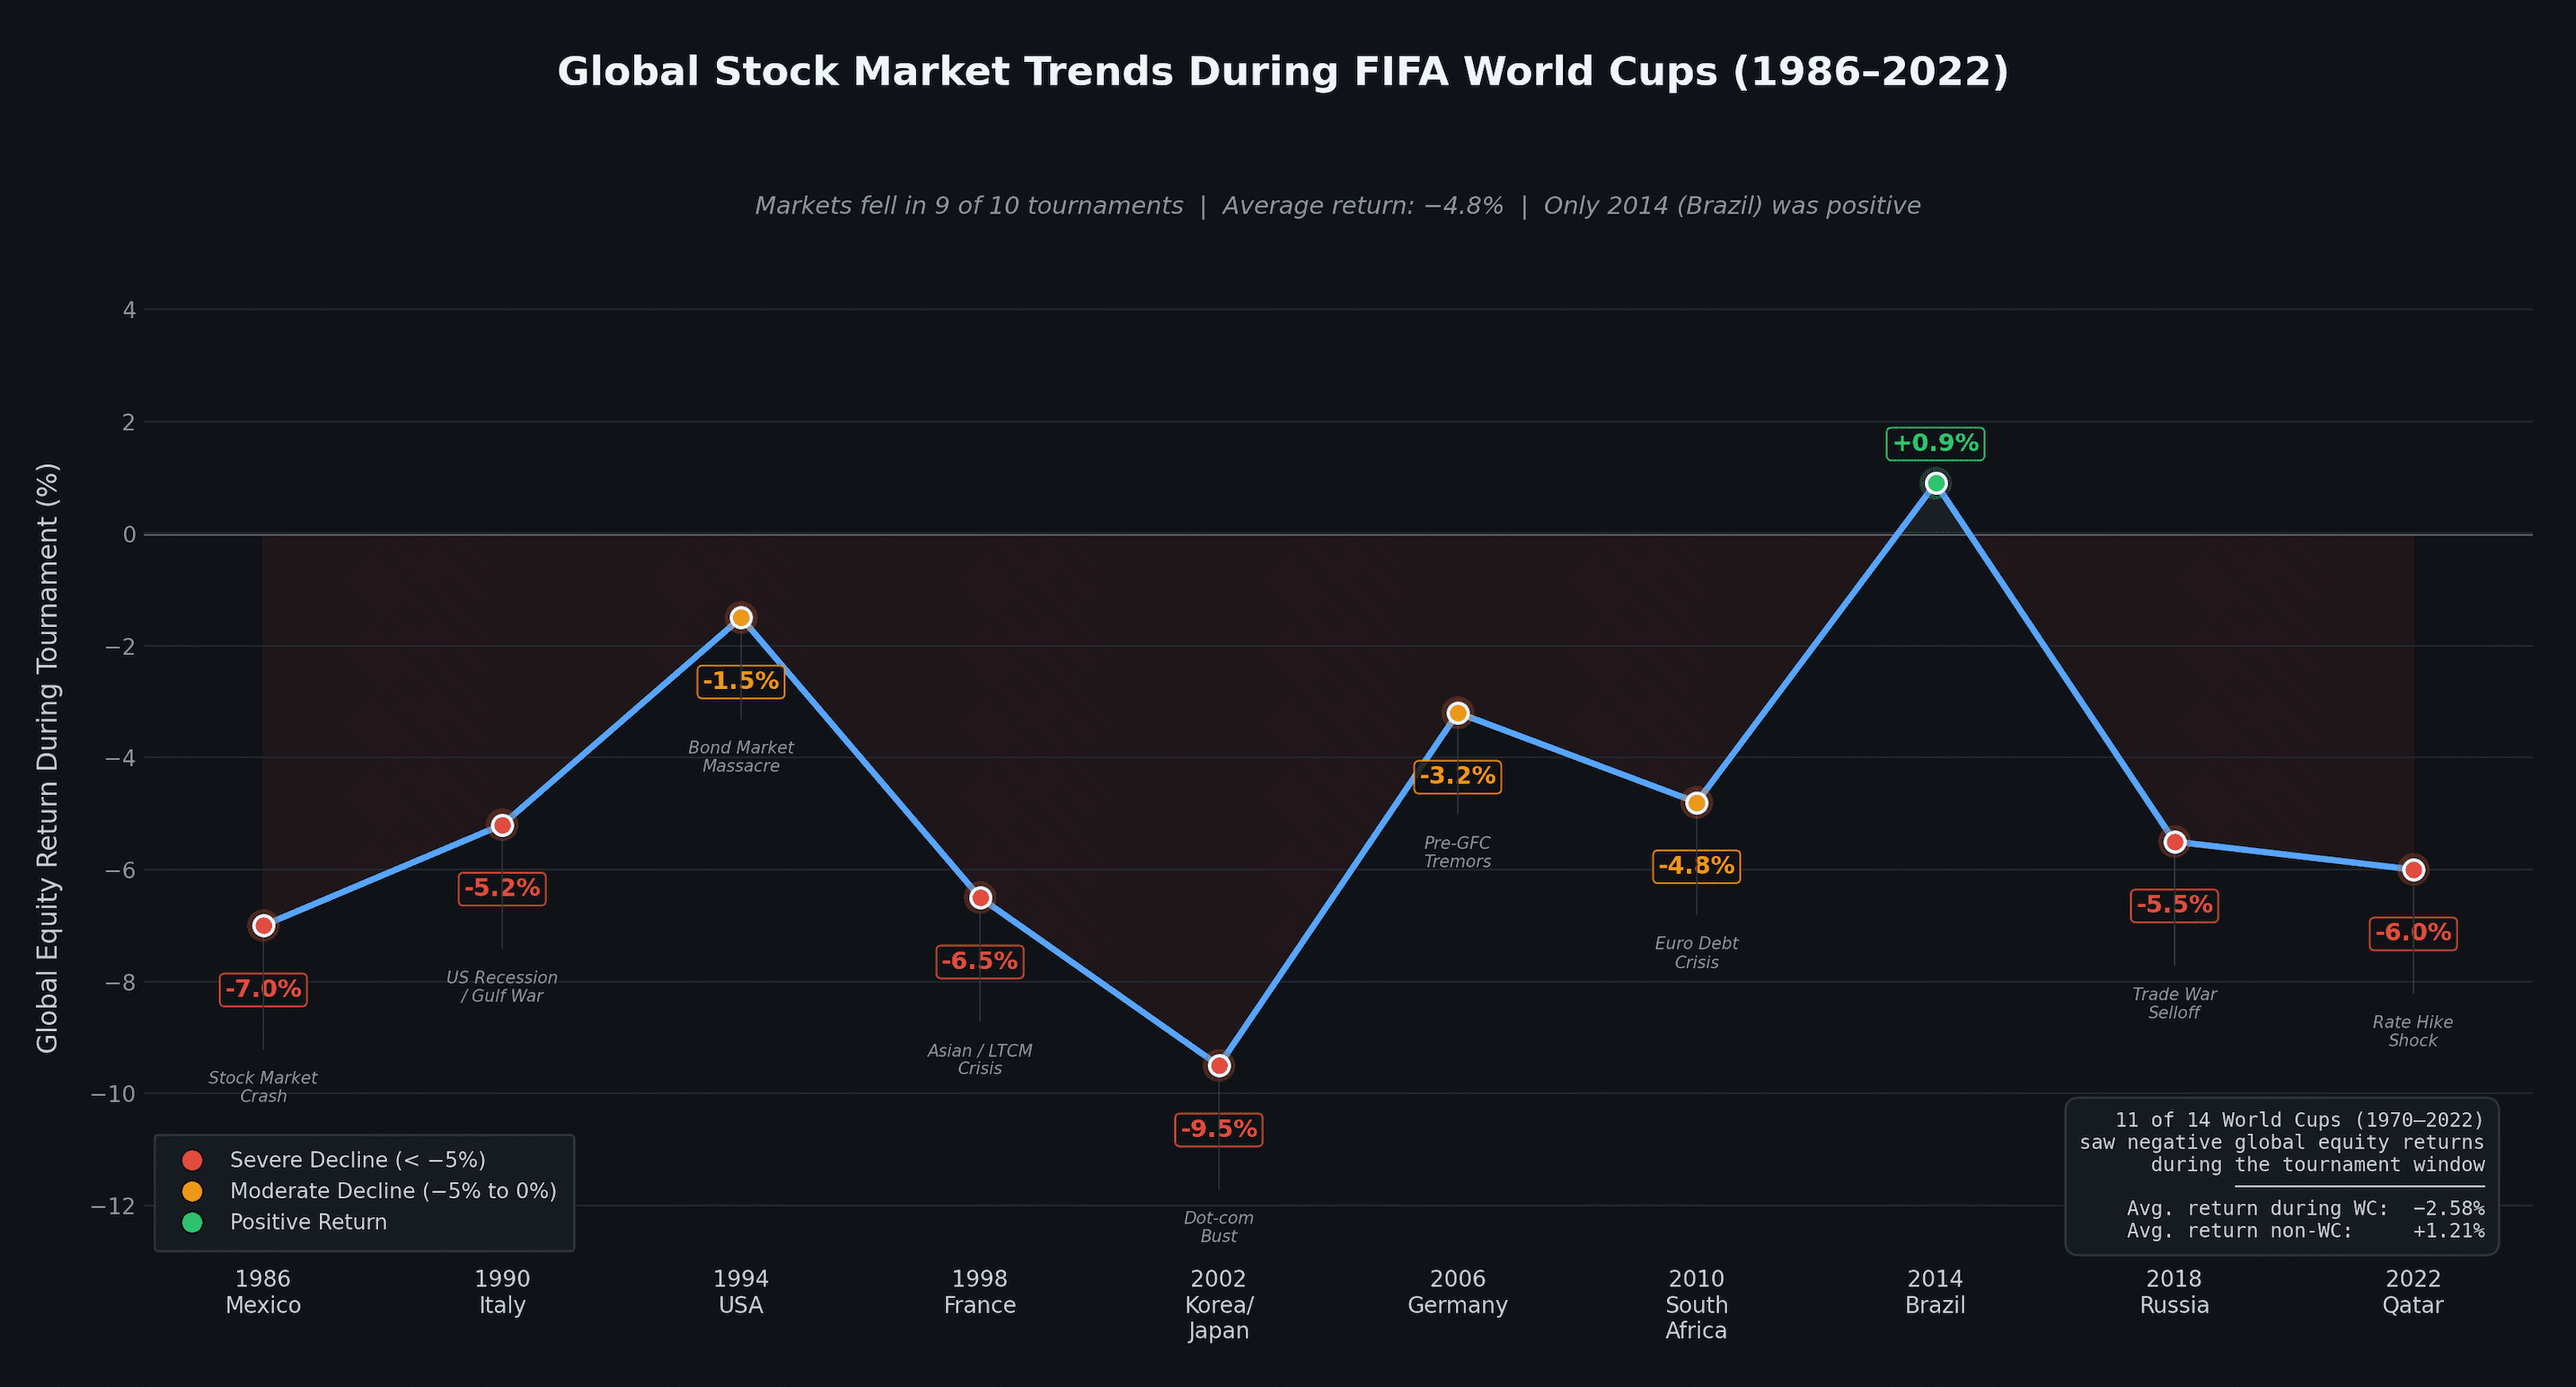
- 11 dari 14 World Cup terakhir bertepatan dengan penurunan pasar saham global — tingkat kejadian sebesar 78.6% untuk imbal hasil negatif selama periode turnamen.
- -2.58% adalah rata-rata imbal hasil saham AS selama periode World Cup, dibandingkan dengan +1.21% untuk periode non-turnamen yang setara.
- Volume perdagangan turun sekitar ~55% selama pertandingan berlangsung karena terjadinya "kurangnya perhatian investor".
- Kekalahan tim nasional dalam pertandingan eliminasi memicu rata-rata imbal hasil abnormal sebesar -49 basis poin keesokan harinya di pasar saham negara tersebut.
- 92% negara pemenang World Cup melihat pasar saham mereka mengungguli pasar global sebesar ~3.5-5.5% pada bulan setelah kemenangan mereka.
Versi singkatnya: "Kutukan" World Cup adalah narasi menarik yang bertepatan dengan siklus ekonomi yang kebetulan, namun hal ini memicu riak yang nyata dan terukur dalam perilaku investor.
Sedikit Latar Belakang
Saat FIFA World Cup 2026 dimulai di AS, Kanada, dan Meksiko, perdebatan lama kembali muncul: apakah ajang olahraga terbesar di bumi ini benar-benar menggerakkan pasar keuangan global? Selama beberapa dekade, para analis telah mencatat korelasi aneh antara turnamen empat tahunan ini dan penurunan ekuitas global.
Apa yang dimulai sebagai lelucon takhayul kini telah berkembang menjadi subjek penelitian keuangan perilaku yang sah. Kami menarik data historis, studi akademis, dan imbal hasil pasar untuk memisahkan mitos dari matematika.
Tentang Dataset
Laporan ini menyintesis data yang mencakup lebih dari 50 tahun turnamen World Cup dan kinerja pasar saham global yang sesuai. Sumber data mencakup indeks historis MSCI World Index dan imbal hasil ekuitas AS, penelitian akademis tentang keuangan perilaku (seperti studi penting Edmans, Garcia & Norli 2007), catatan ECB tentang kurangnya perhatian investor, serta analisis pasar dari Goldman Sachs dan William Blair.
Tentang Alat
Setiap grafik dalam laporan ini dibuat dengan Powerdrill Bloom, agen analisis data berbasis AI. Kami mengunggah data kinerja mentah dan lini masa historis, lalu Bloom membersihkannya, menyarankan jalur eksplorasi, dan menghasilkan grafik di bawah ini secara otomatis — tanpa SQL, tanpa Python, tanpa pemformatan manual. Jika Anda ingin menjelajahi dataset keuangan serupa sendiri, lihat alat visualisasi data AI kami.
Poin-Poin Penting
- Penurunan historis itu nyata. Pasar global mengalami penurunan di hampir 80% periode World Cup.
- Siklus ini selaras dengan krisis. Siklus 4 tahunan World Cup sayangnya sangat bertepatan dengan peristiwa makro besar: menjelang Black Monday 1987, Krisis Keuangan Asia 1998, pecahnya gelembung Dot-com 2002, dan guncangan kenaikan suku bunga 2022.
- Sepak bola mengalihkan perhatian para trader. Median transaksi turun sebesar 45% dan volume perdagangan turun sebesar 55% saat tim nasional sedang bermain.
- Sentimen memengaruhi pasar. Kekalahan dalam pertandingan eliminasi secara harfiah menekan pasar saham nasional keesokan harinya (-49 bps), sementara saham "tipe perjudian" di Tiongkok secara historis melihat imbal hasil positif yang tidak biasa selama turnamen.
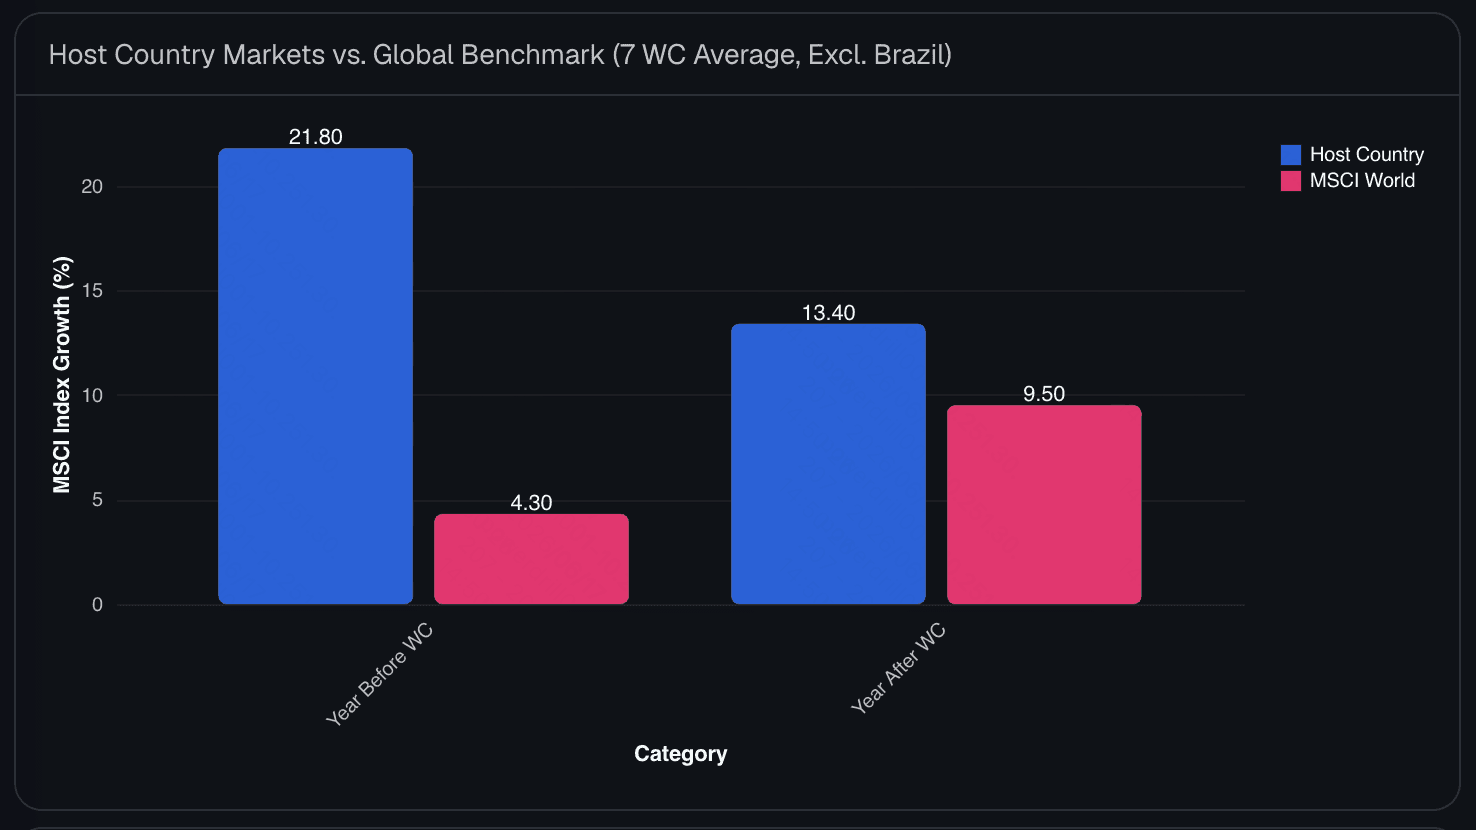
- Tuan rumah mendapatkan dorongan infrastruktur. Negara tuan rumah secara signifikan mengungguli tolok ukur global pada tahun sebelum (+21.8%) dan tahun setelah (+13.4%) turnamen.
Efek World Cup: Rincian Data Lengkap
P1: Apakah siklus "kutukan" empat tahunan ini benar-benar disebabkan oleh World Cup?
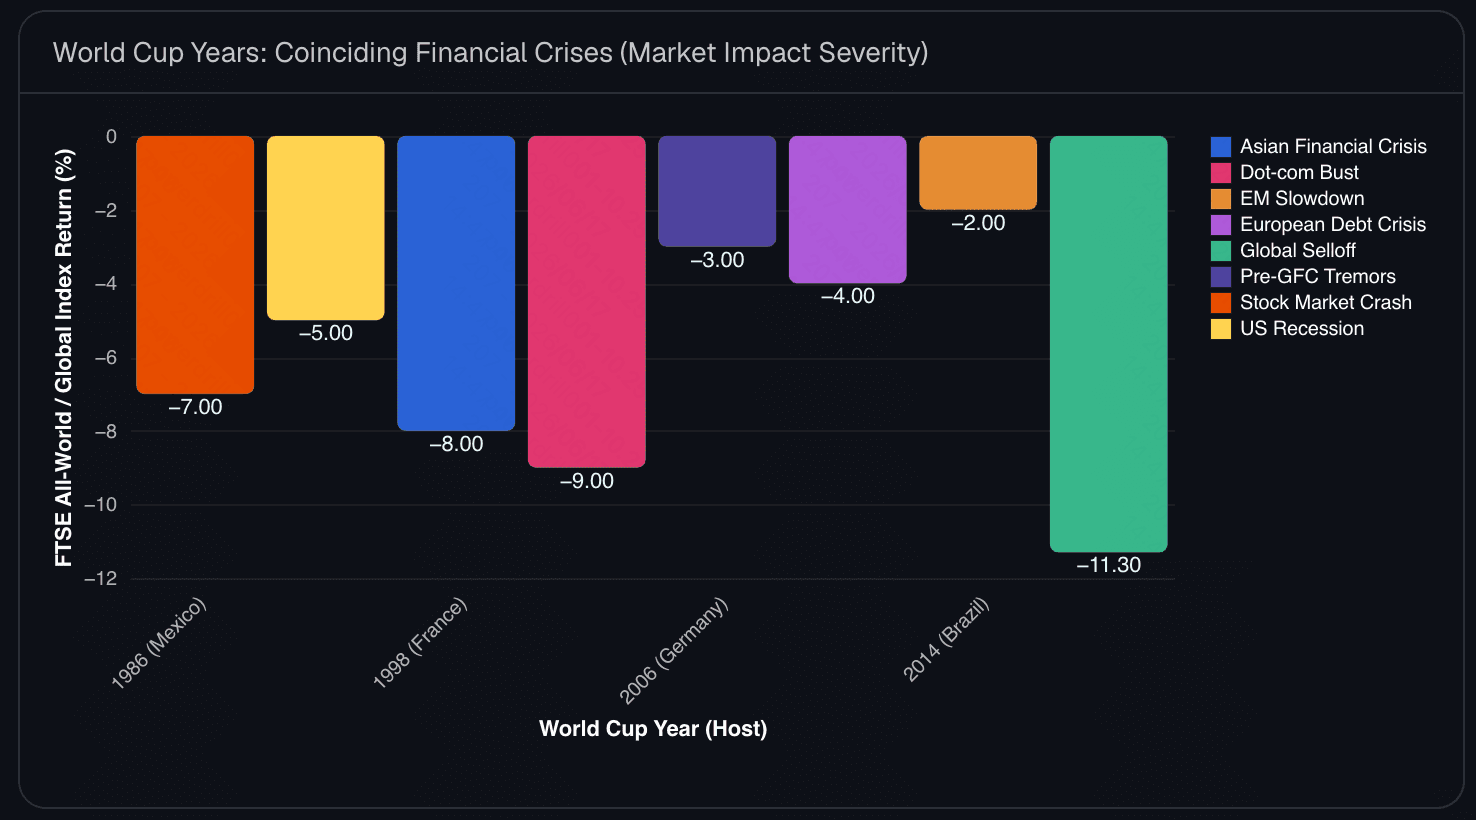
Polanya memang mencolok, namun ini hanyalah kasus korelasi, bukan sebab-akibat. Setiap empat tahun sekali, gangguan keuangan besar tampaknya terjadi mendekati World Cup: tahun 1994 terjadi kehancuran pasar obligasi, tahun 2008 didahului oleh guncangan pra-GFC pada tahun 2006, tahun 2010 bertepatan dengan krisis utang Eropa, dan tahun 2022 terjadi tepat saat kenaikan suku bunga yang agresif dan runtuhnya FTX.
Namun, siklus 4 tahunan ini juga sangat selaras dengan siklus pemilu sela atau presiden AS serta keteraturan makro lainnya. Sepak bola tidak menyebabkan kehancuran pasar; secara historis sepak bola kebetulan sedang ditayangkan di TV saat hal itu terjadi.
P2: Apakah memenangkan World Cup mendongkrak pasar saham suatu negara?
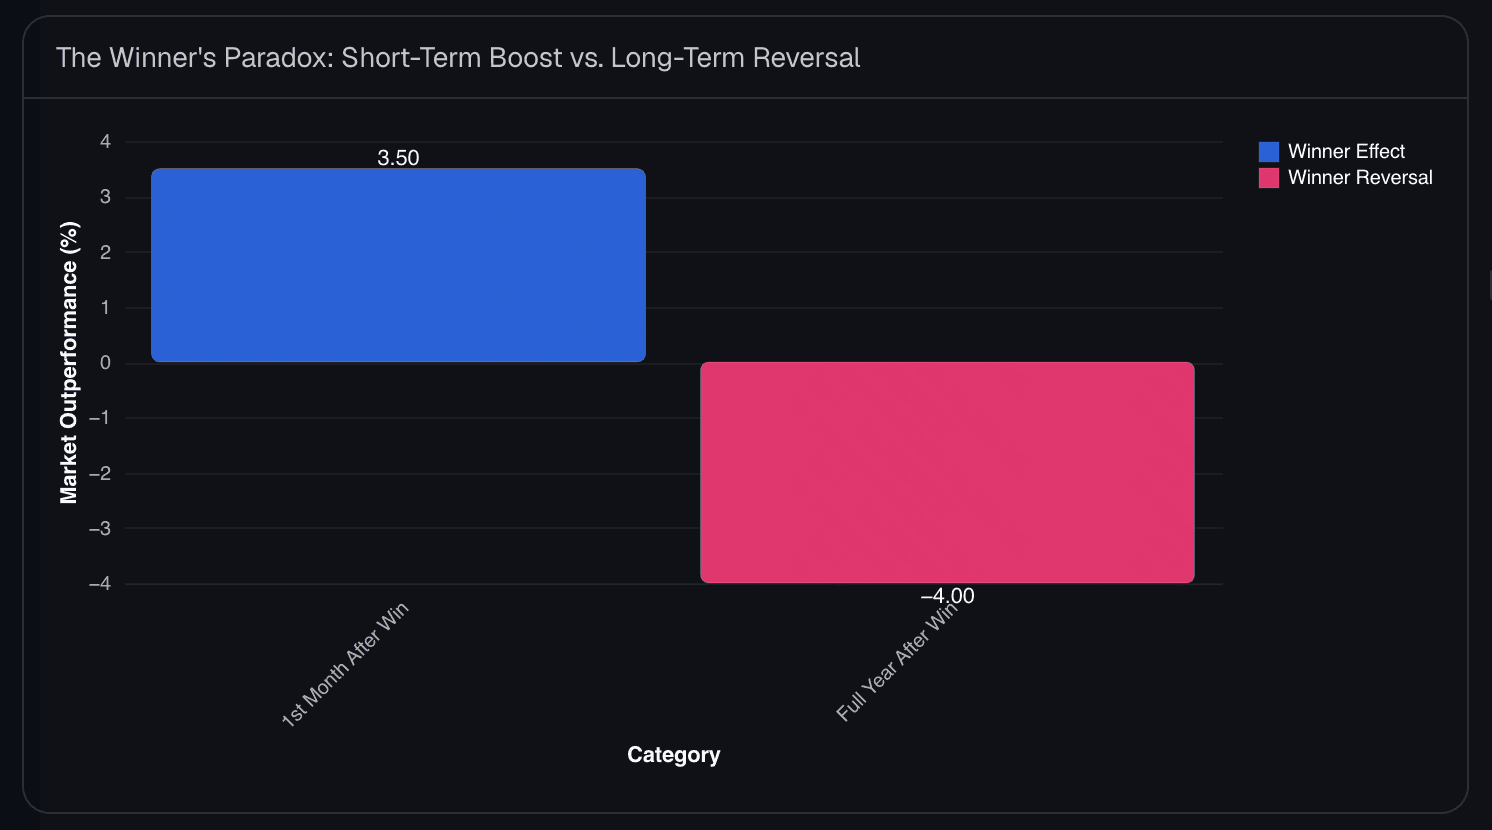
Ya, tetapi hanya sebentar, yang mengarah pada apa yang kami sebut "Paradoks Pemenang." Penelitian mengungkapkan bahwa 92% negara pemenang melihat pasar saham mereka mengungguli tolok ukur global sebesar 3.5% hingga 5.5% pada bulan setelah kemenangan.
Namun, ini murni sentimen dan euforia. Dalam jangka panjang, pembalikan rata-rata (mean-reversion) akan terjadi: pasar negara pemenang yang sama biasanya berkinerja buruk sebesar -4% selama tahun berikutnya. Contoh paling ekstrem adalah Jerman pada tahun 1990, yang berkinerja buruk di bawah pasar global sebesar -18.5% pada tahun setelah mengangkat trofi.
P3: Bagaimana nasib negara tuan rumah dibandingkan dengan negara-negara lain di dunia?
Meskipun pasar global mungkin tersandung selama turnamen, negara tuan rumah biasanya menikmati pesta ekonomi yang berkelanjutan. Rata-rata, indeks MSCI negara tuan rumah tumbuh +21.8% pada tahun menjelang World Cup (dibandingkan dengan +4.3% untuk MSCI World) dan +13.4% pada tahun berikutnya (dibandingkan dengan +9.5% untuk MSCI World).
Hal ini didorong oleh pengeluaran infrastruktur yang masif, antisipasi pariwisata, dan kenaikan PDB dasar sebesar +0.4%. (Brasil pada tahun 2014 tetap menjadi contoh peringatan yang menonjol, merosot 34% di tengah krisis domestik, menunjukkan bahwa sepak bola tidak dapat menutupi kebobrokan ekonomi yang mendasar).
Apa Artinya Ini bagi Bisnis dan Investor?
Untuk World Cup 2026 di seluruh Amerika Utara, skalanya belum pernah terjadi sebelumnya: diperkirakan akan ada lebih dari 6 miliar penonton global, 6.5 juta penggemar yang hadir langsung, dan perkiraan dampak PDB global sebesar $40.9 miliar. Bank of America mencatat bahwa 75% penduduk bumi akan terlibat dengan turnamen ini.
Bagi investor, kesimpulannya jelas: Anda tidak dapat mengandalkan perdagangan berdasarkan "kutukan" ini. Meskipun gangguan pada hari pertandingan dan kesedihan akibat eliminasi menciptakan penurunan basis poin yang nyata secara statistik, nilainya terlalu kecil untuk diperdagangkan dan dengan mudah dikalahkan oleh rilis data makro rutin seperti data inflasi atau keputusan bank sentral.
Turnamen 2026 akan memberikan dorongan PDB yang nyata bagi kota-kota tuan rumah dan menyebabkan volume perdagangan menipis selama pertandingan besar di sore hari, tetapi hal itu tidak akan mendikte arah keseluruhan dari S&P 500.
Bagaimana Kami Membuat Grafik Ini (dalam Sekali Klik)
Anda tidak memerlukan tim kuantitatif untuk menganalisis anomali pasar historis seperti ini. Berikut adalah alur kerja tepatnya:
- Unggah data Anda atau mulai dengan keahlian atau topik. Cukup pilih keahlian, masukkan topik, atau masukkan file CSV atau Excel berisi imbal hasil pasar historis ke dalam Powerdrill Bloom.
- Biarkan kanvas mengeksplorasinya. Powerdrill Bloom secara otomatis membersihkan data dan menyarankan jalur eksplorasi cerdas seperti tren tahun-ke-tahun atau perbandingan tuan rumah vs. tolok ukur global, lalu membuat grafik untuk Anda.
- Ekspor ke slide. Ubah seluruh kanvas menjadi dek presentasi yang rapi dan siap pakai, lalu ekspor ke PowerPoint dengan satu klik.
Tanpa SQL. Tanpa Python. Tanpa pemformatan grafik manual. Ingin mencobanya pada dataset keuangan Anda sendiri? Coba Powerdrill Bloom gratis. Anda juga dapat menjelajahi pembuat grafik AI kami atau mempelajari cara mengubah spreadsheet menjadi slide.
FAQ
Apakah kutukan pasar saham World Cup itu nyata?
Pola datanya nyata, pasar global mengalami penurunan selama 11 dari 14 World Cup terakhir, tetapi ini adalah korelasi, bukan sebab-akibat. Penurunan tersebut didorong oleh siklus makroekonomi yang kebetulan bertepatan, bukan oleh turnamen itu sendiri.
Apakah sepak bola benar-benar memengaruhi perilaku perdagangan?
Ya. Studi akademis menunjukkan bahwa volume perdagangan turun sekitar 55% selama pertandingan karena "kurangnya perhatian investor," dan pasar nasional turun rata-rata 49 basis poin sehari setelah tim nasional kalah dalam pertandingan eliminasi.
Bisakah saya menghasilkan uang dengan memanfaatkan efek World Cup?
Kemungkinan besar tidak. Anomali pasar perilaku seperti penurunan sentimen sangatlah kecil (dalam basis poin) dan dengan cepat dihilangkan oleh perdagangan algoritmik atau tertutupi oleh berita ekonomi standar.
Apa yang terjadi pada pasar saham negara yang menjadi tuan rumah?
Negara tuan rumah secara historis melihat adanya "dorongan." Indeks lokal mereka biasanya mengungguli tolok ukur global dengan selisih yang lebar pada tahun sebelum (+21.8%) dan tahun setelah (+13.4%) karena pengeluaran infrastruktur dan pariwisata.
Bisakah saya menganalisis data pasar saham saya sendiri seperti ini?
Ya. Unggah file CSV atau Excel berisi imbal hasil ekuitas historis ke Powerdrill Bloom dan alat ini akan membersihkan data, membuat grafik, dan memungkinkan Anda mengekspor dek slide — tanpa perlu coding.
Kesimpulan
Angka-angka di balik "kutukan" pasar World Cup menceritakan kisah menarik tentang perilaku manusia yang berinteraksi dengan keuangan global. Meskipun sepak bola tidak menyebabkan krisis keuangan, hal itu tidak diragukan lagi mengalihkan perhatian para trader, mengubah suasana hati nasional, dan mengalihkan modal.
Karena tahun 2026 menghadirkan World Cup terbesar dalam sejarah ke Amerika Utara, perkirakan stimulus ekonominya akan sangat besar, hanya saja jangan menyalahkan wasit jika pasar saham kebetulan sedang mengalami hari yang lesu.
Penasaran dengan apa yang tersembunyi di balik data keuangan Anda? Unggah ke Powerdrill Bloom dan biarkan grafik yang menceritakan kisahnya.