How to Turn Google Sheets into Slides Using AI: A Complete 2026 Guide

Introduction
In 2026, spending hours manually copying charts from spreadsheets to presentation decks is no longer a job requirement—it's a bottleneck. The modern workflow demands speed and intelligence.
This guide explores the definitive method to turn Google Sheets into Slides using advanced AI, specifically focusing on how Powerdrill Bloom bridges the gap between raw data and visual storytelling.
While this article focuses specifically on transforming spreadsheet data into deep insights, if you are looking to generate presentations from broader topics or general documents, you can check out our guide on Create PPT Slides from Any Topic or File with AI. However, if your goal is to unlock the hidden value in your Google Sheets and automate your reporting, read on.
What is Google Sheets?
Google Sheets is the cloud-based spreadsheet standard for modern enterprise collaboration. By 2026, it has evolved beyond simple rows and columns into a dynamic data warehouse that connects with live data sources. It is the backbone of financial reporting, marketing analytics, and project tracking for millions of businesses worldwide.
Why Use AI to Analyze Google Sheets?
Why automate? The answer lies in the "Three S's" of modern productivity:
Speed: Transform a 5-hour monthly reporting task into a 5-minute review.
Safety: Eliminate human error. No more copy-paste mistakes where Q3 revenue accidentally becomes Q4 projection.
Storytelling: AI doesn't just display numbers; it identifies the narrative behind the data (e.g., "Why did churn spike in May?").
How Does AI Turn Sheets into Slides? Simple Steps
The magic happens in four distinct phases:
Data Ingestion: The AI reads your Google Sheet, Excel, or CSV file, understanding headers and data types.
Insight Extraction: Algorithms scan for patterns, outliers, and trends that a human eye might miss.
Visual Mapping: The AI selects the correct chart type (e.g., Waterfall for financial variance, Scatter for correlation).
Slide Generation: The engine renders these visuals into editable slides with professional layouts.
Comparison with Existing Tools
When searching for the best Google Sheets to Slides AI, three names dominate the conversation. Here is how they stack up:
Powerdrill Bloom (Best for Data Visualization & Insights)
The undisputed leader in 2026. It is a specialized Data Agent that connects directly to Sheets, cleans data, and uses the Nano Banana Pro engine to render stunning, analyst-grade slides.
Google Gemini (Best for Workspace Text Integration)
Excellent for drafting emails or summarizing text within Drive, but lacks the granular control for complex data visualization and custom chart styling.
ChatGPT (Data Analyst)
Great for Python-based analysis, but often struggles to export native, editable PowerPoint slides with sophisticated design layouts.
Verdict: For professional reporting, Powerdrill Bloom offers the deepest integration and best visual output.
What Does Powerdrill Do?
Powerdrill Bloom is not just a tool; it's an intelligent agent designed for Automated Reporting.
Seamless Integration: Drag and drop your Google Sheets/Excel files. It automatically handles messy data (e.g., merged cells, missing values).
Natural Language Processing: Simply ask, "Compare Q1 vs Q2 sales by region and tell me why revenue dropped." Powerdrill analyzes the data and provides answers.
Nano Banana Pro: This is the secret weapon. It’s a rendering engine that ensures every chart generated is aesthetically perfect—balanced colors, readable fonts, and correct proportions.
Step-by-Step Guide
Step 1: Upload your Google Sheet or Excel file to Powerdrill.
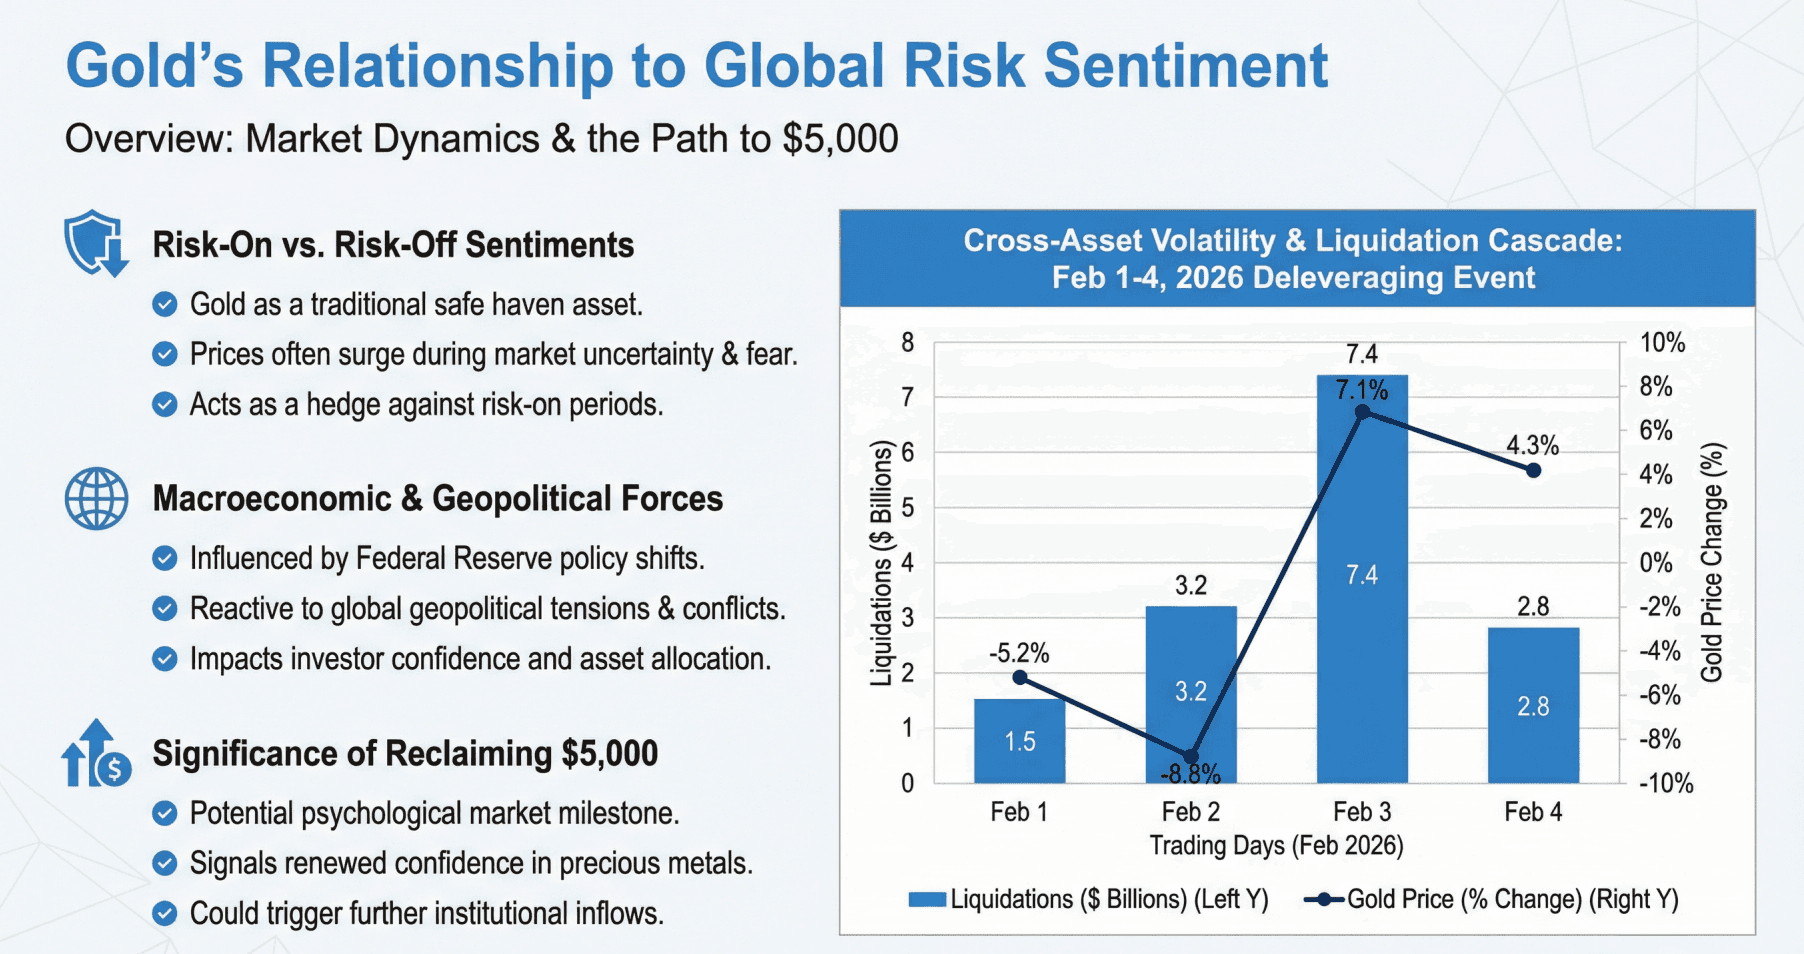
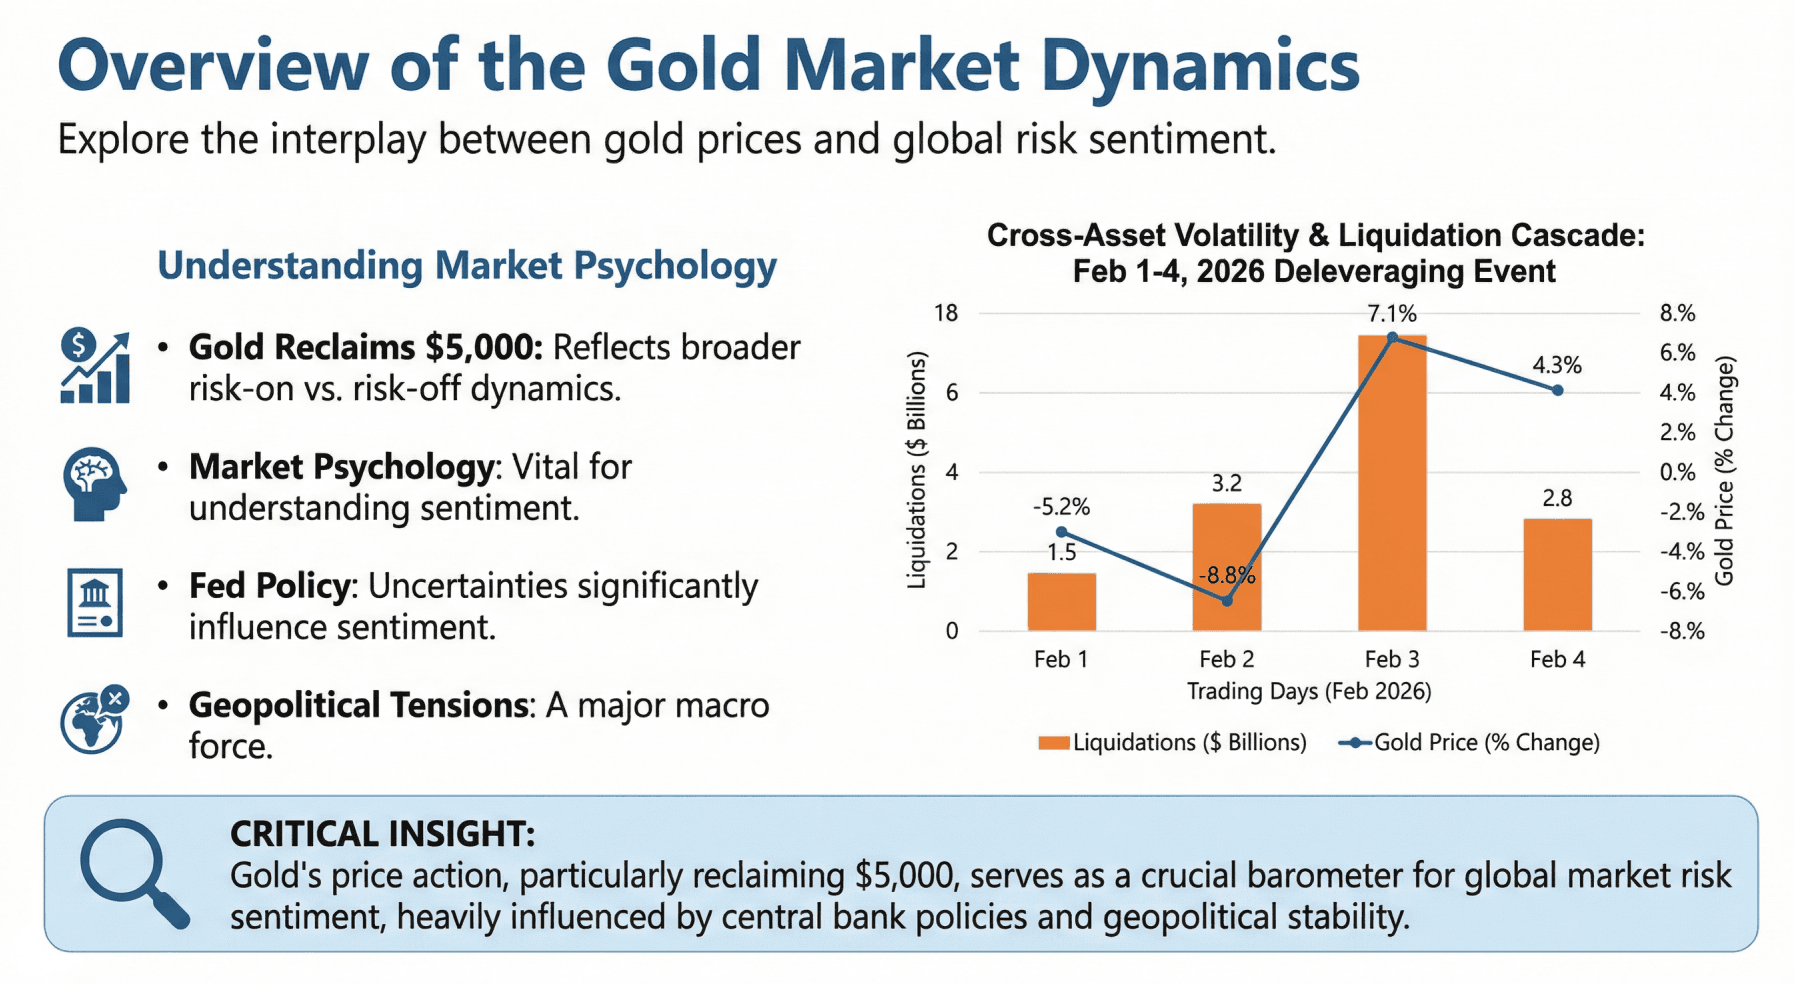
Step 2: Type a prompt like "Analyze the trend of gold prices."
Step 3: The AI cleans the data and generates preview charts.
Step 4: Click "Generate Slides" and select your preferred business style.
Step 5: Download the editable PPTX file.
Try Powerdrill Bloom today and see the difference.
Example Use Cases: Styles & Skills
Powerdrill Bloom doesn't just "make charts"; it applies professional design languages:
McKinsey Style
Minimalist, high-contrast waterfall and bar charts designed for C-level strategy meetings.
Dashboard Style
High-density layouts perfect for weekly operations reviews.
SaaS Metrics
Specialized visualizations for MRR, Churn, and LTV/CAC ratios.
BI Style
Rigorous, data-heavy visuals suitable for financial auditing and Business Intelligence reports.

Benefits of Automated Reporting and Slides with Powerdrill
Consistency: Every slide follows your brand guidelines.
Actionable Insights: Move from "what happened" to "what to do next" faster.
No Code Required: You don't need SQL or Python skills to perform complex data segmentation.
Conclusion
In 2026, manual data reporting is a legacy practice. Tools like Powerdrill Bloom allow you to turn Google Sheets into Slides effortlessly, giving you the power of a data analyst and a graphic designer in one interface. Stop building charts; start telling stories.
Frequently asked questions
How do I turn Google Sheets into slides using AI?
Use Powerdrill Bloom. Upload your sheet, ask the AI to analyze the data, and select "Generate Presentation" to export a fully designed PPT.
What is "Google Sheets into Slides Using AI"?
It refers to using artificial intelligence to automate the extraction of data from spreadsheets and the creation of visual presentation decks, replacing manual entry.
What is the best AI tool for Google Sheets visualization in 2026?
Powerdrill Bloom is currently the top choice due to its Nano Banana Pro rendering engine and ability to extract deep logic from complex datasets.