
At some point in every Bitcoin cycle, a single price level becomes psychologically heavier than all others. In 2026, that number is $150,000.
Using tools like Powerdrill Bloom to synthesize institutional data, capital flow dynamics, and long-cycle technical structures, one conclusion stands out clearly: $150,000 is neither inevitable nor unrealistic—it is the true inflection point of the 2026 Bitcoin cycle.
This analysis is not about hype. It’s about when, under what conditions, and with what probability Bitcoin could realistically clear its most important resistance of the coming cycle.
1. The Core Thesis: Why $150,000 Matters
My primary forecast is precise by design:
Bitcoin has a 38–45% probability of breaking above $150,000 in Q3–Q4 2026, with the most statistically likely breakout window occurring between August and November 2026.
Equally important is the base case. The highest-probability outcome—approximately 58%—places Bitcoin in the $130,000–$150,000 range by Q4 2026.
That framing is intentional. The $150,000 level is not a binary prediction. It represents a critical market inflection, where technical cycle maturity, institutional balance sheet capacity, and psychological resistance converge.
In other words, $150K is not a moonshot narrative. It is the price level where Bitcoin transitions from “institutional adoption” to “institutional digestion.”
2. The Most Likely Path to $150K: Probability Meets Timing
Rather than asking whether Bitcoin can reach $150,000, the more useful question is how far Bitcoin is statistically likely to go—and when friction increases.
Based on multi-model probability analysis:
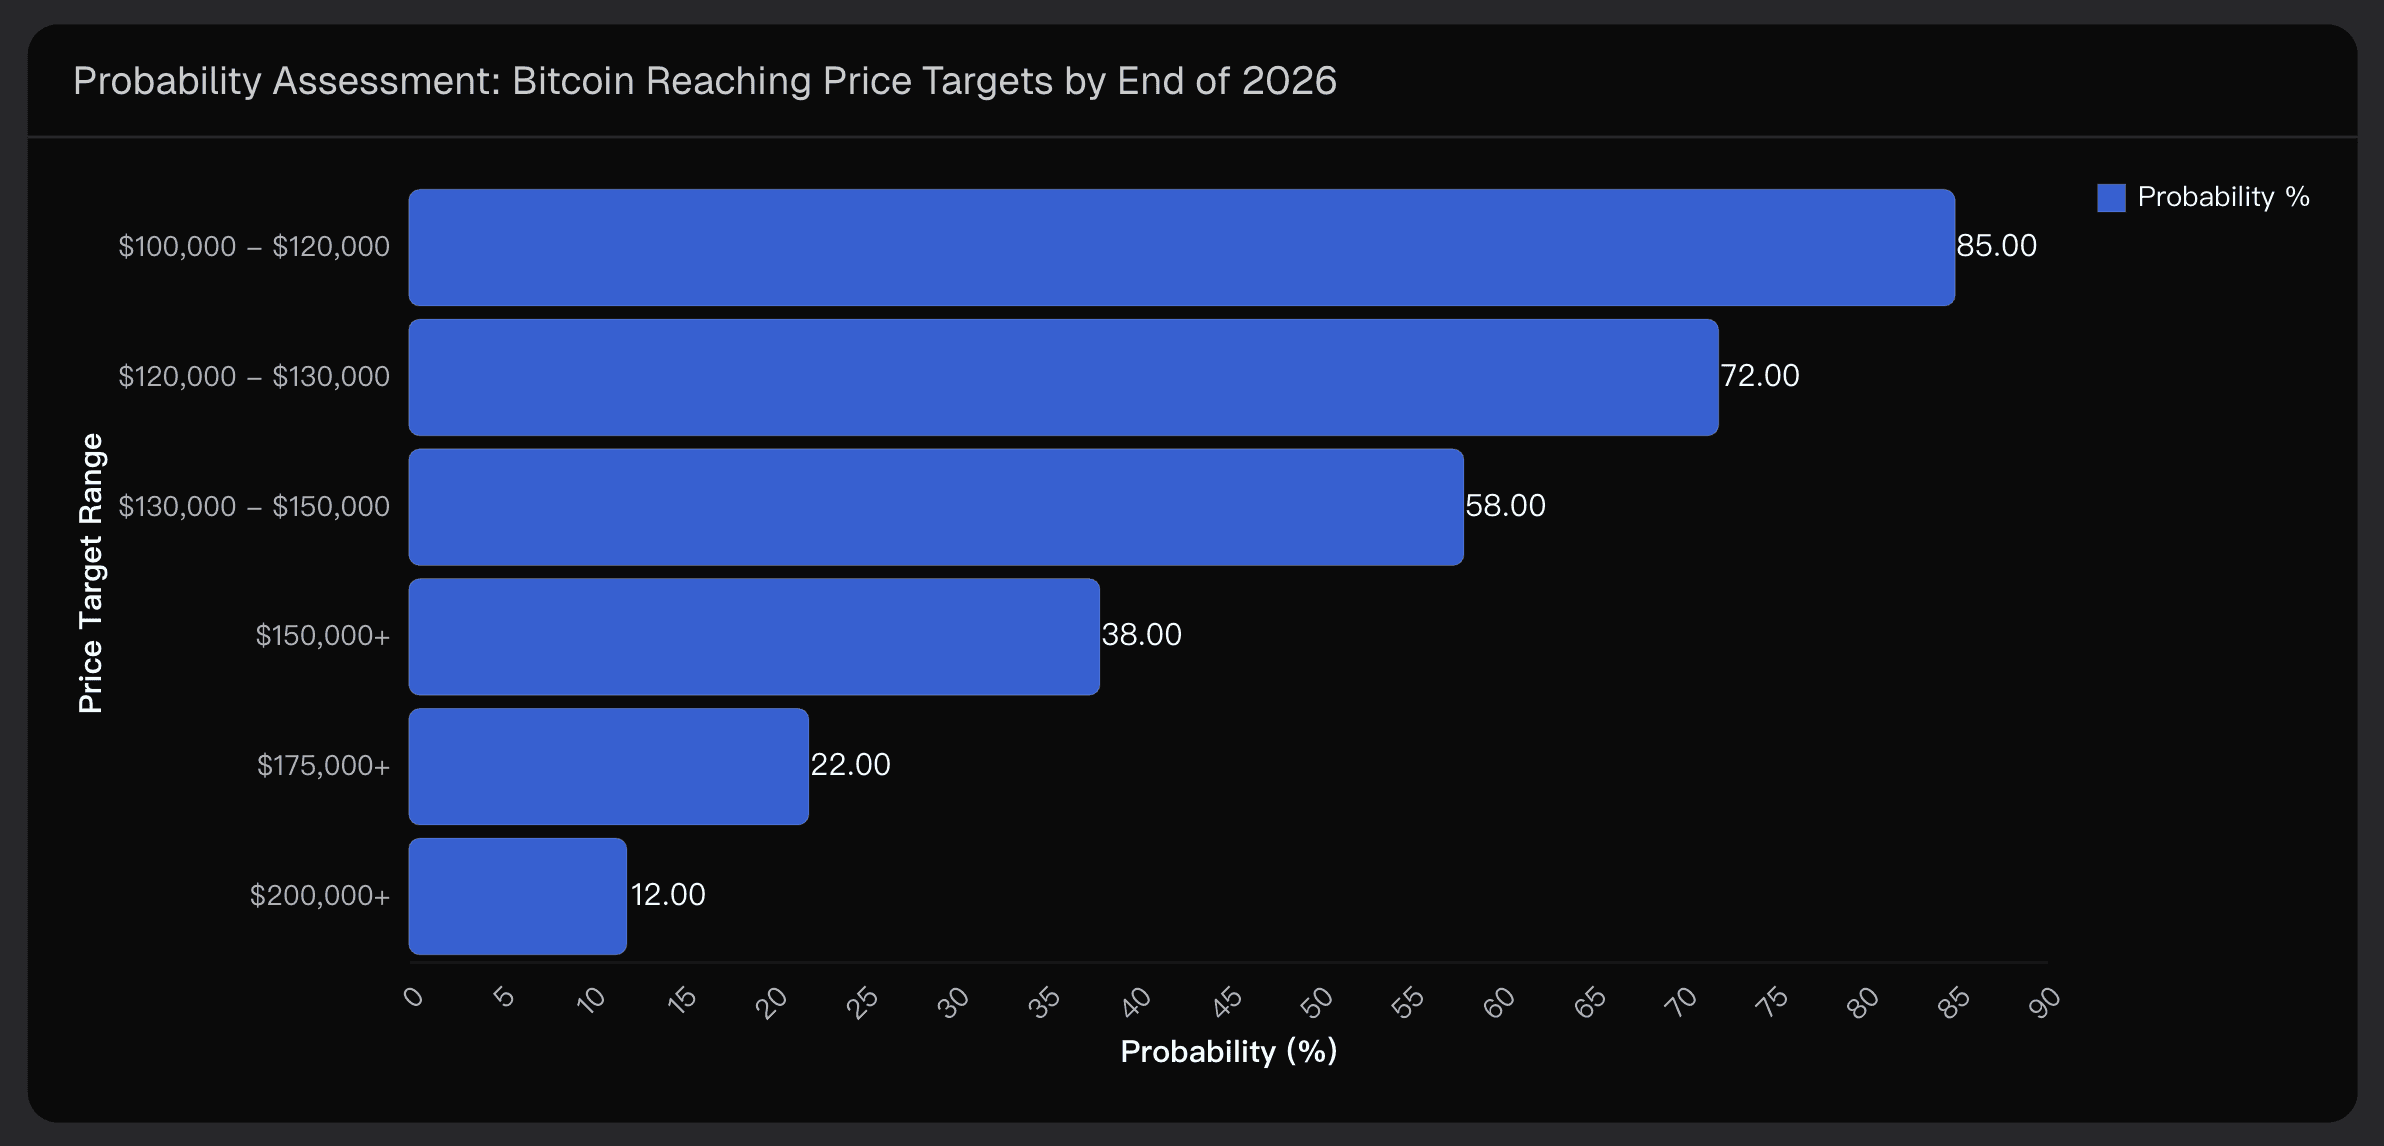
$100K–$120K carries an ~85% probability and represents near-certainty territory, assuming sustained ETF participation.
$120K–$130K holds ~72% probability, supported by long-term Fibonacci extensions and historical cycle behavior.
$130K–$150K forms the core base case at ~58%, requiring continued institutional inflows and stable macro conditions.
$150K+ drops to ~38%, reflecting the higher capital requirements and tighter market structure at that level.
$200K+ remains a tail outcome (~12%), dependent on euphoric sentiment and extraordinary policy or liquidity tailwinds.
These probabilities naturally map onto the 2026 timeline.
The most likely progression looks like this:
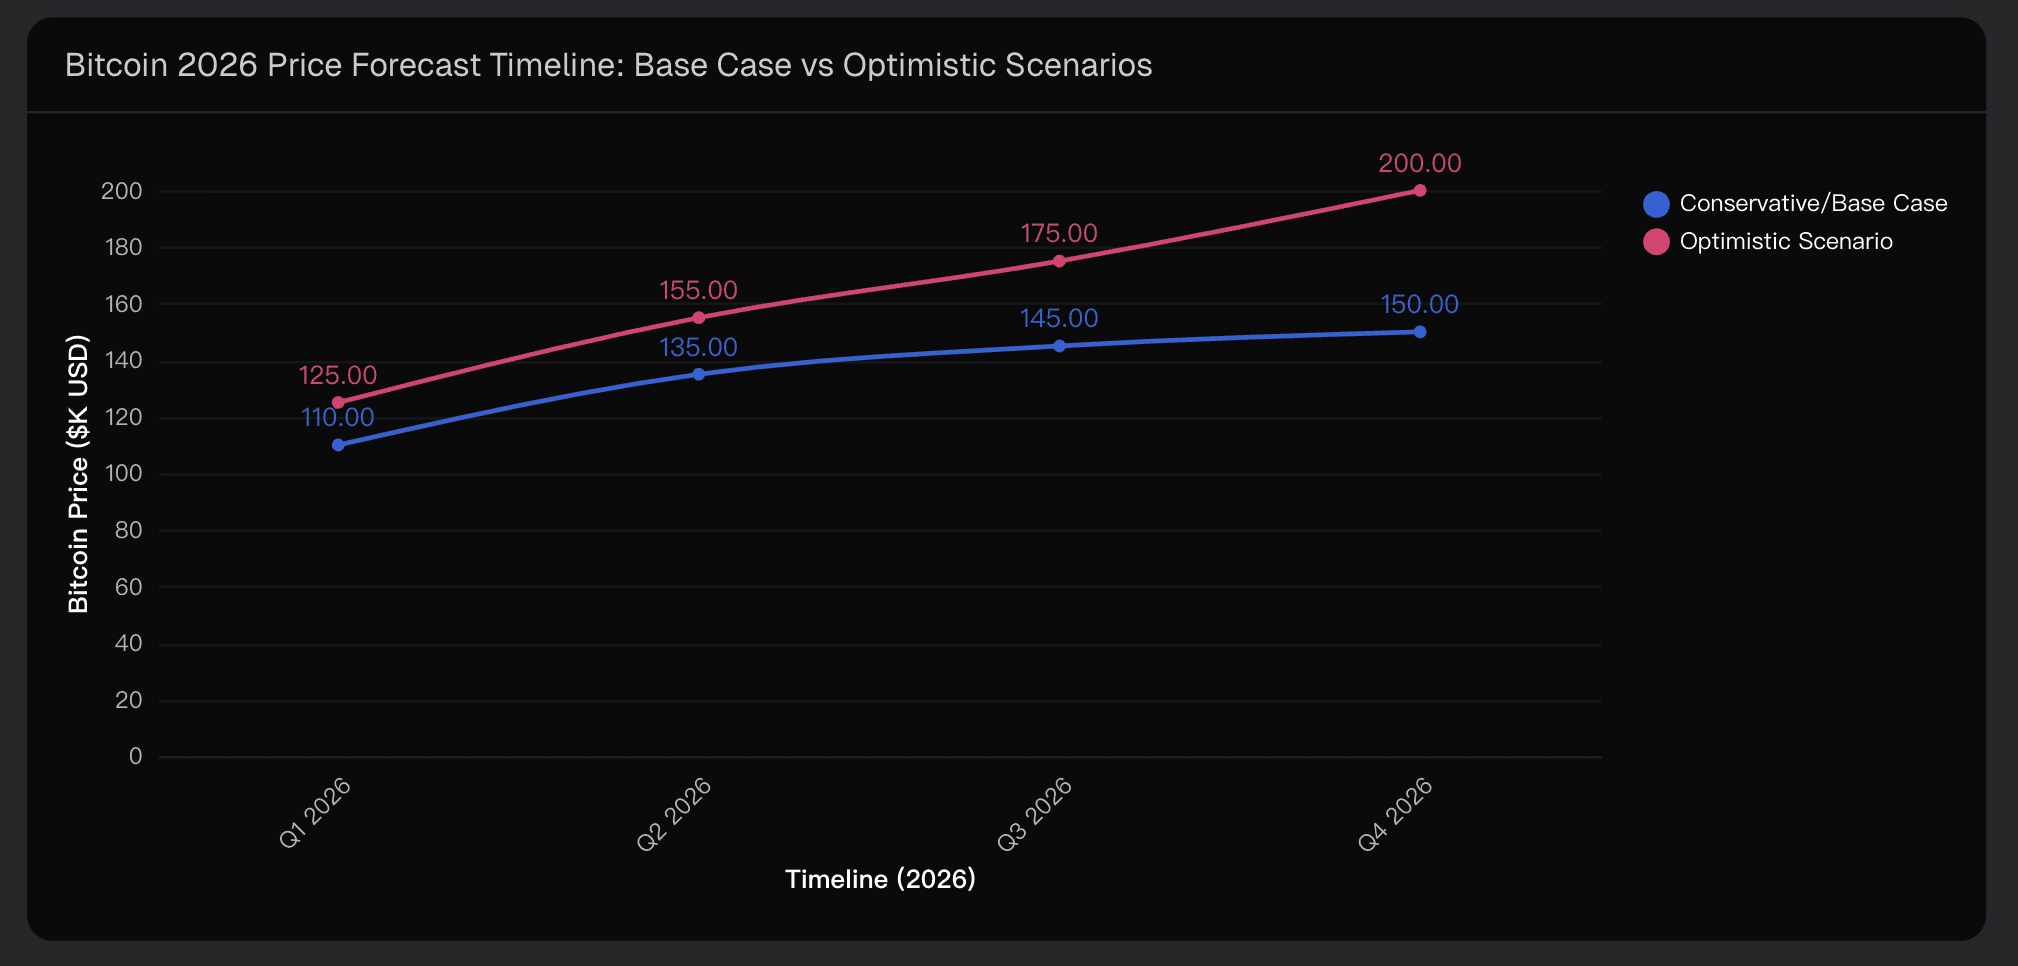
Q1 2026: $95K–$115K, driven by January institutional rotation and improved policy clarity.
Q2 2026: $120K–$140K as the halving-cycle narrative strengthens and $100K becomes firm support.
Q3 2026: $135K–$150K, where resistance compression begins and breakout pressure intensifies.
Q4 2026: $145K–$165K, with a $150K breach becoming plausible—but not guaranteed.
From a timing perspective, September to November 2026 emerges as the single most probable window for a decisive move above $150,000.
3. Why $150,000 Is Plausible — and Why It’s Hard
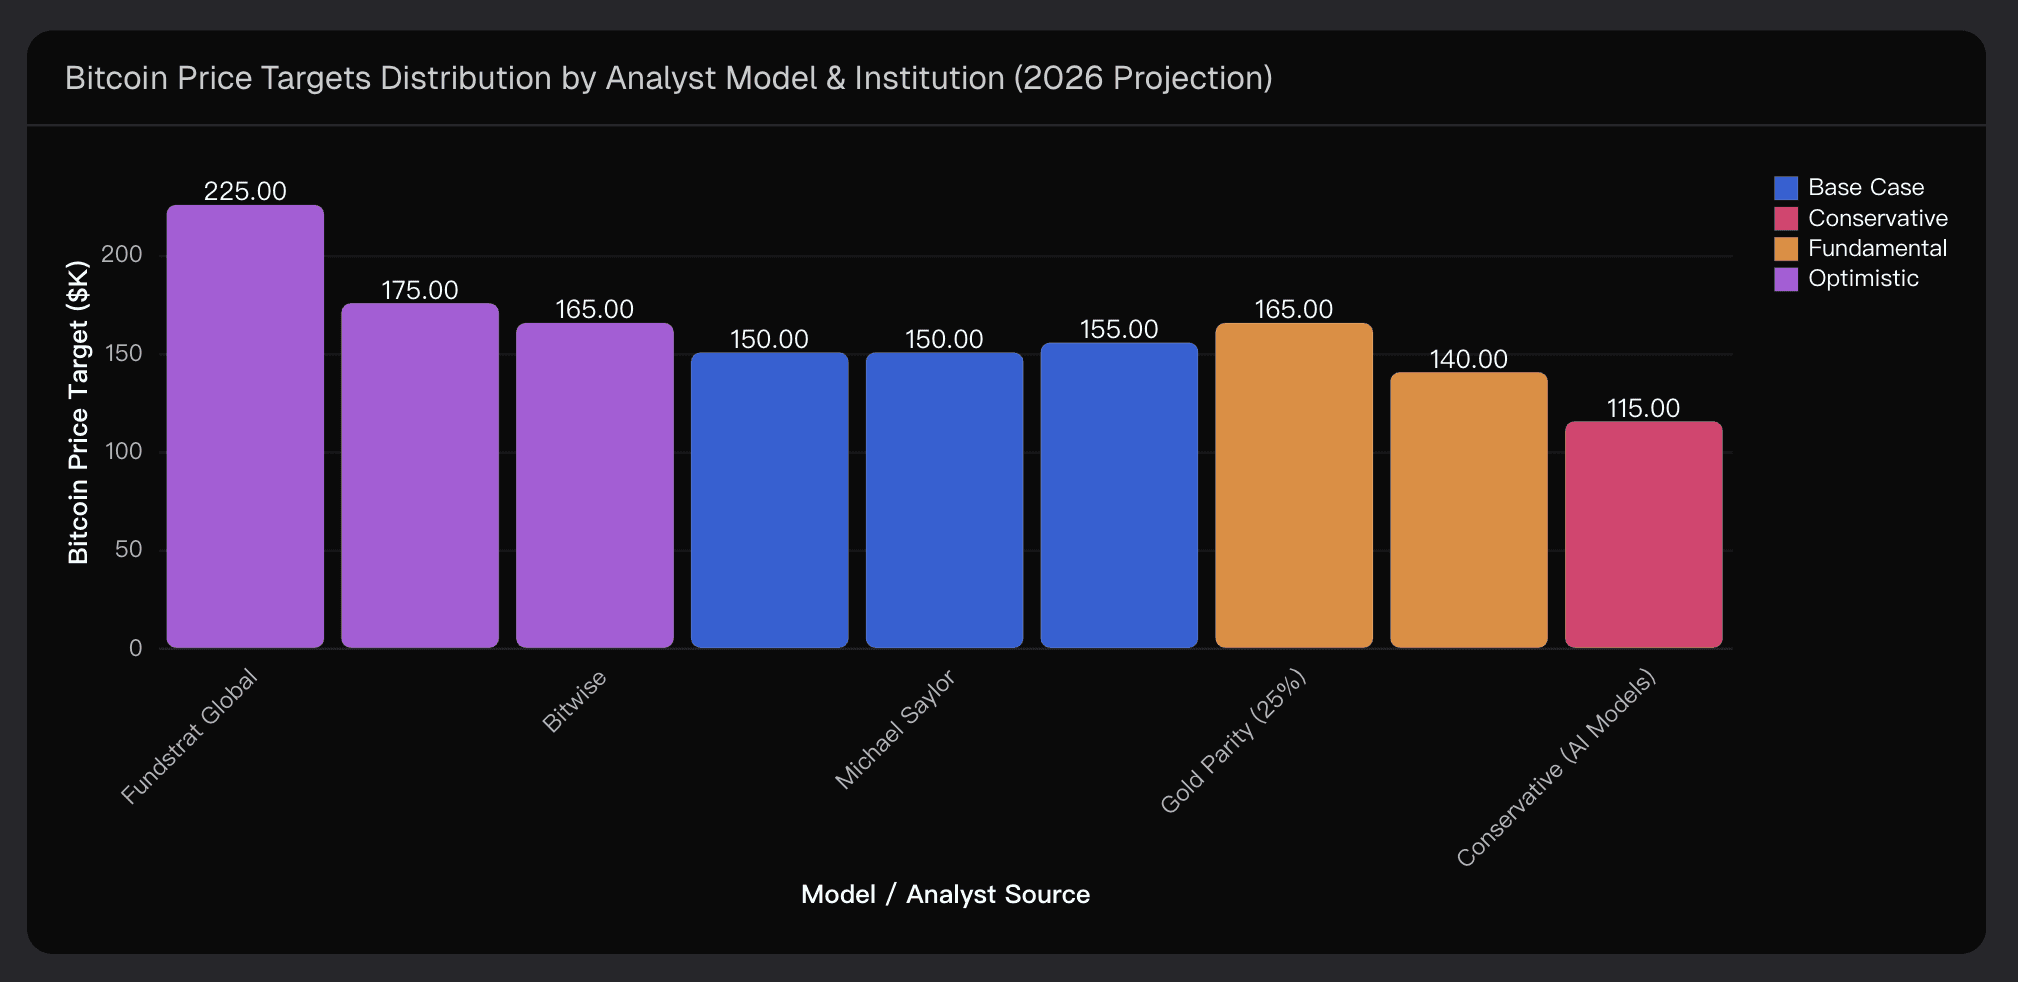
One reason the $150K level keeps resurfacing is institutional convergence. Major analysts, banks, and long-term allocators cluster their 2026 expectations between $150,000 and $175,000, often treating $150K as a structural waypoint rather than a terminal target.
But consensus alone doesn’t move markets—capital does. At roughly $100,000 per Bitcoin, the market capitalization stands near $1.96 trillion. A move to $150,000 implies a market cap around $2.9–3.0 trillion, requiring approximately $980 billion in net capital inflows.
That figure sounds extreme until it’s placed in context:
Gold’s market cap sits near $15–16 trillion
A $150K Bitcoin would still represent only 18–20% of gold’s size
U.S. pension funds manage $11+ trillion in assets
Global endowments, insurers, and sovereign pools collectively dwarf Bitcoin’s current capitalization
Even conservative allocation shifts—0.5% to 2%—translate into hundreds of billions in potential crypto exposure. Realistically, $300–600B in institutional crypto inflows over a full cycle is feasible, with Bitcoin capturing 40–50% of that demand.
Technically, the structure supports this moderation. Each halving cycle has produced lower Fibonacci extension multiples:
2017 peaked near a 4.2x extension
2021 compressed to ~3.6x
2025–2026 projects ~2.6–3.2x
This compression is not weakness—it’s maturity. Under these extensions, the highest probability terminal zone falls between $145,000 and $175,000.
Layer on the structural impact of spot Bitcoin ETFs—which fundamentally altered demand mechanics rather than merely adding short-term flows—and the $150K level becomes mathematically defensible, even if emotionally difficult.
4. What Could Break This Thesis
No probabilistic forecast is complete without acknowledging failure modes.
The most serious risks are external rather than technical. A severe regulatory shock in the U.S. or EU, while low probability, would carry outsized downside impact. A macroeconomic recession in 2026 could delay—but not necessarily invalidate—the cycle, particularly if Bitcoin temporarily re-correlates with risk assets.
Extended ETF outflows beyond normal allocation cycles could cap upside in the $100K–$120K range, while a decisive technical failure below the $85,000 support zone would undermine the base case entirely.
There are also softer risks: narrative fatigue, aggressive profit-taking at round numbers, and capital rotation into non-Bitcoin crypto assets. These wouldn’t destroy the thesis—but they could make any $150K breakout unstable rather than sustained.
Final Synthesis: When Will BTC Break $150,000?
Pulling everything together, my conclusion remains disciplined:
$100K–$130K is the high-confidence zone (72–85% probability).
$130K–$150K is the battleground where conviction meets friction.
Above $150K, alignment—not optimism—determines outcomes.
The capital requirement is heavy, the volatility will be real, and patience will matter far more than narratives. But if Bitcoin breaks $150,000 in 2026, it will not be by accident—it will be the result of structural adoption finally catching up to price.
I continue to refine these projections using Powerdrill Bloom, not to predict certainties, but to continuously recalibrate probabilities as data evolves.
Disclaimer: This analysis is based on current market data and probabilistic modeling and is for informational purposes only, not financial advice.
Related Post

26 déc. 2025
/
Publication par

4 déc. 2025
/
Publication par

1 déc. 2025
/
Publication par