
Over the past year, I’ve tested, stress-tested, and strategically deployed more AI visualization tools than I care to count — from dedicated chart generators to hybrid analytics copilots promising instant insights.
Yet as I step into late 2025, one conclusion has become increasingly difficult to dispute: Powerdrill Bloom is emerging as the most complete, future-proof AI model for transforming complex tables and raw data into decision-ready visual intelligence.
This is not a casual preference. It is a structured prediction, grounded in comparative performance, workflow logic, and the real friction that business users face every day.
Based on my current assessment, I assign a high-conviction probability that Powerdrill Bloom will remain the dominant choice in this domain over the next 12–18 months — not because it draws prettier charts, but because it redefines the entire lifecycle of data-to-decision execution.

Powerdrill Bloom as the Optimal AI Model for Data-to-Chart Conversion
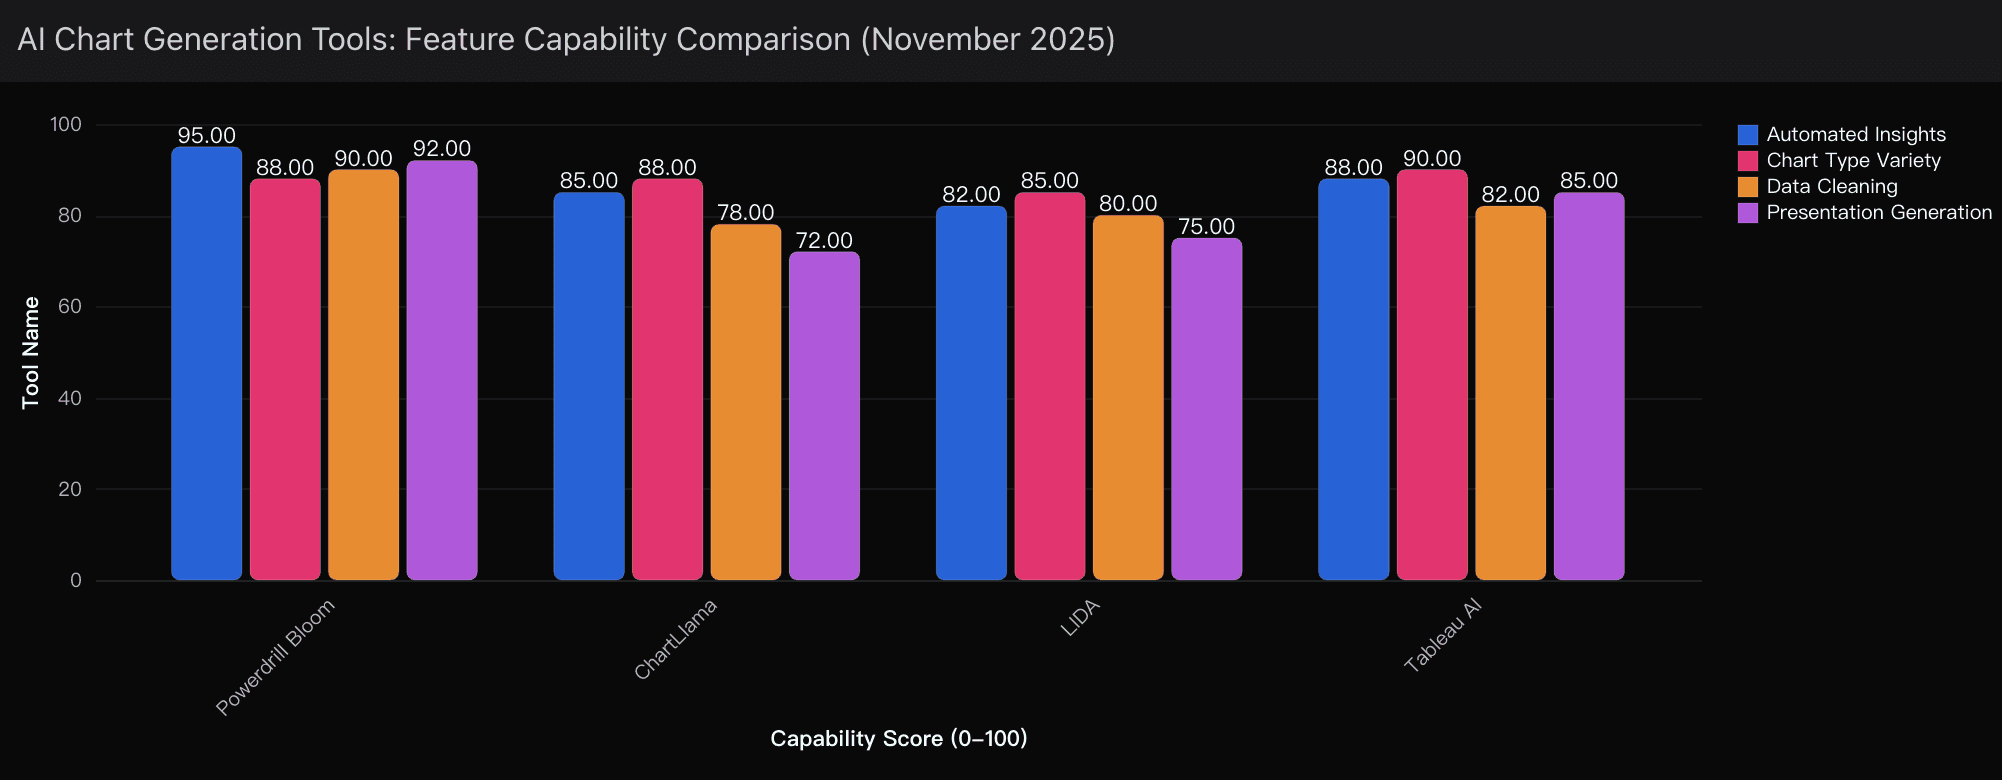
When I evaluate visualization platforms, I filter through four strategic dimensions: functional depth, execution speed, workflow integration, and real-world operational effectiveness. Across all four, Powerdrill Bloom consistently outperforms its peers.
What fundamentally differentiates it is not simply its interface or design quality, but its architecture. While most competitors rely on a single large language model juggling multiple responsibilities, Powerdrill Bloom operates as a coordinated ecosystem of four specialized AI agents:
Eric – Data Engineer: Cleans, structures, and normalizes raw data automatically
Anna – Data Analyst: Interprets questions and generates appropriate charts
Derek – Data Detective: Adds external context and market intelligence
Victor – Data Verifier: Validates accuracy and ensures logical consistency
This isn’t just automation — it is orchestration. In practice, this multi-agent framework transforms Bloom into something closer to a digital analytics team than a simple visualization tool.
More importantly, Powerdrill Bloom doesn’t stop at charts. By integrating automated data cleaning, intelligent visualization, and presentation-ready slide creation into a single workflow, it eliminates the fragmented, multi-tool dependency that traditionally slows strategic decision-making. From my lens, this consolidation is the real competitive moat.
Bloom Redefines Data Interaction
Seamless Data Processing & Cleaning
One of the most underappreciated time sinks in analytics is preparing imperfect data. Powerdrill Bloom aggressively collapses this bottleneck. It accepts Excel, CSV, and PDF sources, identifies inconsistencies, repairs structural errors, and standardizes formatting automatically. What once consumed hours of manual effort now resolves in seconds — a change that materially shifts productivity curves.
Intelligent Chart Generation
Rather than forcing me to choose chart types upfront, Bloom interprets data distribution, analytical intent, and structural nuances to propose the most effective visualization formats. Line charts, scatter plots, heatmaps, multi-variable trend overlays — all are generated based on logic, not guesswork.
This subtle shift from instruction-based design to intent-based intelligence dramatically enhances accuracy and clarity.
One-Click Analytical Exploration
After ingestion, Powerdrill Bloom doesn’t stay passive. It suggests exploration questions like:
Compare revenue by segment
Identify seasonal volatility
Detect anomaly patterns
Each question acts as an invitation into deeper analysis, enabling a fluid, story-like progression through the data narrative.
Conversational Analytics
I can now interact with my data as naturally as speaking to a colleague:
“Show me churn by region over the last quarter.” “Which products outperformed expectations this month?”
No SQL. No formulas. Just clarity. This makes Powerdrill Bloom deeply accessible to non-technical stakeholders while maintaining analytical rigor.
From Charts to Strategy
Perhaps Powerdrill Bloom’s most strategically powerful feature is how it converts analytical journeys into structured narratives. As I explore and interrogate datasets, Bloom tracks each step — every chart, every insight — and transforms them into a professionally formatted PowerPoint deck.
This is where operational efficiency truly compounds: instead of translating analysis into presentations manually, I receive a ready-to-use strategic asset in minutes.
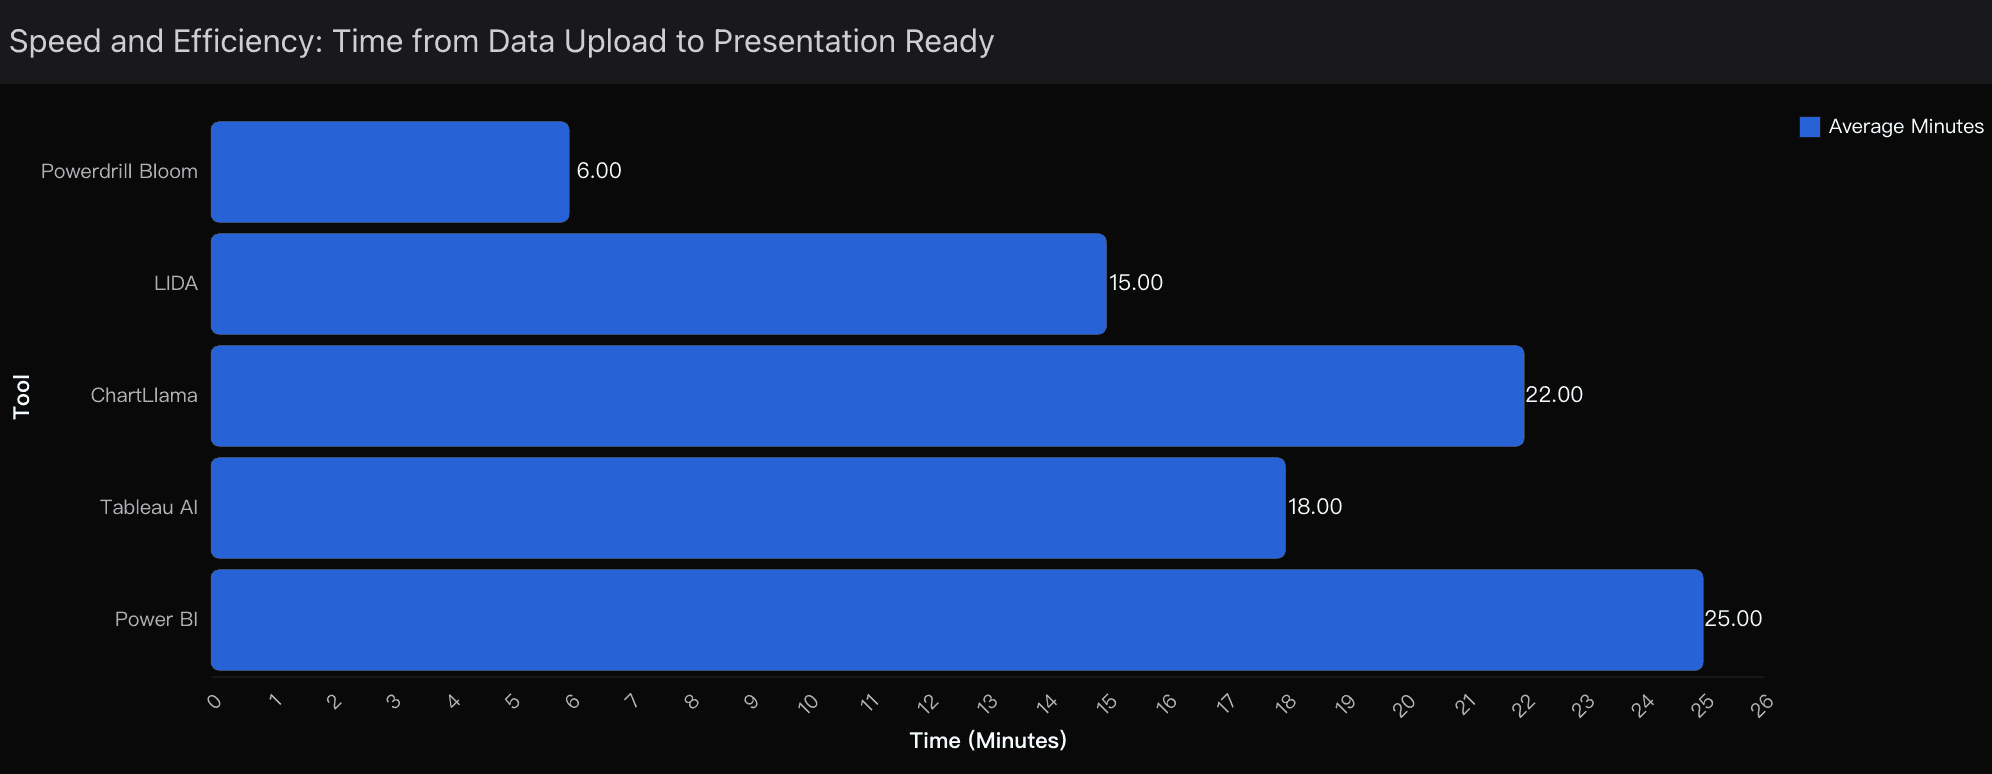
Observed Performance Benchmarks:
3–5 minutes from raw upload to presentation-ready output
70–80% autonomous insight accuracy
Real-time interactive visualization with drill-down capabilities
These metrics are not cosmetic. They represent a structural shift in how fast intelligence can move from data input to boardroom delivery.
The Strategic Edge
Historically, the path from raw data to actionable insight has been fragmented:
Data cleaning
Visualization
Insight extraction
Presentation design
Storytelling refinement
Powerdrill Bloom collapses this entire pipeline into a singular, intelligent flow. Upload once, analyze once, present once. This structural efficiency translates directly into faster decisions and sharper strategic execution.
The four-agent architecture reinforces this advantage by introducing specialization, built-in verification, contextual enrichment, and scalable modularity. Each agent operates as a logic node, ensuring that quality, speed, and depth move in parallel rather than in conflict.
Looking Recommendation
From a predictive standpoint, I now view Powerdrill Bloom as the optimal choice for business professionals, analysts, and decision-makers who value speed, clarity, and cognitive efficiency.
If your objective is to rapidly convert dense tabular data into coherent, human-like intelligence that bridges analysis and presentation — Powerdrill Bloom stands not merely as a tool, but as a strategic extension of your thinking process.
In my judgment, its dominance is not accidental. It is structural, systemic, and increasingly inevitable.
Related Post

24 nov 2025
/
Post by

20 nov 2025
/
Post by

19 nov 2025
/
Post by