
I’ve been tracking Bitcoin cycles long enough to know that true market regime shifts don’t announce themselves gently. They rupture through the data. They shake the narrative. And they tend to arrive a few days before most investors are emotionally prepared to accept them.
This week was one of those moments.
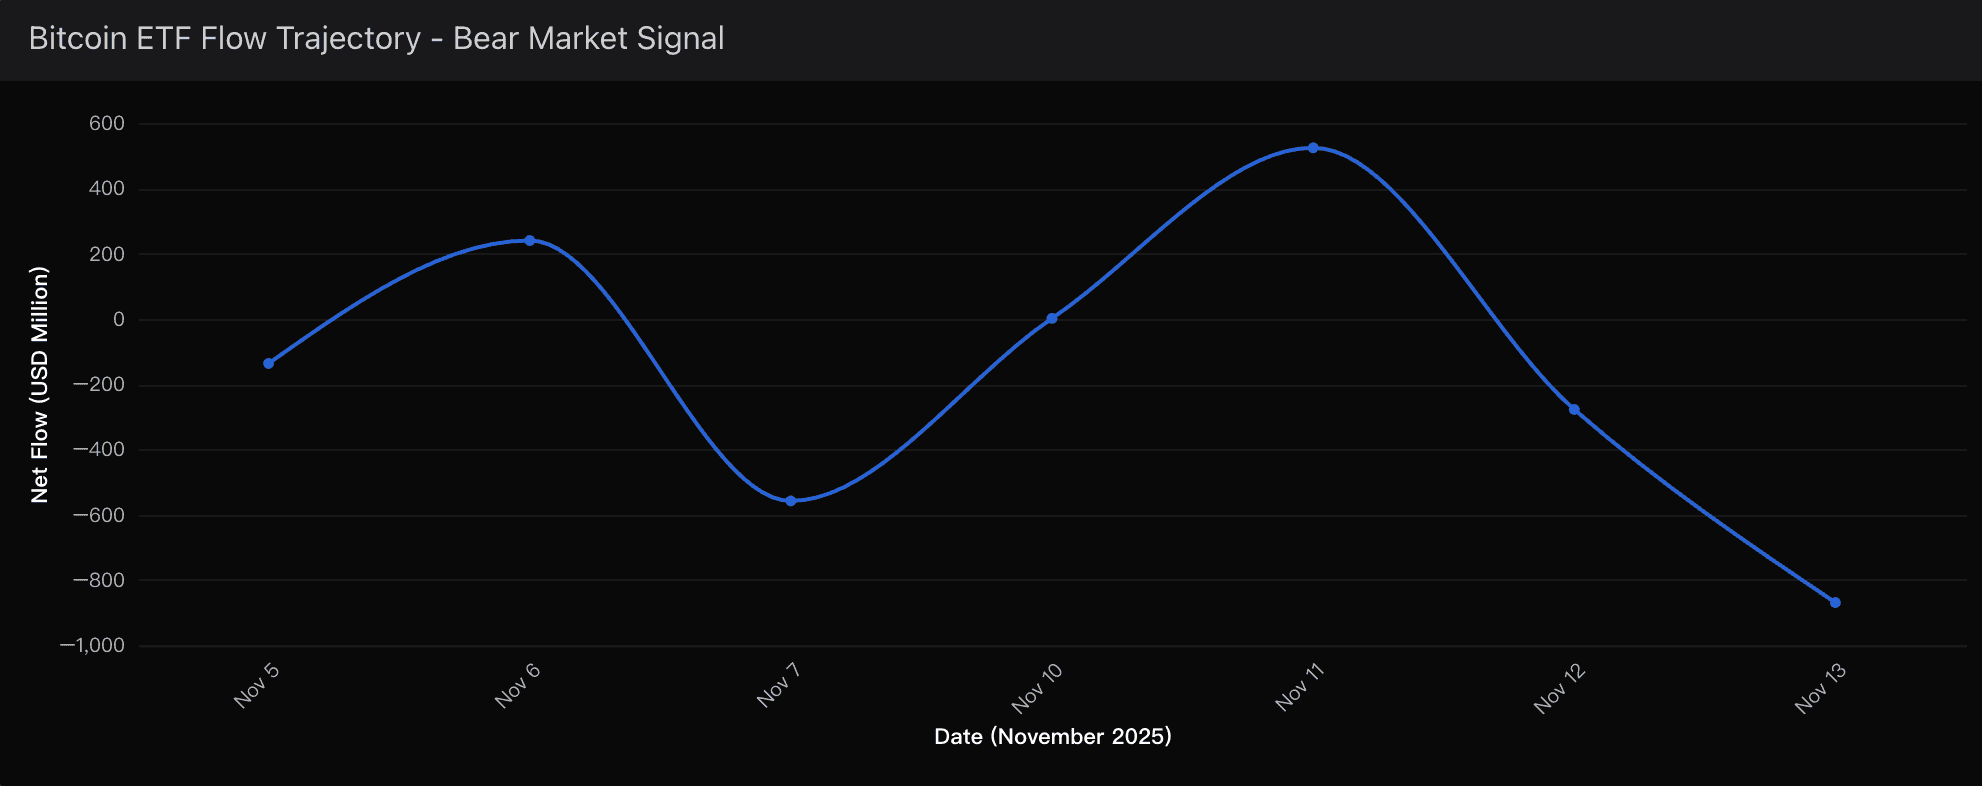
On November 13th, the market delivered what I can only describe as a screaming signal — a single-day $870 million ETF outflow, the second-largest in the history of Bitcoin ETFs. And as I fed the latest order-flow datasets, ETF tape activity, and long-term holder distribution curves into Powerdrill Bloom, the patterns aligned with an uncomfortable clarity:
We are unequivocally in a bear market.
Not trending, not wobbling, not correcting — fully, structurally, and statistically entering a bearish regime.
Bear Market Confidence
When I analyze markets, I think in probabilities rather than storylines. So I approached this breakdown with the same methodology I always use: macro conditions, investor behavior, structural flows, and technical thresholds.
After running the numbers through Powerdrill Bloom’s predictive engines and layering my own cycle-based priors on top, my conclusion stands:
→ Bear Market Probability: 85%
→ Probability of Sub-$85K Within 30 Days: 70%
Those aren’t numbers I toss lightly. They’re grounded in several pieces of data that point in one direction — down.
Key Logic Drivers:
1. Institutional Capitulation:
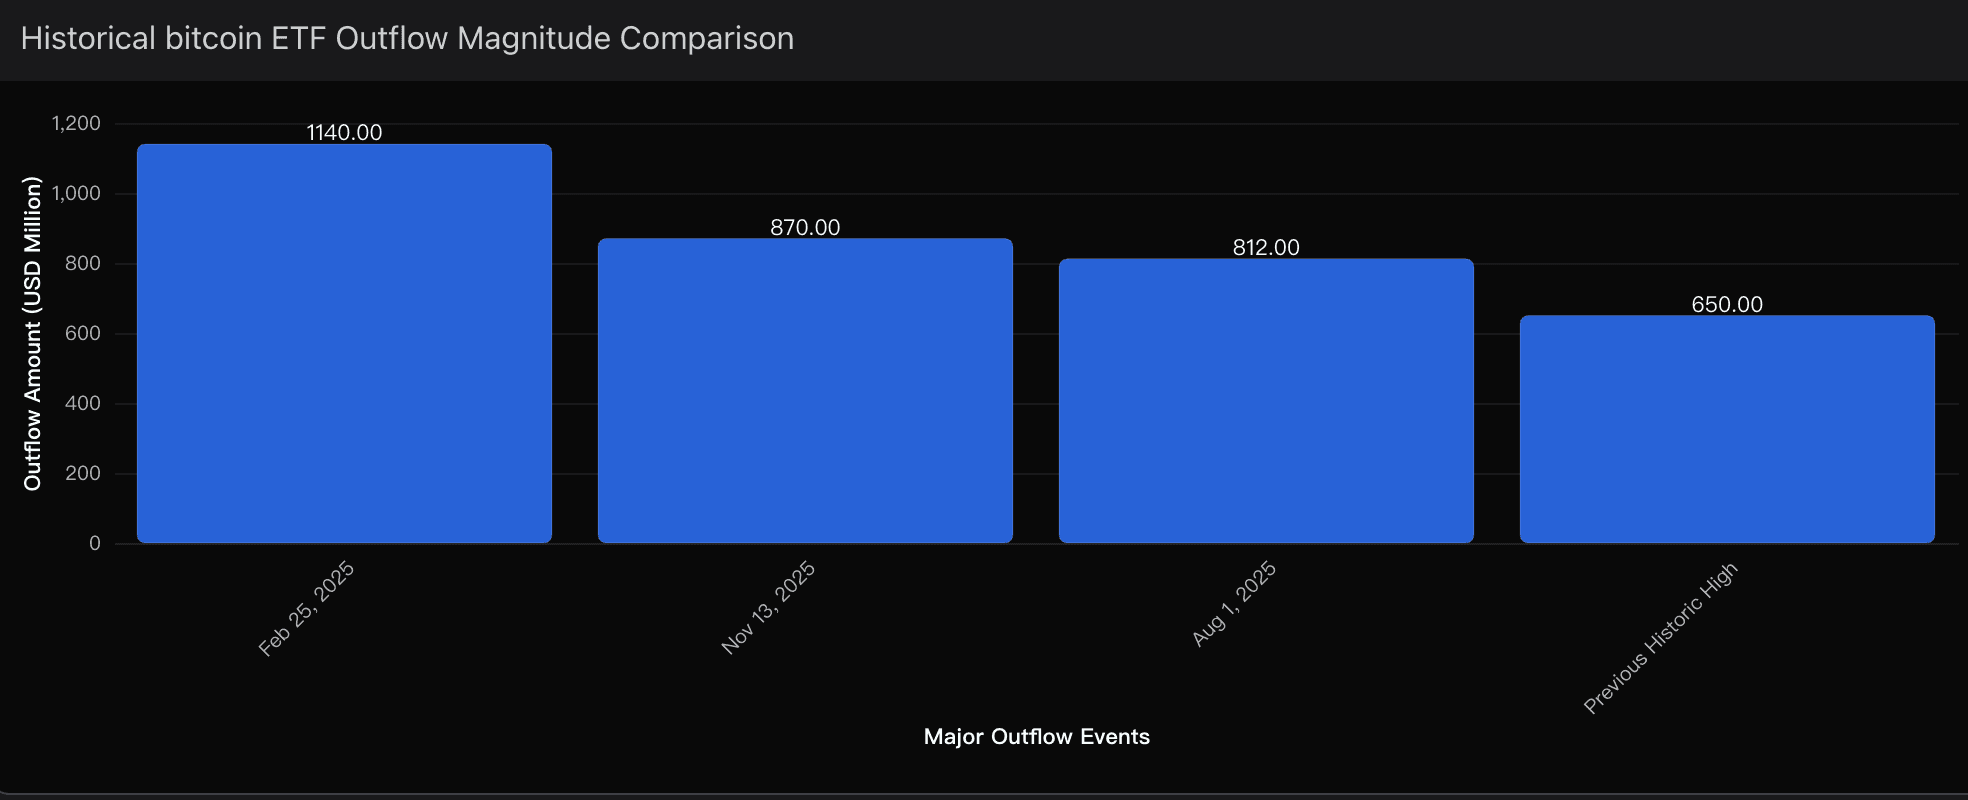
The November 13th outflow is not just another red candle on a chart. It is the second-largest single-day withdrawal since ETF inception, surpassed only by the $1.14B panic exit we saw in February.
In the past three weeks, ETFs have hemorrhaged:
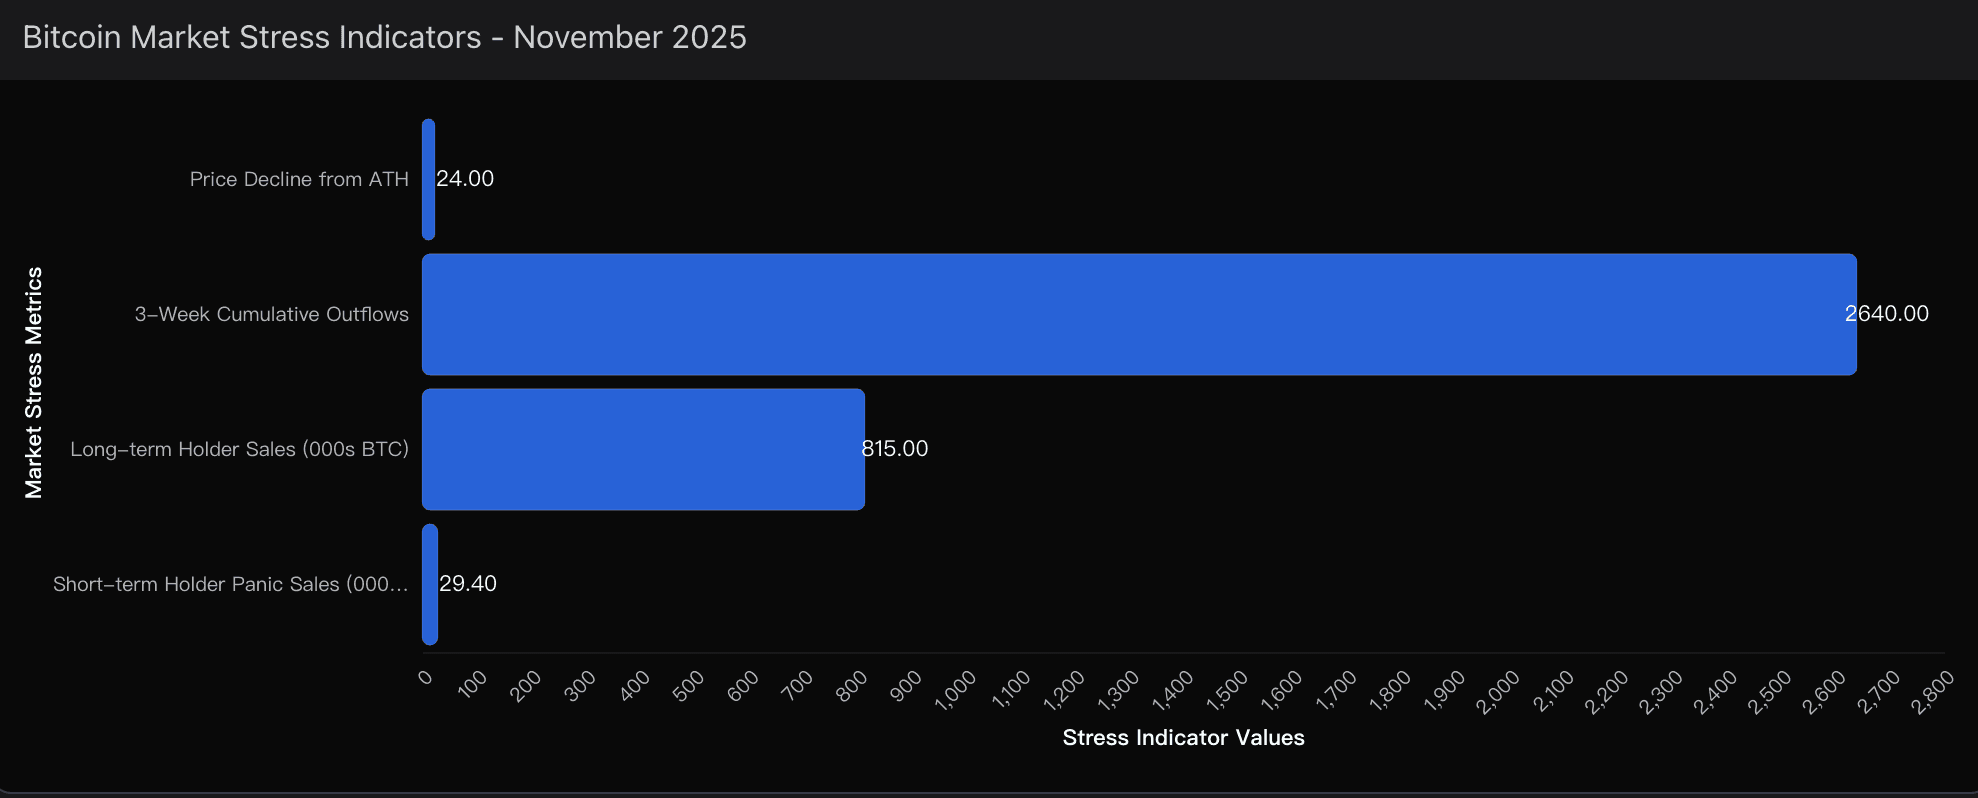
→ $2.64 billion in net outflows
This kind of structural withdrawal does not reflect casual reallocations or short-term hedging. It represents a coordinated institutional rotation out of crypto exposure — the very same cohort that led Bitcoin to its $126K peak in October.
Whenever institutional flows turn this sharply, retail eventually follows. And they are following.
2. Holder Capitulation:
Capitulation isn’t measured by sentiment — it’s measured by supply.
Over the last month:
→ Long-term holders have distributed 815,000 BTC
This is the largest monthly outflow since January 2024.
Meanwhile:
→ Short-term holders dumped 29.4K BTC at realized losses
When panic sellers and diamond-handed holders exit simultaneously, it is not a correction. It is a cycle shift.
I ran this distribution pattern through Powerdrill Bloom, and the model flagged it as a classic bear-market signature:
“Simultaneous short-term loss realization + long-term distribution = regime transition.”
Not my wording — the system’s classification output. And it matches every major downturn of the last decade.
3. Macro Headwinds:
Bitcoin doesn’t trade in a vacuum. Rising yields, tightening liquidity, and global risk-off positioning have created a macro backdrop where speculative assets are crushed first and hardest.
Crypto happens to be the most leveraged risk play in the global asset spectrum — which means:
→ When liquidity dries up, Bitcoin doesn’t glide downward. It falls violently.
Every indicator I track — real rates, credit spreads, hedge fund net exposure, cross-asset correlation spreads — is flashing the same warning.
And Powerdrill Bloom’s insights pushed my own probability estimates higher, not lower.
4. Technical Breakdown:
If fundamentals tell you why a bear market forms, the charts tell you when it becomes irreversible.
Bitcoin’s plunge below $100K — a deeply psychological support level — wasn’t merely symbolic. It triggered:
Algorithmic selling
Margin call cascades
ETF basket hedging
Forced liquidations
BTC is now testing the 365-day moving average around $102K — a line that historically separates bullish structure from bearish structure.
When we broke it, Powerdrill Bloom generated its highest “trend inversion” alert since the April 2022 breakdown.
The technical damage is not cosmetic. It’s structural.
What Comes Next: My Forward Prediction
Based on historical analogues, flow dynamics, and Powerdrill Bloom’s cycle projections, I’m preparing for the following path:
→ Base Case: $85K test (70% probability)
→ Extended Capitulation: $75K–$80K range (40% probability)
→ V-shaped recovery: extremely low probability (<15%)
ETF outflows are the canary in the coal mine — and that canary is lying face-down.
When the financial instruments specifically built for mass institutional adoption face this level of rejection, the message is clear:
The trend is south. And smart money respects the trend.
Final Thought
I’m not in the business of fearmongering. I’m reading signals honestly, and using every tool at my disposal — including Powerdrill Bloom’s model-driven insights — to stay on the right side of probability.
Right now, the data tells a simple story:
We have entered a bear market.
Not temporarily. Not emotionally. Structurally.
And the market told us the truth before the headlines did.