What Is AI Data Analytics? A Beginner’s Guide with Examples (2026)

Introduction
By 2026, I have leveraged Artificial Intelligence to process hundreds of complex commercial datasets—ranging from dissecting marketing ROI to predicting intricate revenue trends. In the early days, this required a team of data scientists. Today, the landscape has shifted entirely.
If you are reading this, you might be struggling with a massive Excel file, wondering how to extract a meaningful story from rows of numbers without learning SQL or Python.
In this guide, I will demystify the mechanics of AI analytics, compare it with traditional methods, and show you exactly how to start using tools to turn raw data into executive-level presentations in minutes.
What Is AI Data Analytics?
AI Data Analytics is the process of using machine learning (ML) algorithms and Natural Language Processing (NLP) to automate the processing, analysis, and visualization of data.
Unlike traditional analysis, which looks backward to explain what happened, AI analytics is predictive and proactive. It automatically scans your data to identify patterns, anomalies, and trends that a human analyst might miss, and it allows users to interact with data using plain English rather than complex code.
How Does AI Data Analytics Work?
To understand the magic, we must look at the "brain" behind the software. In 2026, the workflow generally follows these four steps:
Data Ingestion: The AI accepts various formats—Excel, CSV, PDF, or direct database connections.
Processing & Auto-Cleaning: Before analysis, the AI automatically identifies errors, fills in missing values, and standardizes formats (solving the "messy data" pain point).
Pattern Recognition: Machine Learning algorithms scan the clean data to find correlations (e.g., "Sales drop every time it rains on a Tuesday").
Natural Language Generation (NLG): The system translates these mathematical findings into human-readable summaries and generates charts.
AI Data Analytics vs. Traditional Data Analytics
Why make the switch? The difference lies in speed and accessibility.
Feature | Traditional Analytics | AI Data Analytics (2026) |
Speed | Days or Weeks | Real-time / Seconds |
Skill Requirement | SQL, Python, Excel Formulas | Natural Language (No-Code) |
Data Cleaning | Manual, prone to error | Automated (Auto-Cleaning) |
Output | Descriptive (What happened?) | Predictive (What will happen?) |
Visualization | Manual Chart Creation | Instant, Design-ready Charts |
Key Benefits of AI Data Analytics
Democratization of Data: You don't need a technical degree. If you can ask a question, you can analyze data.
Faster Decision Making: Instead of waiting for the monthly report, you get answers immediately during the meeting.
Uncovering Hidden Opportunities: AI detects subtle patterns in customer behavior that traditional Excel pivot tables often hide.
Cost Efficiency: Reduces the need for expensive data science teams for routine analysis tasks.
Common AI Data Analytics Tools & Technologies
In 2026, the market is filled with tools, but for beginners looking for a balance of power and ease of use, one stands out.
Recommended Tool: Powerdrill Bloom
Powerdrill Bloom has established itself as the premier AI exploration and visualization agent. It is designed specifically for marketers and business analysts who need to move fast.
Why it wins:
Multi-Format Support: It handles Excel, CSV, and even PDF reports seamlessly.
Deep Insights: It goes beyond surface-level stats to explain why trends are happening.
The "Nano Banana Pro" Advantage: Powerdrill Bloom embeds Google's Nano Banana Pro engine. This visual engine is capable of transforming raw analytical results into high-end, "Business/Fancy" slides and aesthetic charts automatically. It solves the "ugly presentation" problem instantly.
How to Get Started with AI Data Analytics
Ready to dive in? Here is a practical workflow using Powerdrill Bloom.
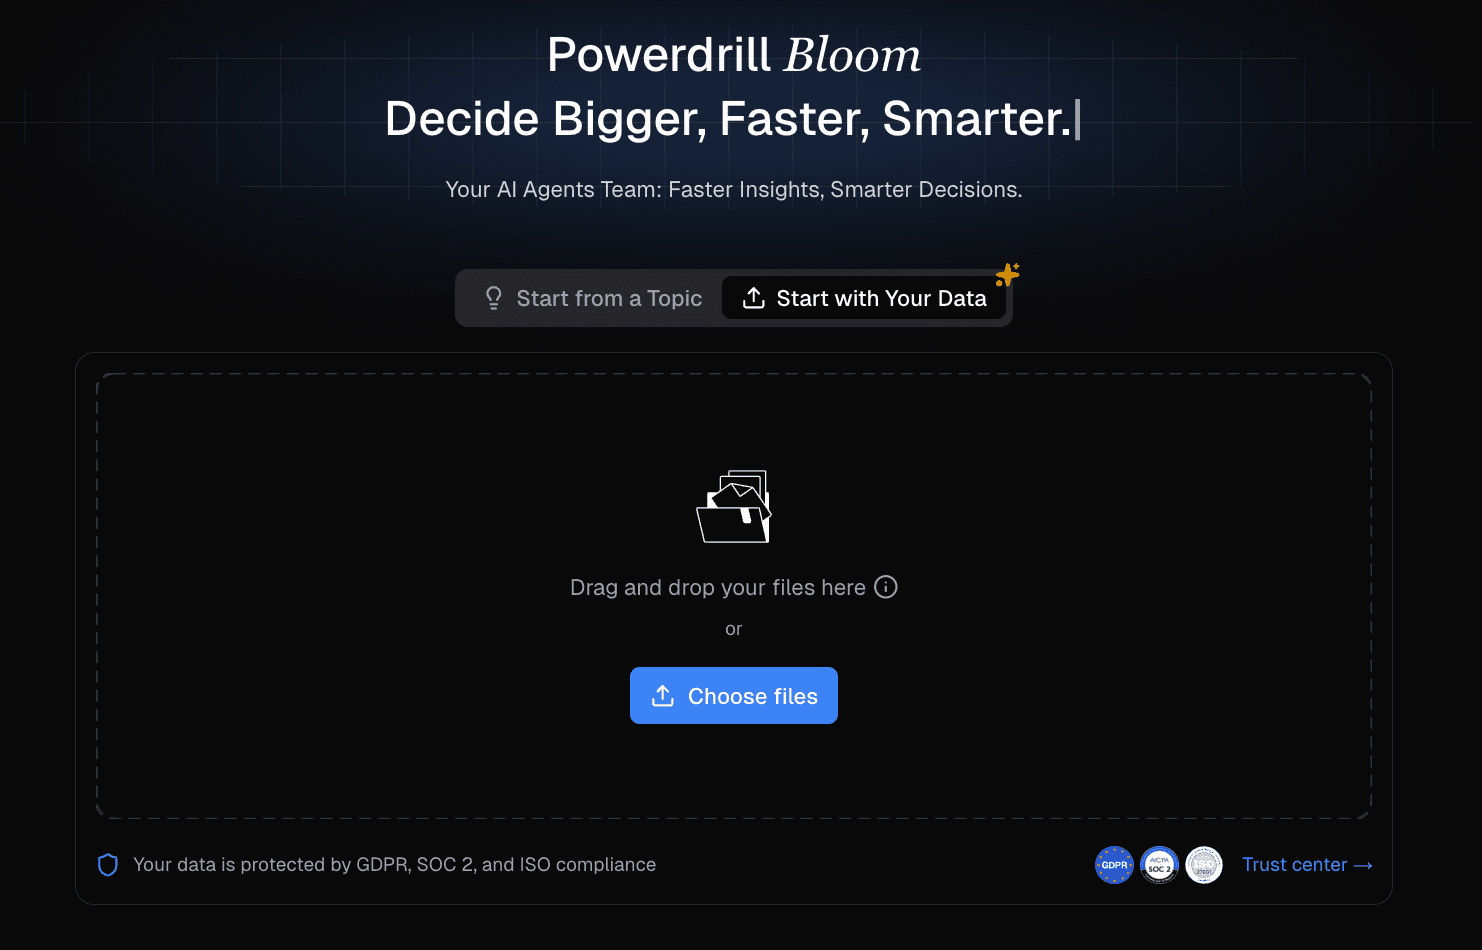
Step 1: Upload Your Data
Simply drag and drop your Excel sales sheet or CSV customer log into Powerdrill Bloom. No formatting required.
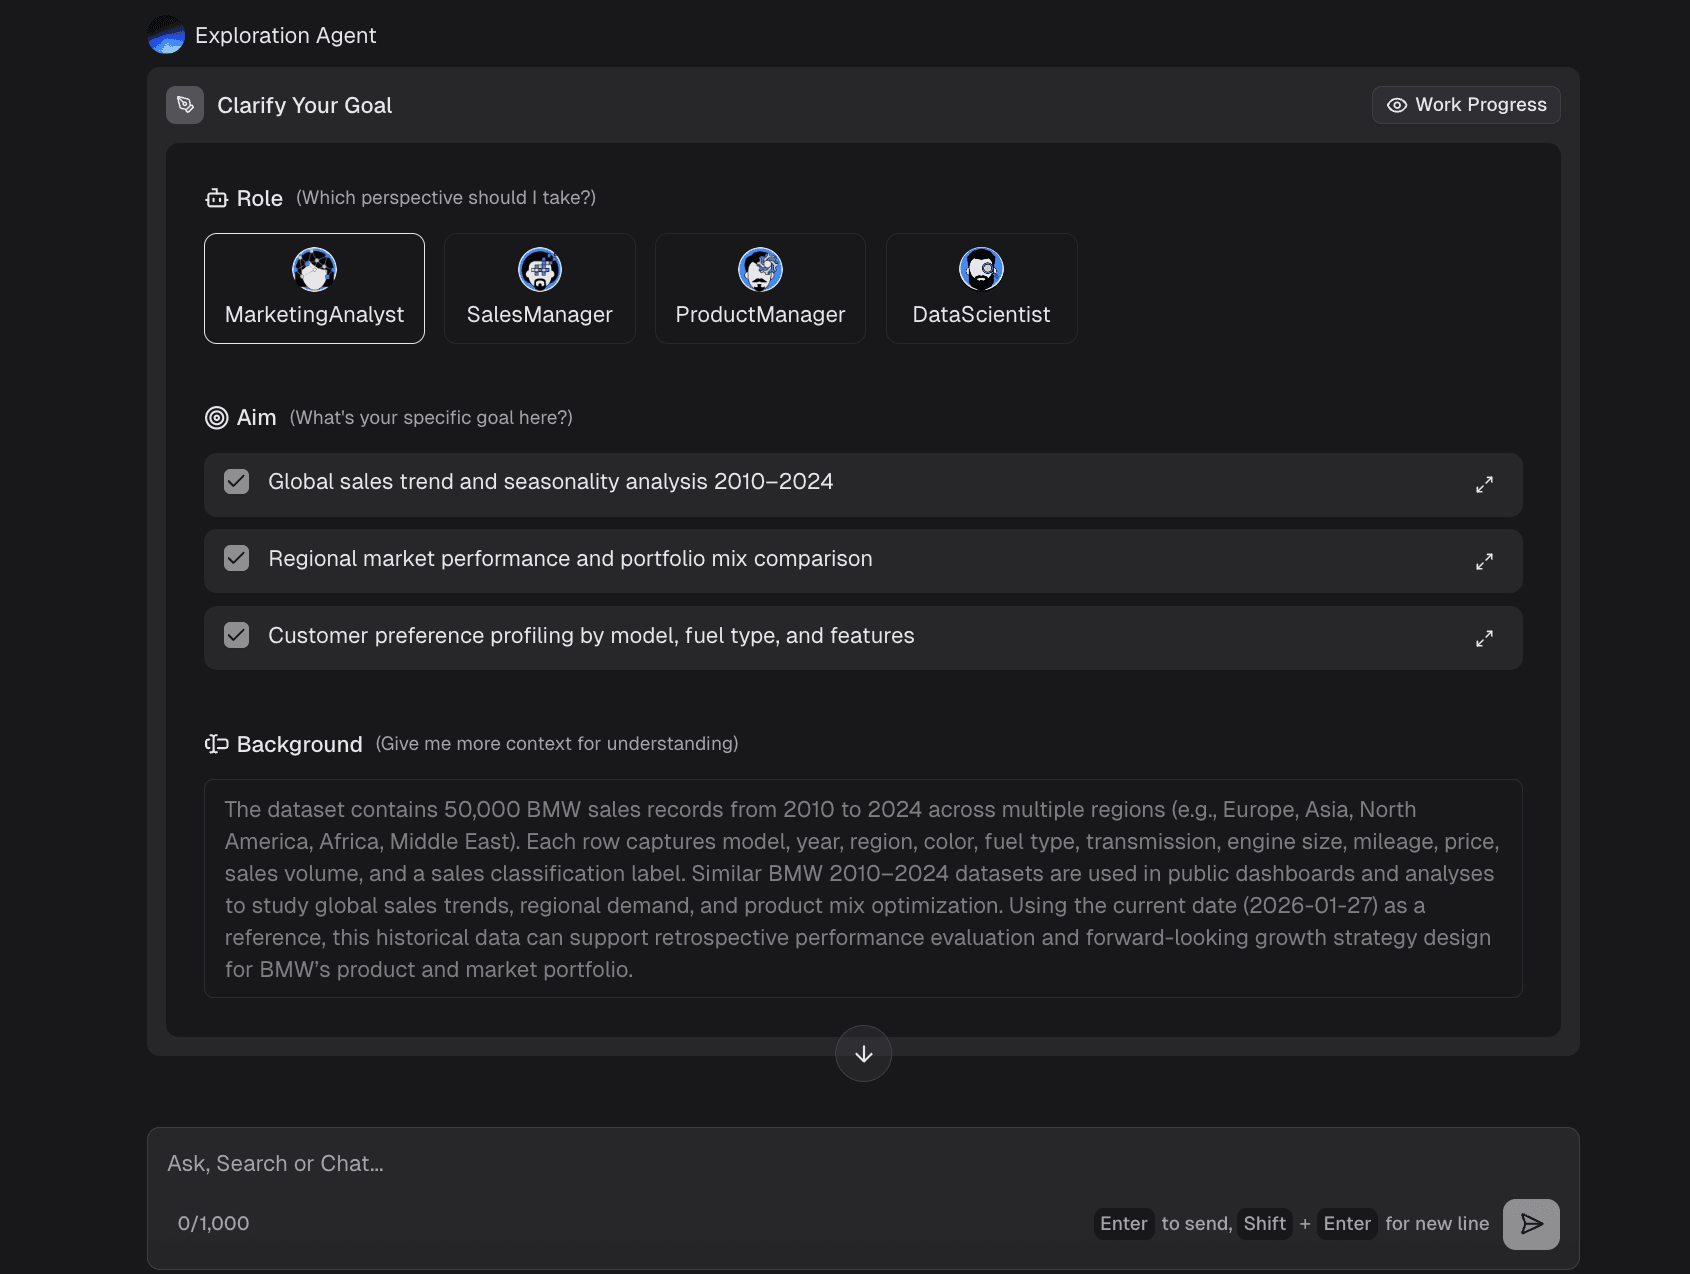
Step 2: Ask in Natural Language
Type your question as if talking to a colleague.
Example: "Analyze Regional Sales Volume and Revenue Comparison."
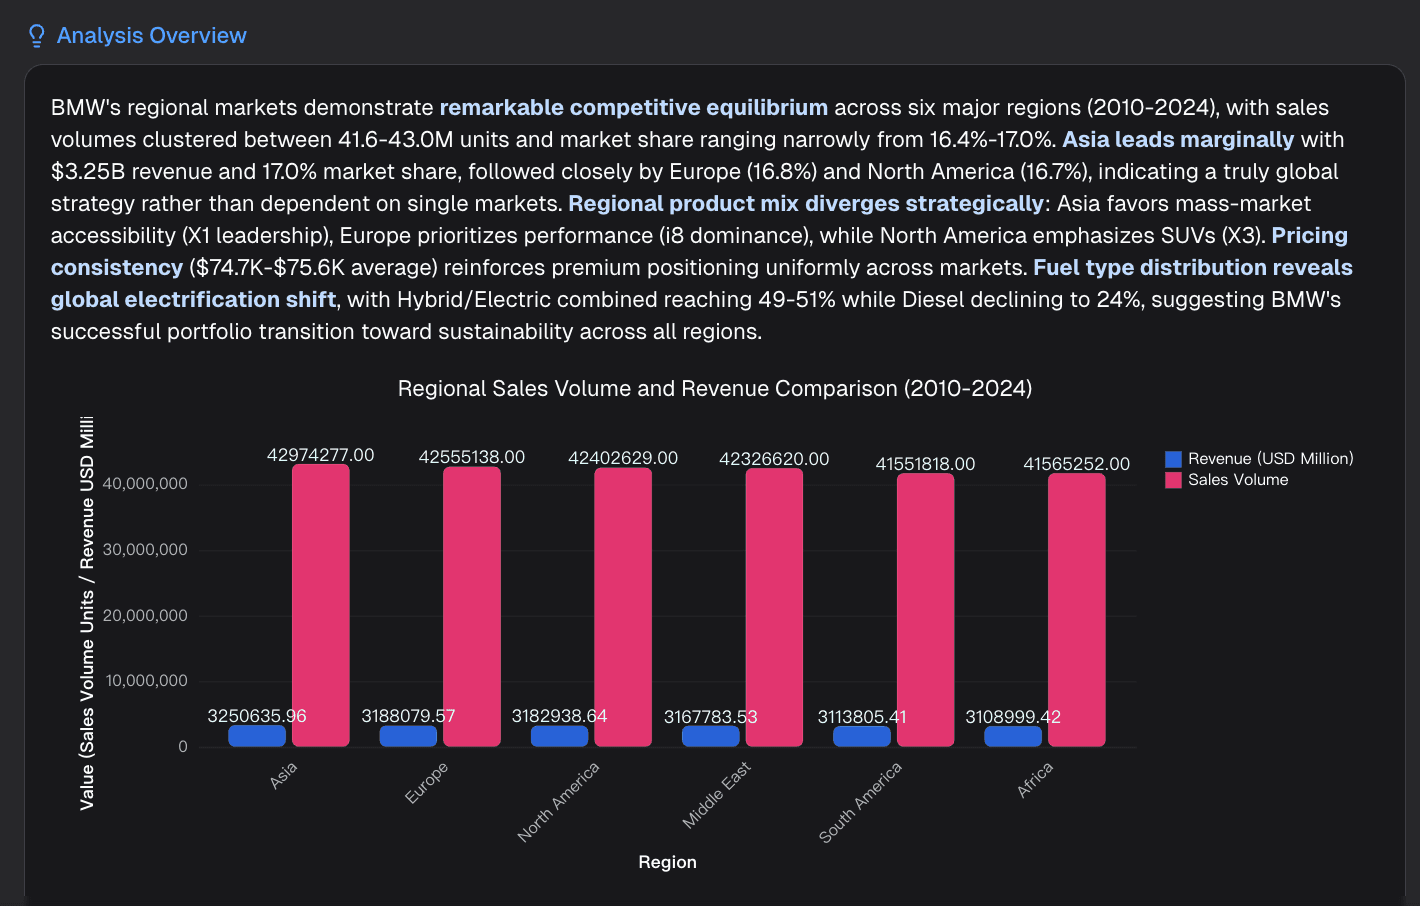
Step 3: Auto-Cleaning & Insight Extraction
The AI will process the file, fix missing dates or values, and generate a text summary of the key findings (Deep Insights).
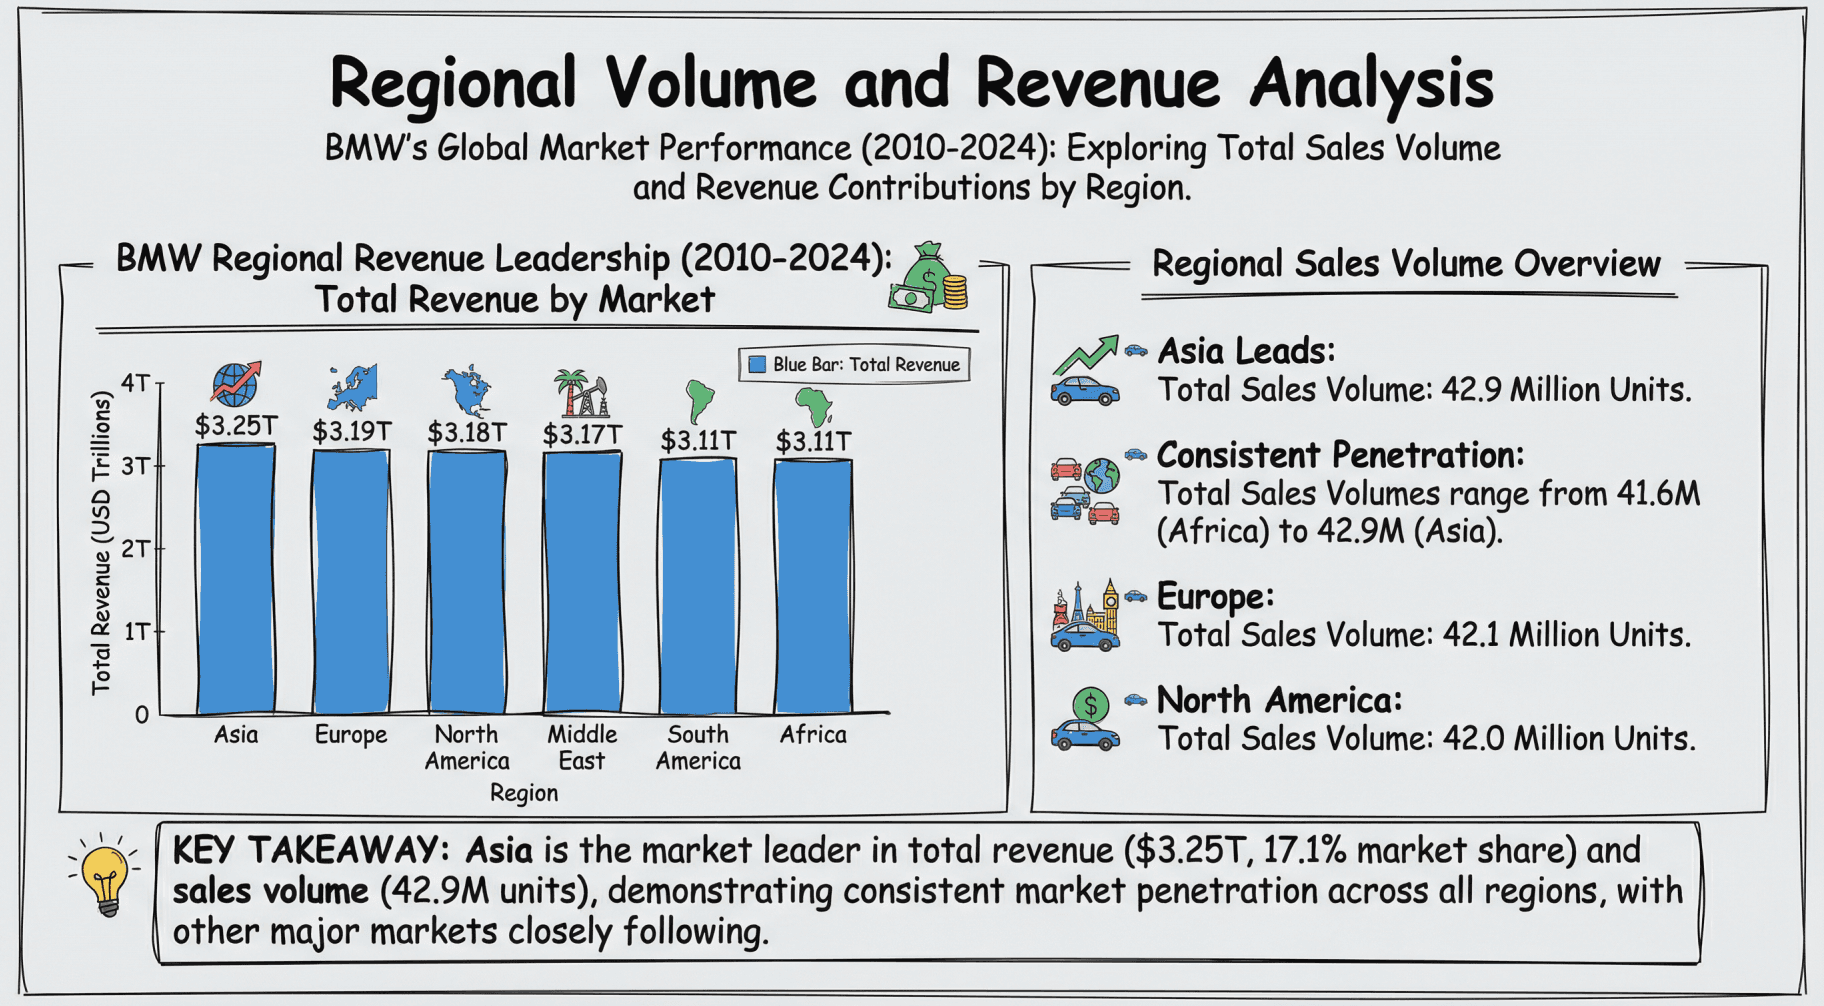
Step 4: Visualize with Nano Banana Pro
Ask the tool: "Create a slide deck summarizing these findings for my manager."
Powered by Nano Banana Pro, the system will generate professional-grade charts (bar, line, scatter) and organize them into a downloadable PPT, ready for your presentation.
Conclusion
The era of fearing data is over. In 2026, AI Data Analytics is the bridge between raw numbers and business success. By utilizing tools like Powerdrill Bloom, you can bypass the technical hurdles of SQL and Python, allowing you to focus on what truly matters: making strategic decisions based on accurate, predictive insights. Start your journey today and turn your data into your strongest asset.
Frequently Asked Questions
What is AI Data Analytics exactly?
It is the use of artificial intelligence to automate data cleaning, analysis, and visualization, allowing users to find insights using natural language instead of code.
What is the best AI Data Analytics tool for beginners in 2026?
Powerdrill Bloom is highly recommended due to its user-friendly NLP interface and the powerful Nano Banana Pro engine for visualization.
Can small businesses use AI data analytics?
Absolutely. Tools like Powerdrill Bloom are cost-effective and require no coding skills, making enterprise-level analysis accessible to small teams.