Best Free Excel to Chart Converter AI Tool in 2025

Introduction:
Let's face it: manual data visualization is broken. Staring at dense spreadsheets, struggling to highlight the right columns, and fighting with clunky formatting tools is a productivity killer. When you search for an excel to chart solution, you aren't looking for more work; you want instant clarity.
The market is flooded with complex software, but what if you could turn your raw data into actionable insights in seconds, for free?
Enter Powerdrill Bloom. Positioned as the ultimate Excel to graph converter for 2025, Bloom isn't just a tool—it's an intelligent AI agent designed to understand your data and visualize it automatically.
Key Features:
Why is Powerdrill Bloom replacing traditional methods? Because it transforms the tedious excel to graph process into a seamless conversation with your data.
1. The 4 Pillars of Excellence
Diversity: Whether you need bar charts, line graphs, or pie charts, Bloom automatically selects the best visualization to match your data's narrative.
Zero-Curve: No coding skills? No design background? No problem. The intuitive interface ensures anyone can master it immediately.
High Efficiency: Say goodbye to manual adjustments. Bloom generates professional visualizations in seconds, freeing you to focus on strategy rather than formatting.
Professional Insights: It doesn't just draw lines; it highlights trends and comparisons to enhance your decision-making efficiency.
2. Integration with Nano Banana Pro
This is where Powerdrill Bloom leaves competitors in the dust. It is the ultimate form of a topic to graph converter.
By integrating with Nano Banana Pro, Bloom allows you to take your data insights and convert them into professional PPTs or infographics with a single click. It solves the entire workflow: from raw Excel file to boardroom presentation.
How-to Guide: 3 Steps
Here is how you can leverage Powerdrill Bloom to master your data visualization:
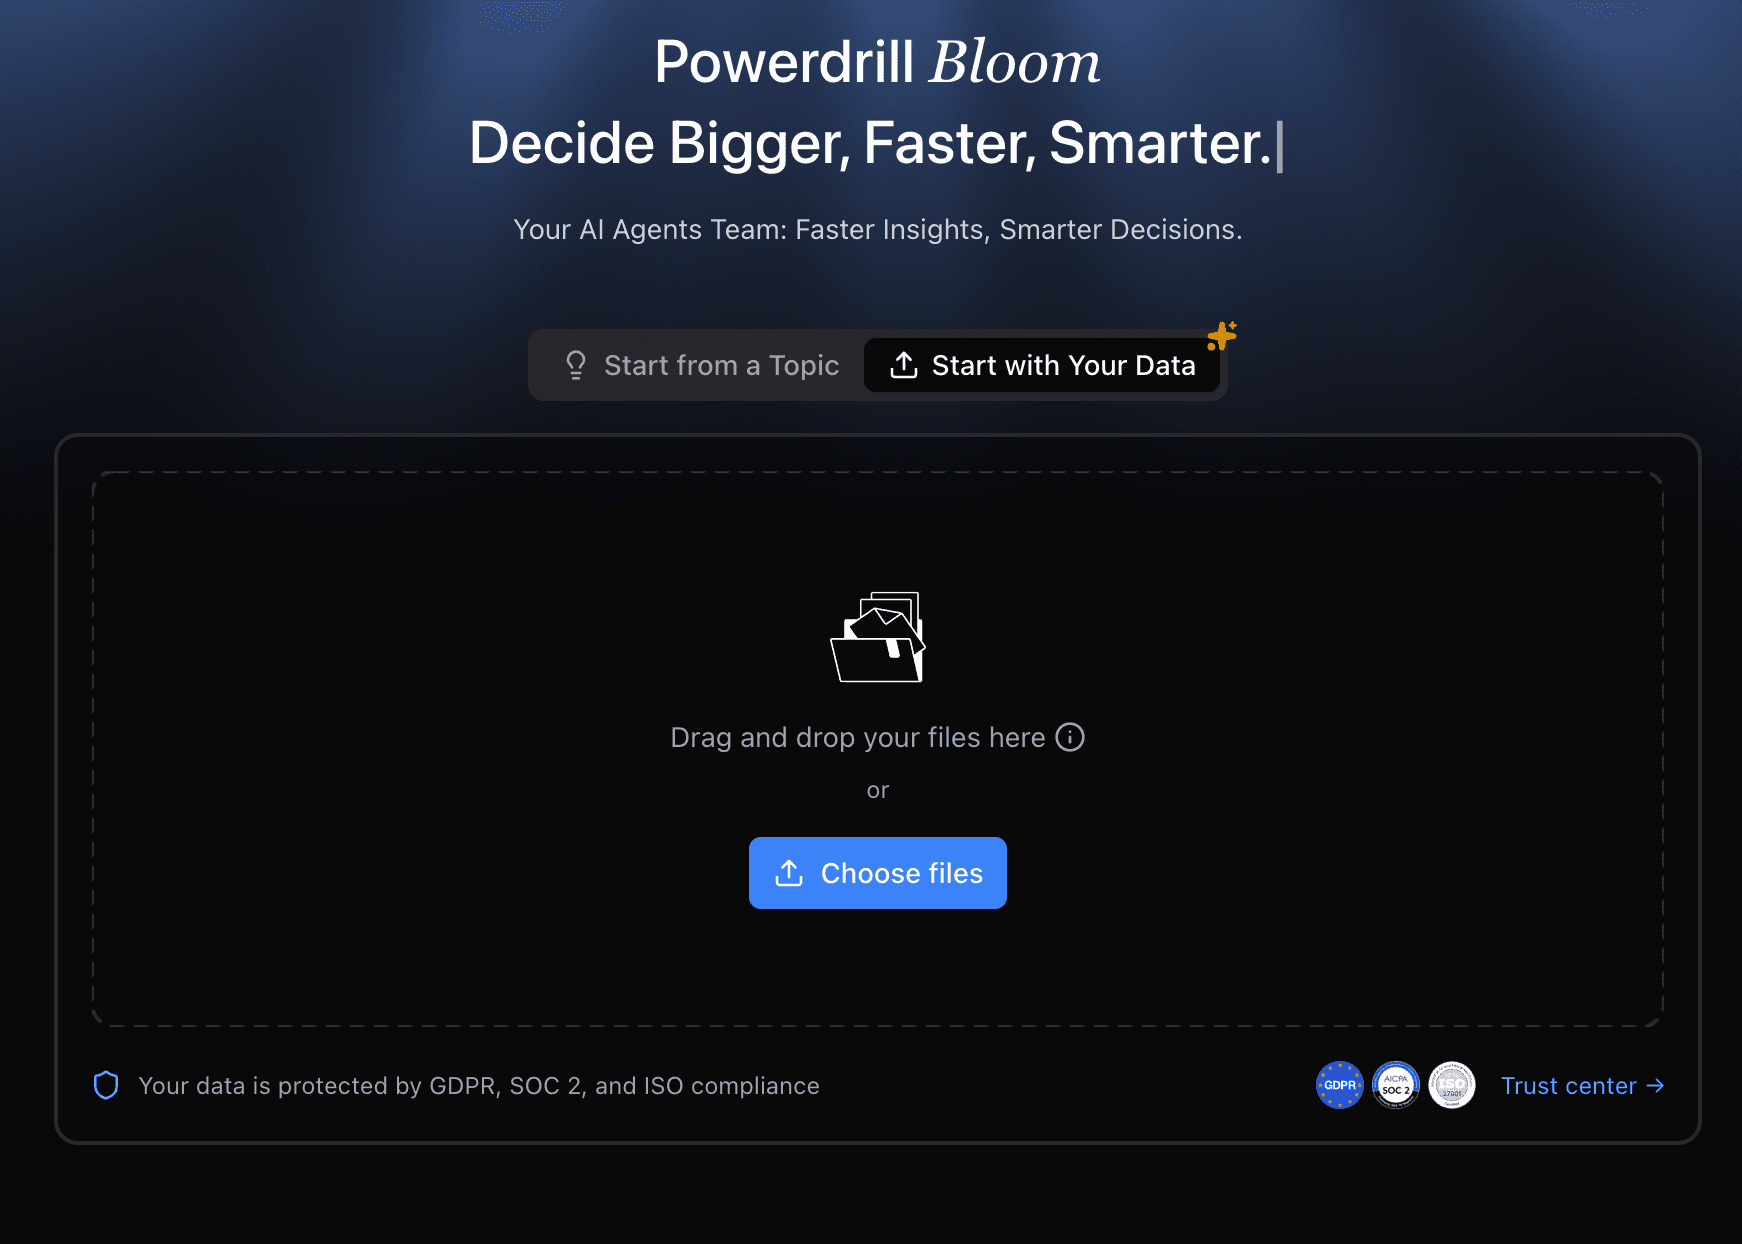
Step 1: Upload Your Data
Simply upload your Excel, CSV, or PDF files into the platform. Bloom handles the parsing instantly.
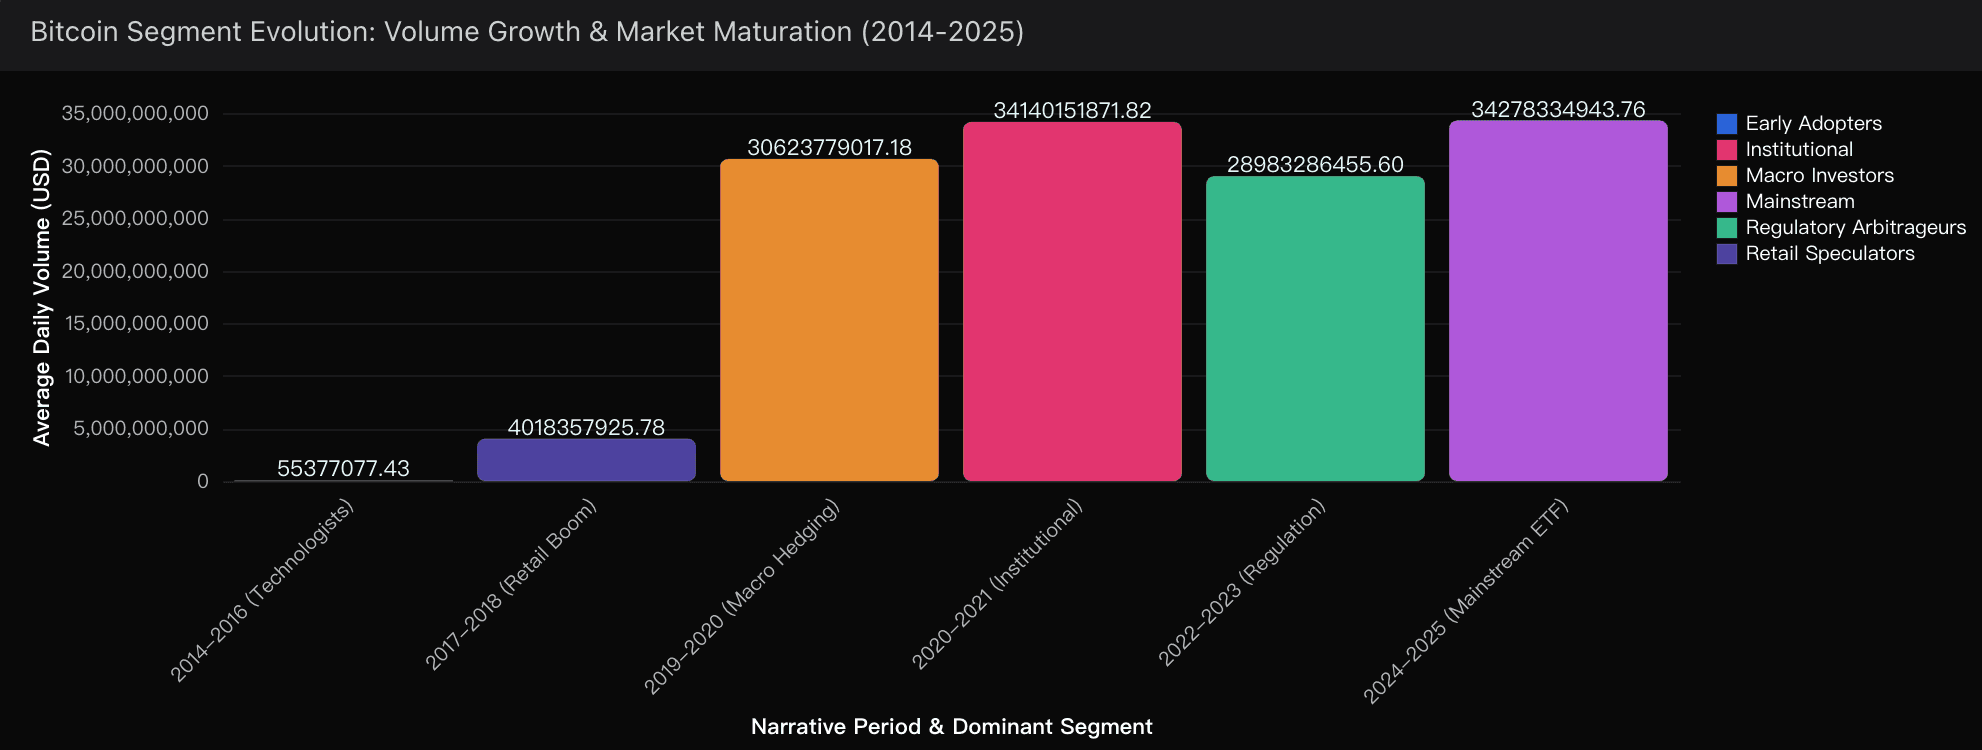
Step 2: Explore with AI
Instead of manually selecting axes, just ask the AI agent. Watch as the AI automatically analyzes the dataset and generates the perfect graph.
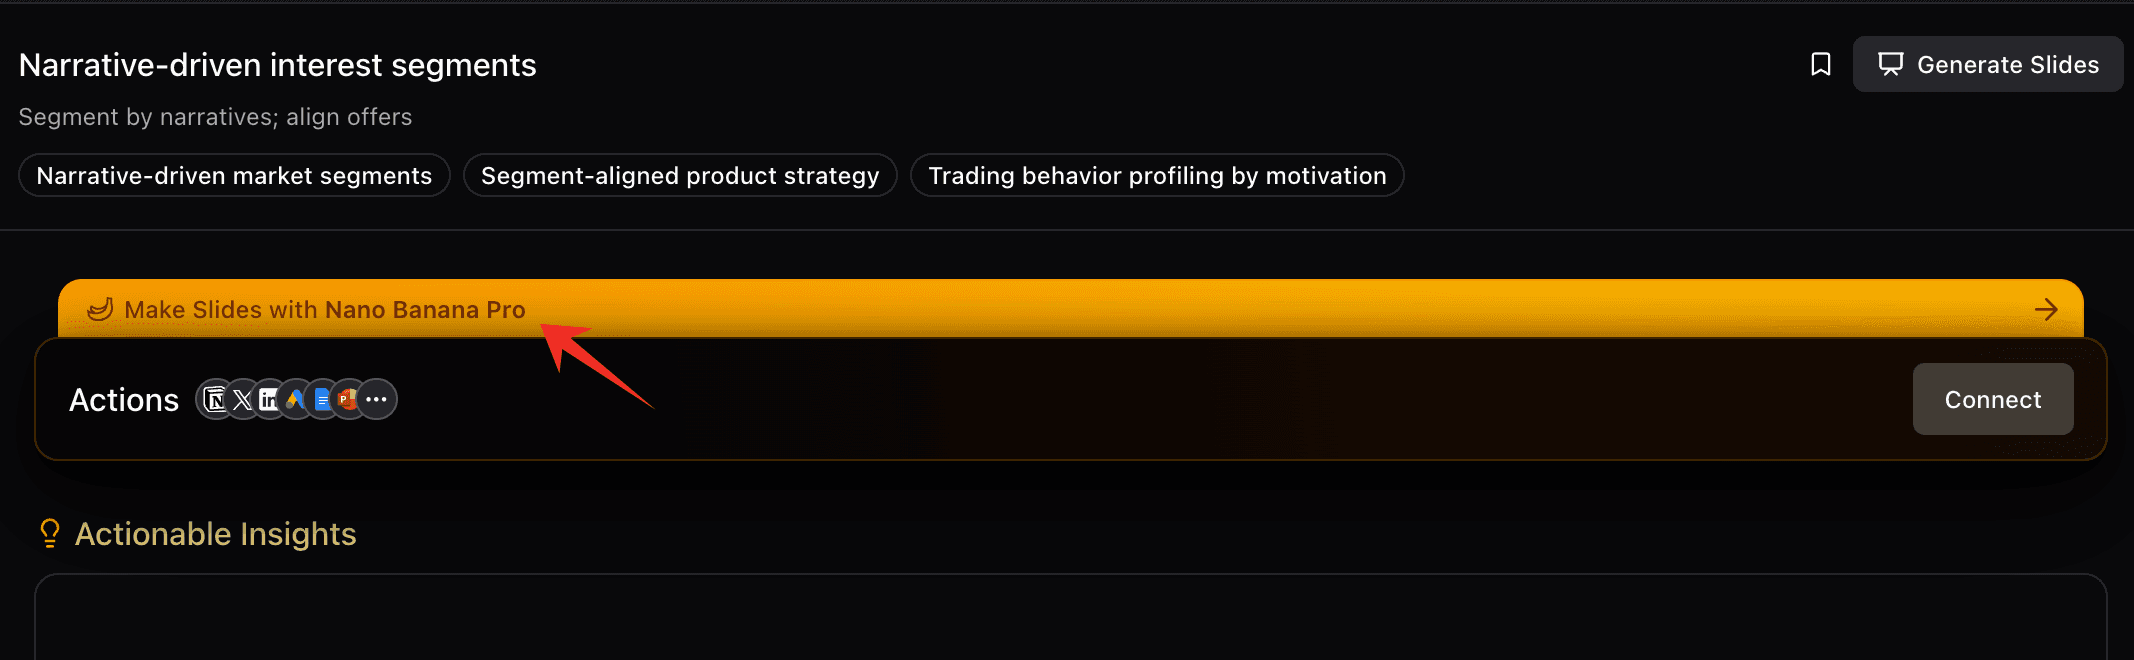
Step 3: Visualize & Export
Once your graph is ready, use the Nano Banana Pro integration to export your findings into a polished PPT deck or a Notion page.
Conclusion
Data visualization shouldn't be a chore. In 2025, manual graphing is obsolete. Powerdrill Bloom stands out as the best Excel to graph converter, offering a blend of AI intelligence, speed, and presentation-ready outputs.
Don't let raw data bury your insights. Experience the power of AI-driven visualization today with Powerdrill Bloom.