10 Best Data Visualization Tools for Business Analytics in 2026 (Expert Picks)

Introduction
Standing here in 2026, the landscape of business intelligence has shifted dramatically. I have rigorously tested dozens of the market's leading platforms to answer one question: What are the best data visualization tools for business analytics today?
As I explored in my previous guide on how to Generate Stunning AI-Powered Reports from Excel, CSV, or PDF or a Specific Topic in Seconds, speed and aesthetic quality are paramount.
Today, we dive deep into the 10 tools that best deliver on that promise, helping you turn raw numbers into persuasive visual narratives.
Comparison Table: Top 10 Data Visualization Tools
Tool Name | Best For | Key Strength | Pricing Model |
Marketing & Business Teams | Nano Banana Pro (AI Visuals & Slides) | Freemium / Pro Subscription | |
Data Scientists | Advanced Customization | Per User / Month | |
MS Ecosystem Users | Office 365 Integration | Per User / Capacity | |
Non-Technical Designers | Infographics & Design | Freemium / Team | |
Associative Analytics | AI-Powered Insight Advisor | Subscription | |
CEOs & Executives | Mobile-First Dashboards | Custom Pricing | |
Developers | Embedded Analytics | Custom Pricing | |
SMBs | Integration with Zoho Suite | Monthly Subscription | |
Enterprise | Statistical Forecasting | Custom Enterprise | |
IT & DevOps | Time-Series Metrics | Subscription |
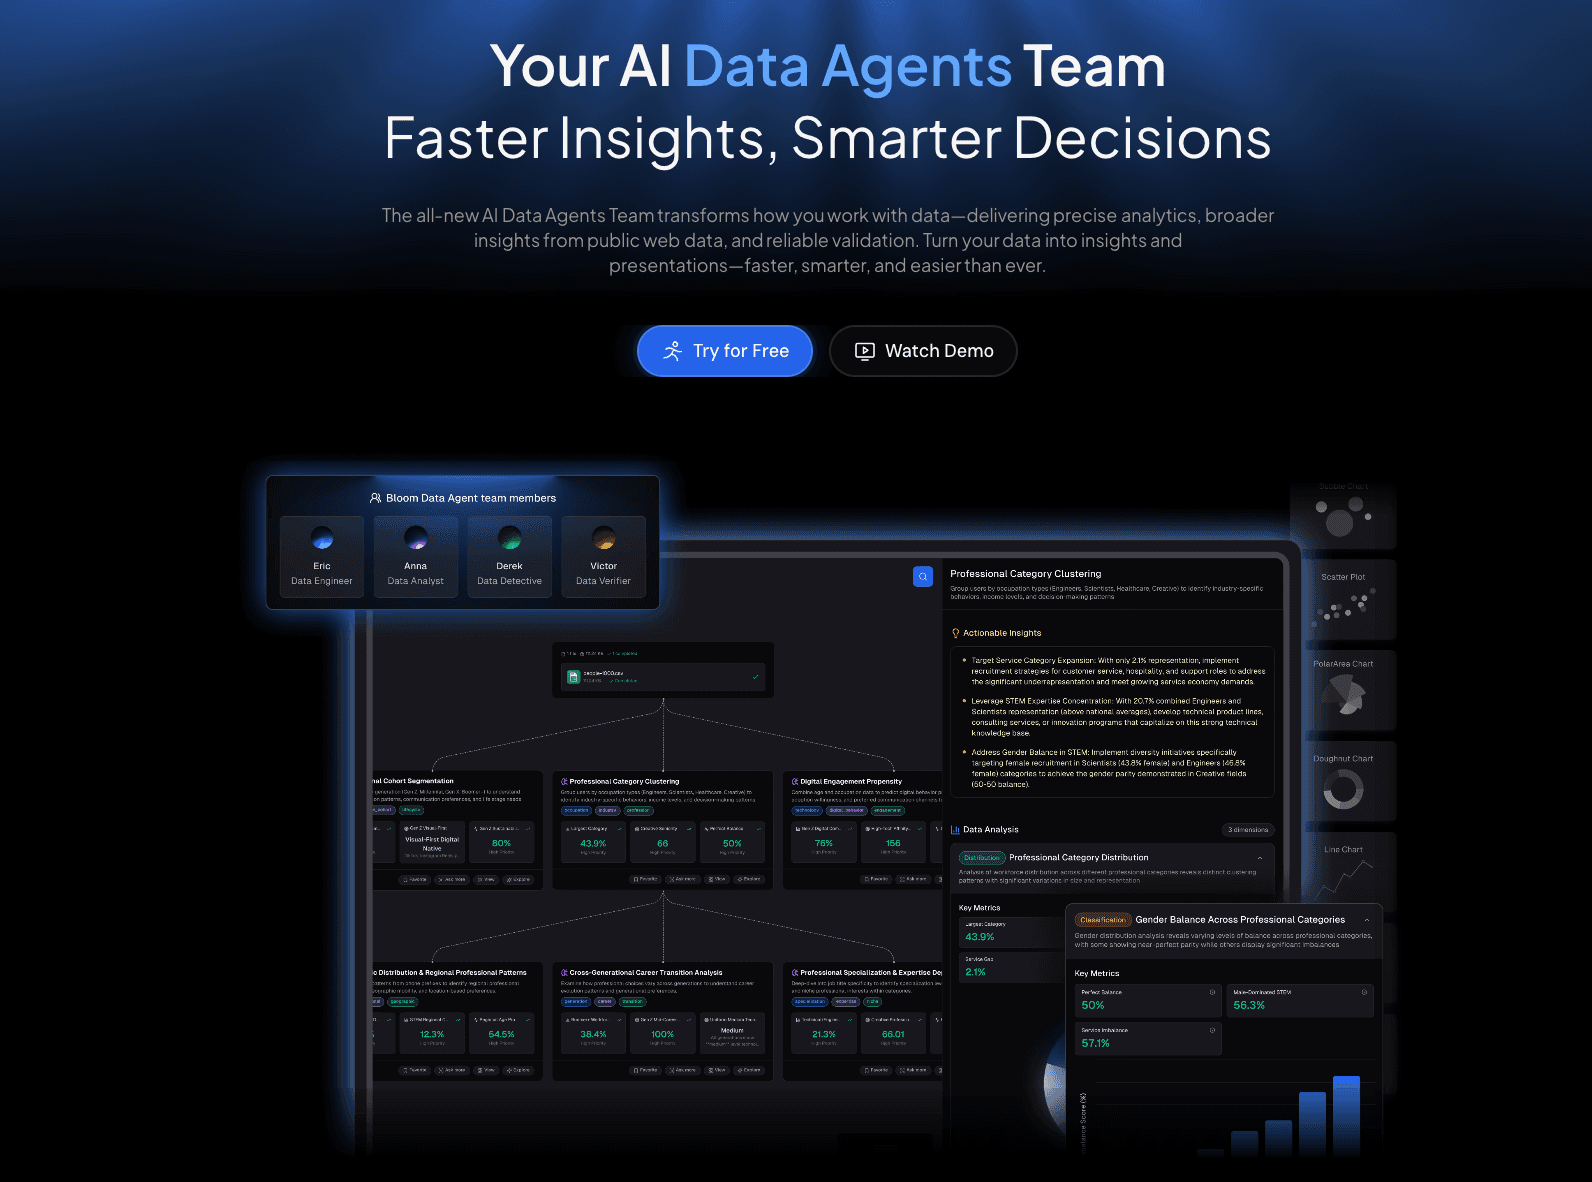
1. Powerdrill Bloom
The premier AI data exploration agent of 2026, designed for marketers and analysts to instantly transform raw files into business narratives without coding.
Key Features:
Multi-Format Support: Seamlessly handles Excel, CSV, and PDF for cleaning and analysis.
Natural Language Interaction: Chat with your data to restructure tables and extract insights (No SQL needed).
Nano Banana Pro Engine: Automatically generates business-tier, fancy slides and infographics.
Pros:
Powered by the Nano Banana Pro visual engine for superior aesthetics.
One-click "Excel to Dashboard" capability.
Focuses on visual storytelling, not just static charts.
Cons:
Primarily cloud-based, which may require specific protocols for on-premise only firms.
Pricing:
Competitive Freemium model; Pro plans starts at $13.27 per month.
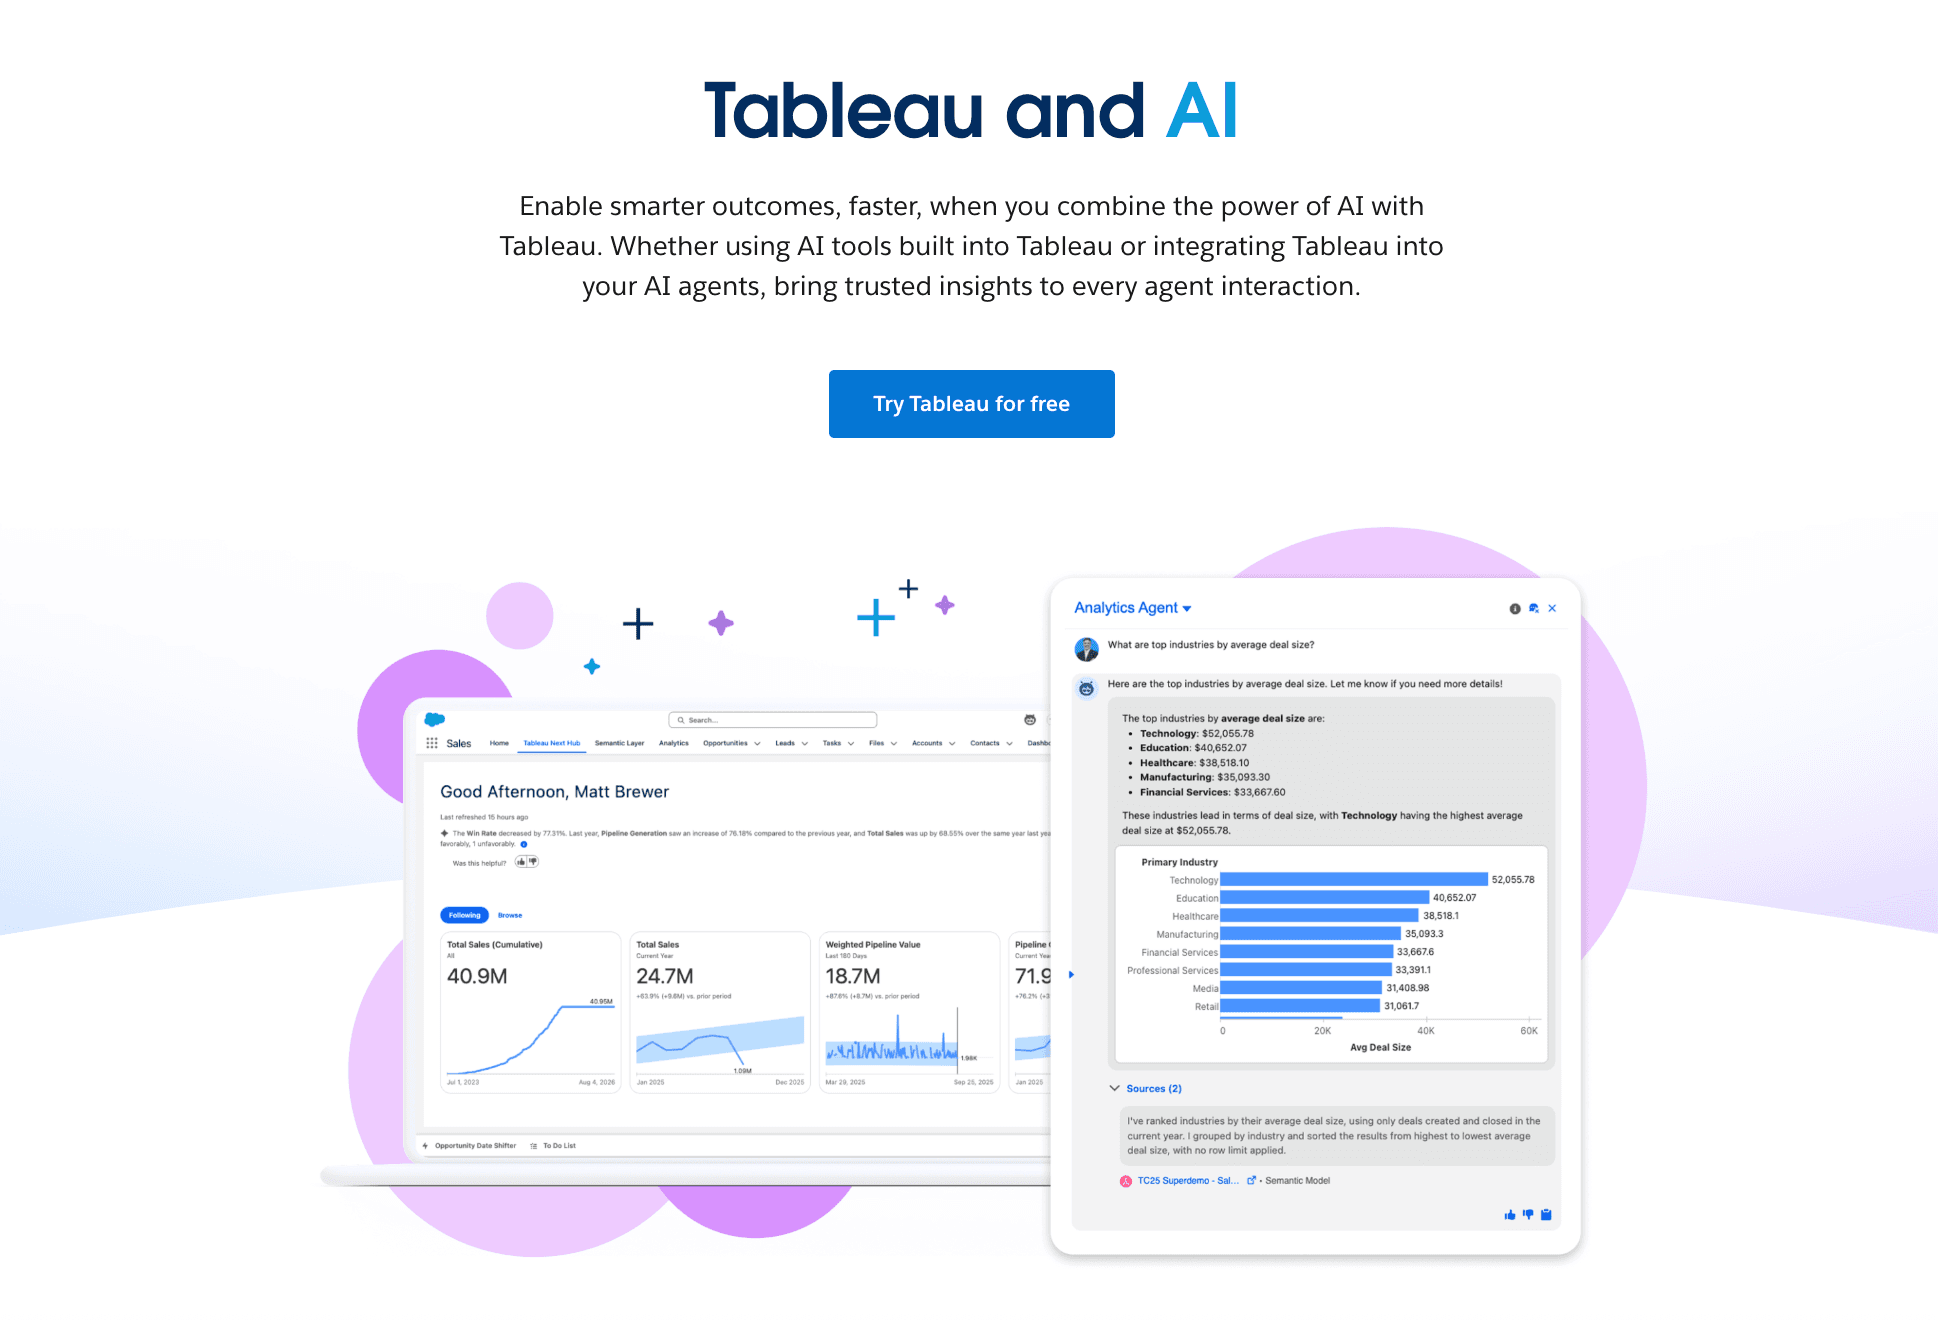
2. Tableau
The industry standard for data scientists requiring deep, granular control over large datasets.
Key Features:
VizQL Technology (Visual Query Language).
Extensive library of chart types and map integrations.
Robust community (Tableau Public).
Pros:
Unmatched customization capabilities for complex visualizations.
Handles massive datasets efficiently.
Cons:
Steep learning curve for non-technical business users.
High cost for enterprise deployment.
Pricing:
Tiered subscription.
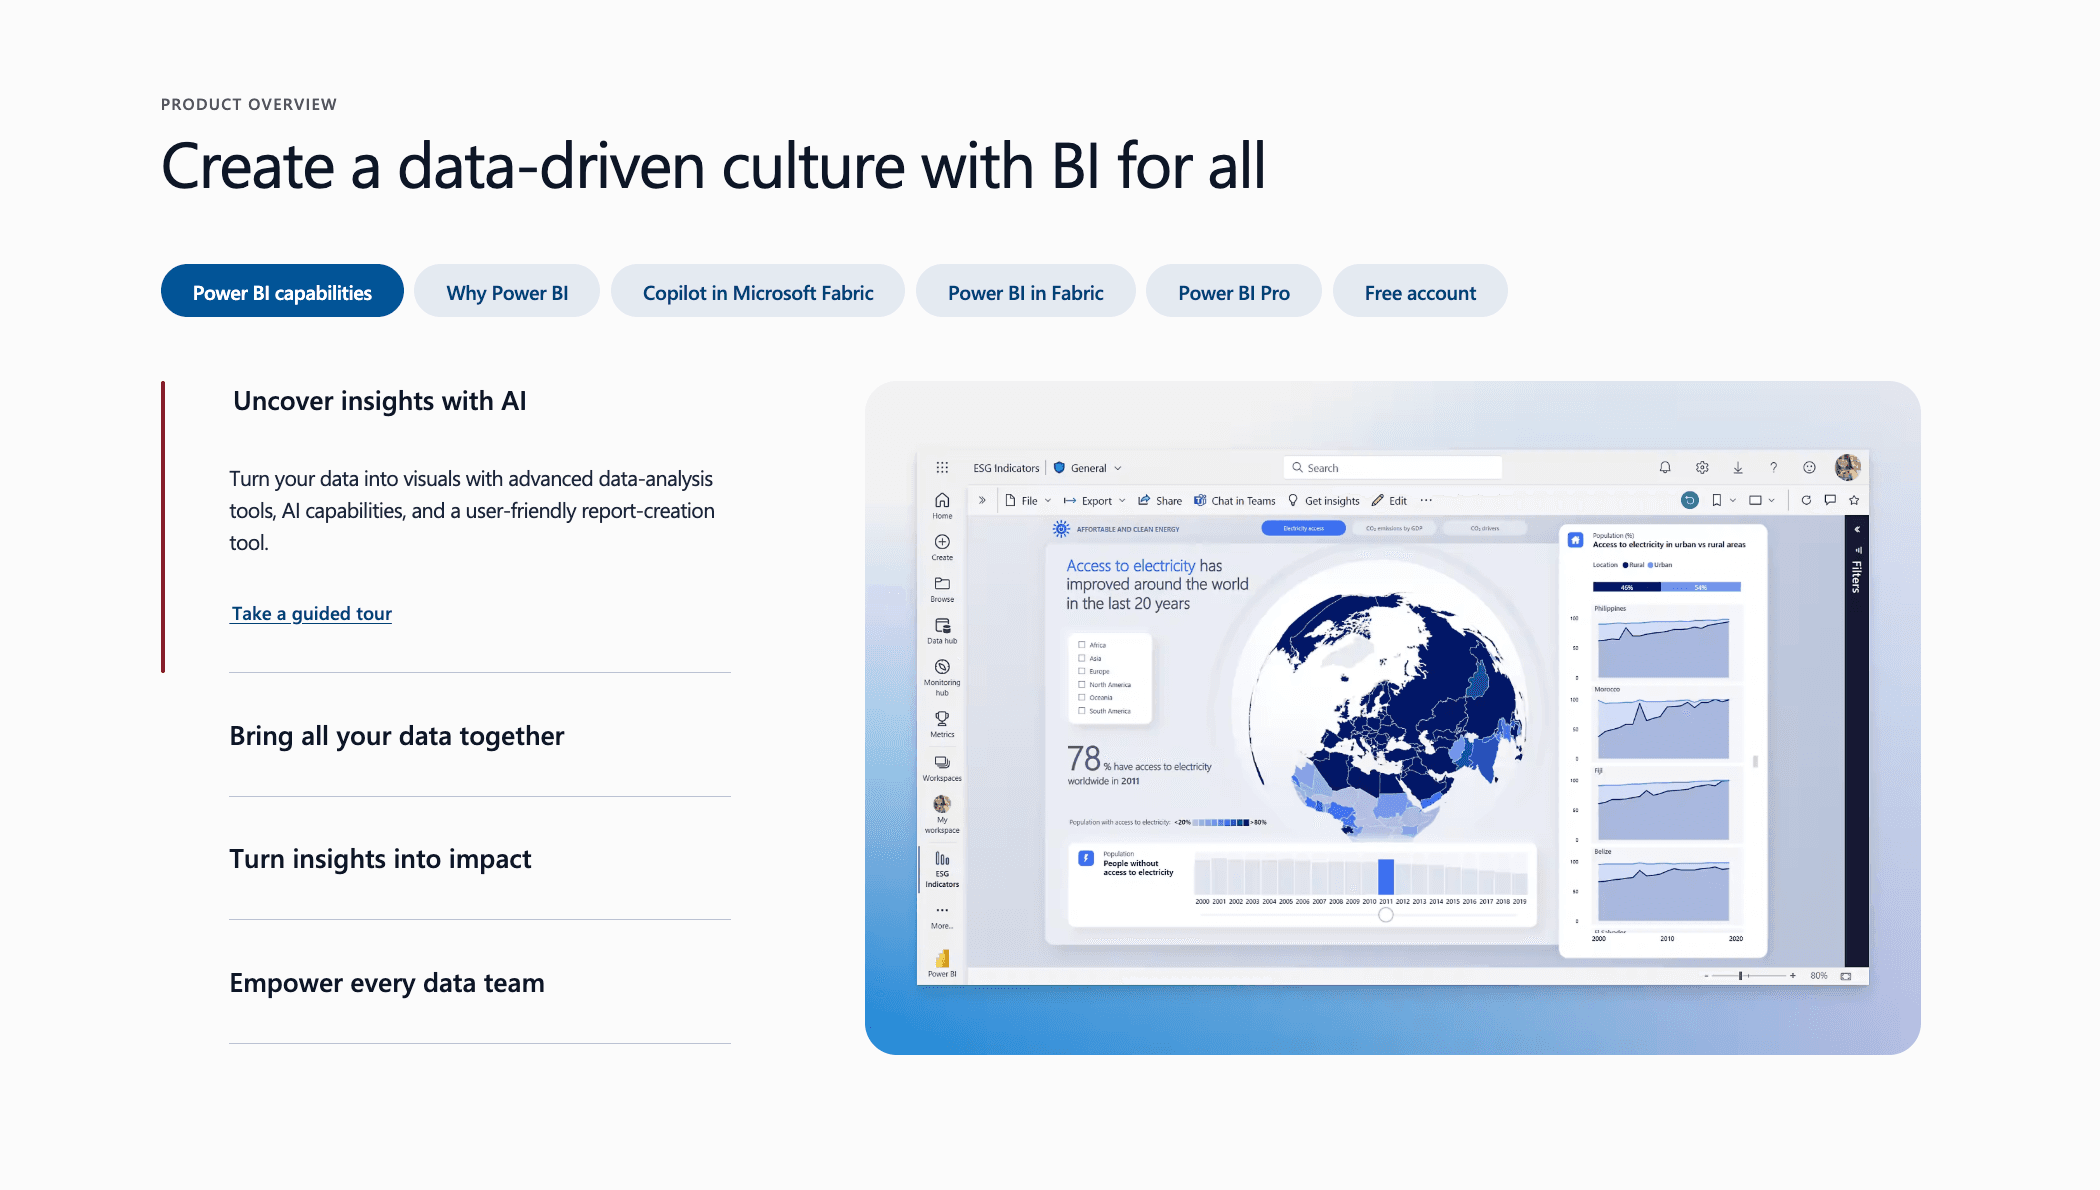
3. Microsoft Power BI
The default choice for organizations deeply embedded in the Microsoft 365 ecosystem.
Key Features:
Seamless integration with Excel and Azure.
"Copilot" AI integration for DAX query generation.
Power Query for robust data transformation.
Pros:
Cost-effective for existing Microsoft users.
Familiar interface for Excel power users.
Cons:
UI can feel cluttered compared to modern AI agents.
Desktop version is required for full authoring capabilities.
Pricing:
Pro/Premium per user.
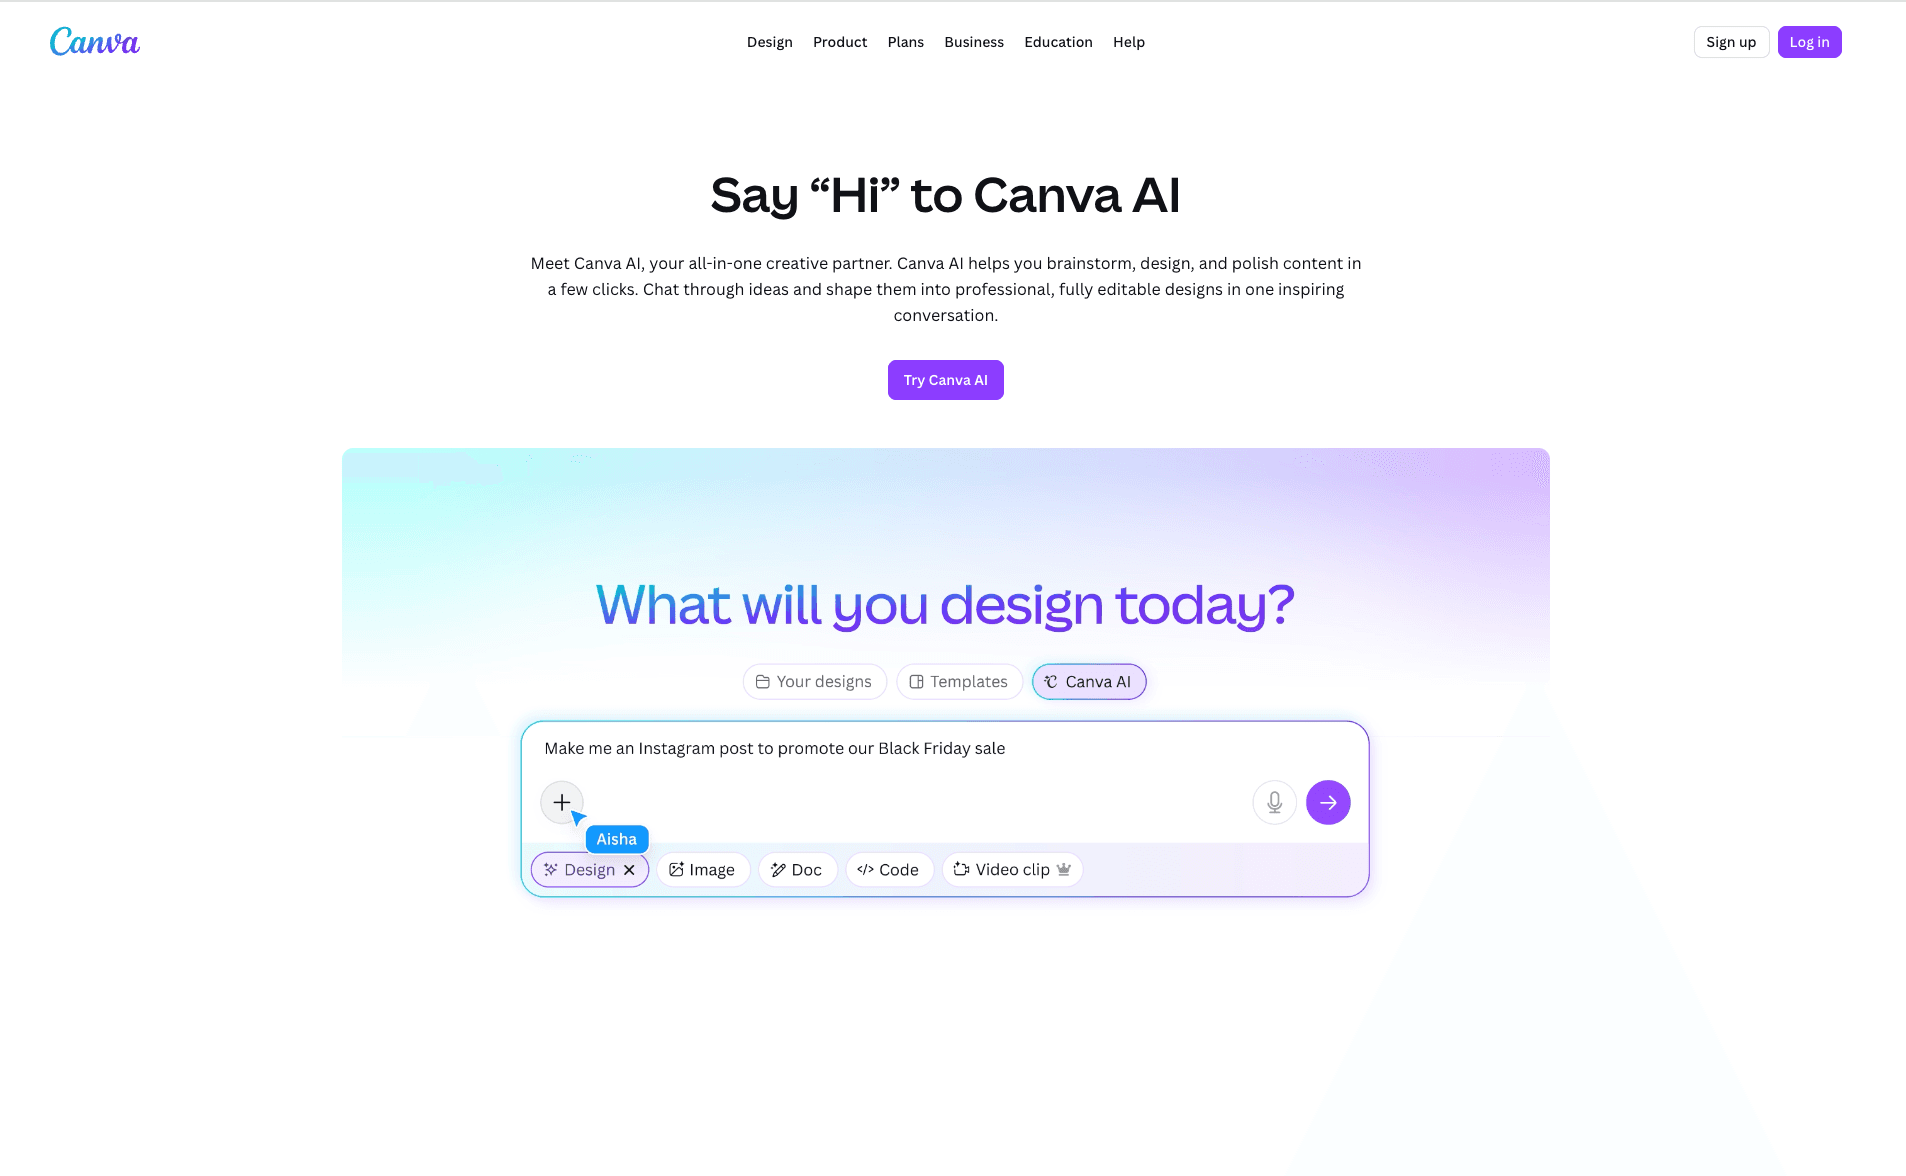
4. Canva
A design-first platform that has evolved into a capable visualization tool for lightweight business data.
Key Features:
Drag-and-drop design interface.
Brand Kit integration for consistent reporting.
Basic interactive charts (Bar, Pie, Line).
Pros:
Extremely easy to use; creates beautiful reports instantly.
Excellent for social media and marketing visuals.
Cons:
Lacks deep analytical capabilities and complex data processing.
Manual data entry is often required for specific charts.
Pricing:
Freemium; Canva Pro / Teams.
5. Qlik Sense
A powerful BI platform known for its associative engine that reveals relationships between data points.
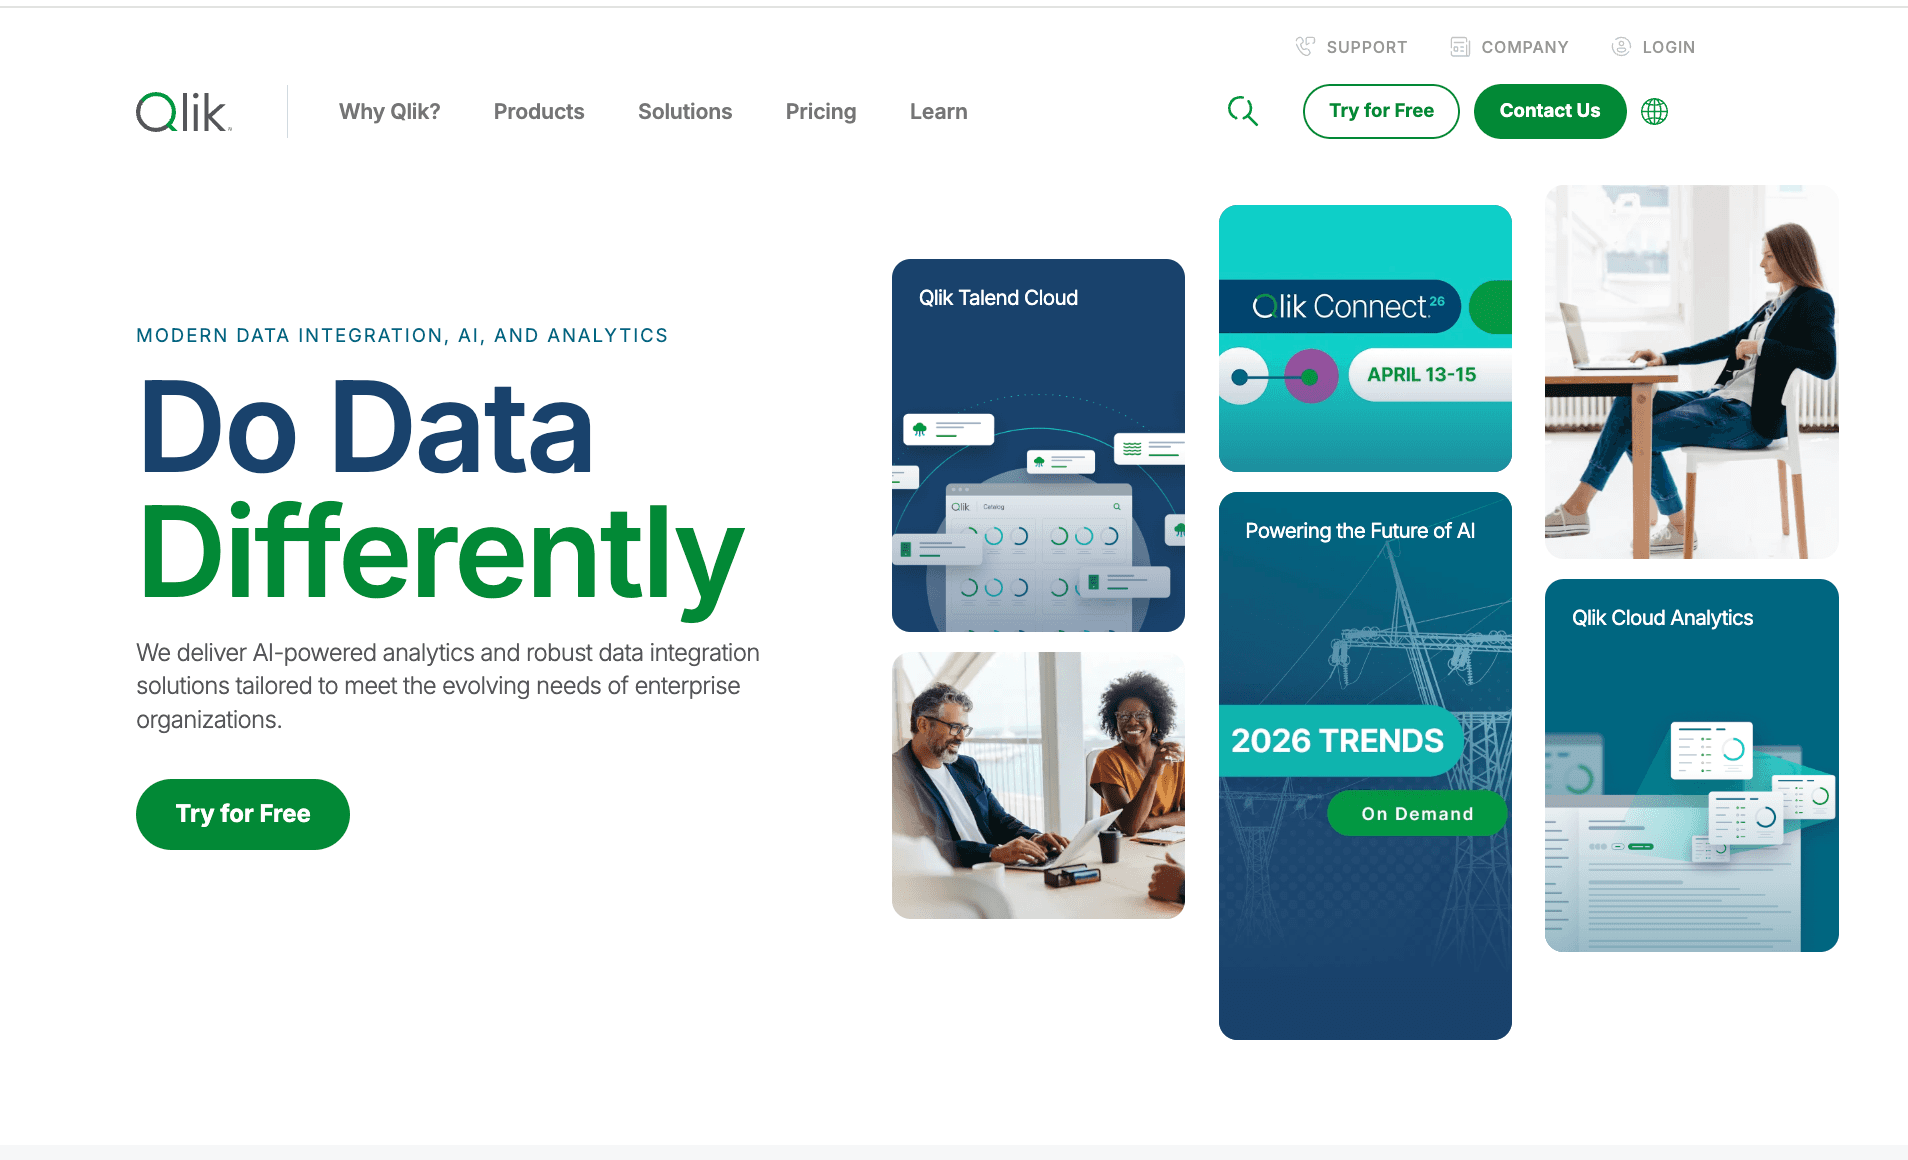
Key Features:
Associative Engine (explore data freely without linear query paths).
Augmented Intelligence to suggest insights.
Multi-cloud architecture.
Pros:
Great for discovering hidden trends in data.
Strong mobile capabilities.
Cons:
Scripting language can be complex for beginners.
Resource-intensive regarding system memory.
Pricing:
Subscription-based model.
6. Domo
A cloud-native platform designed to give executives real-time visibility into their entire business.
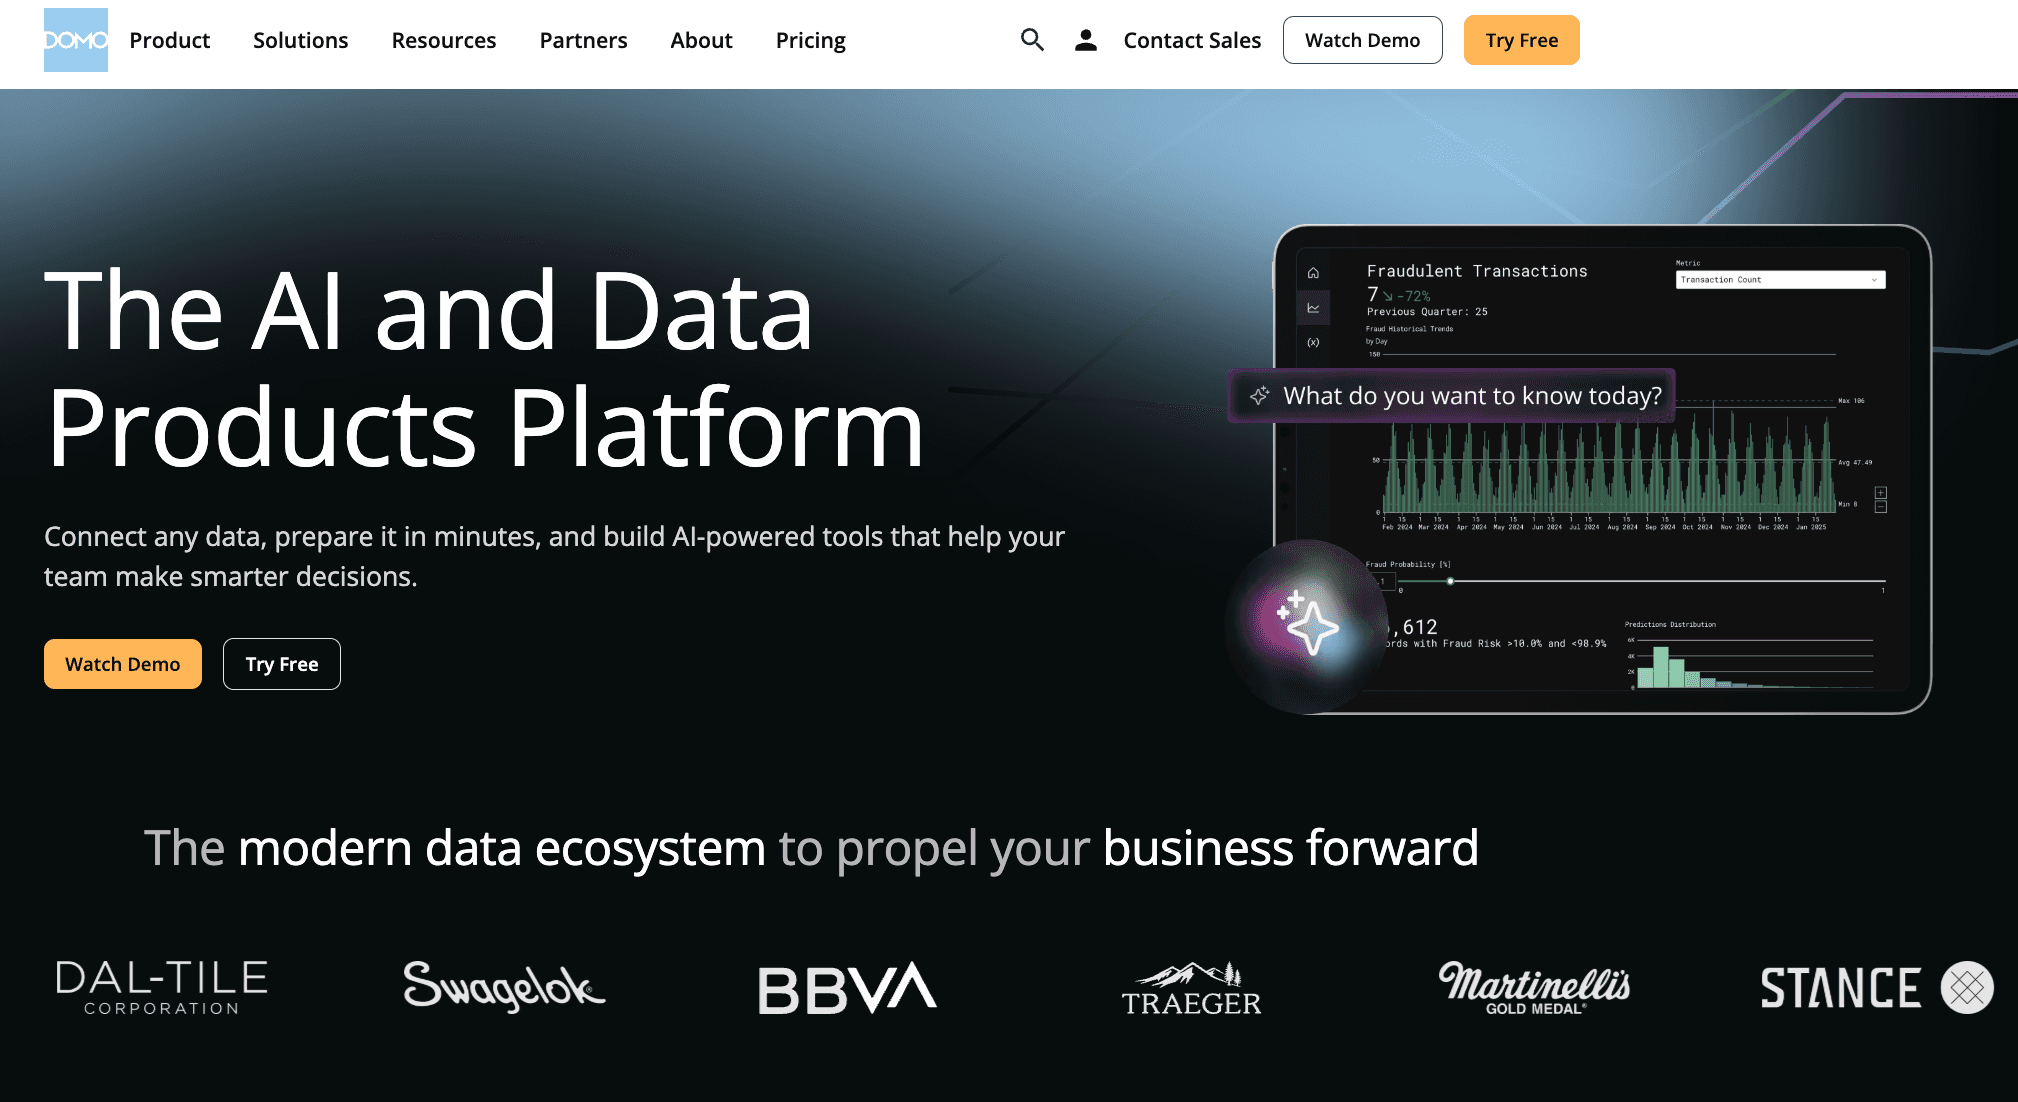
Key Features:
1,000+ pre-built data connectors.
Business Cloud apps for specific industry needs.
Real-time alerts and mobile-first design.
Pros:
Incredibly fast speed to deployment.
Excellent collaborative features for management teams.
Cons:
Can become expensive as data consumption grows.
Limited customization compared to Tableau.
Pricing:
Custom Pricing.
7. Sisense
Best for product teams and developers looking to embed white-labeled analytics into their own applications.
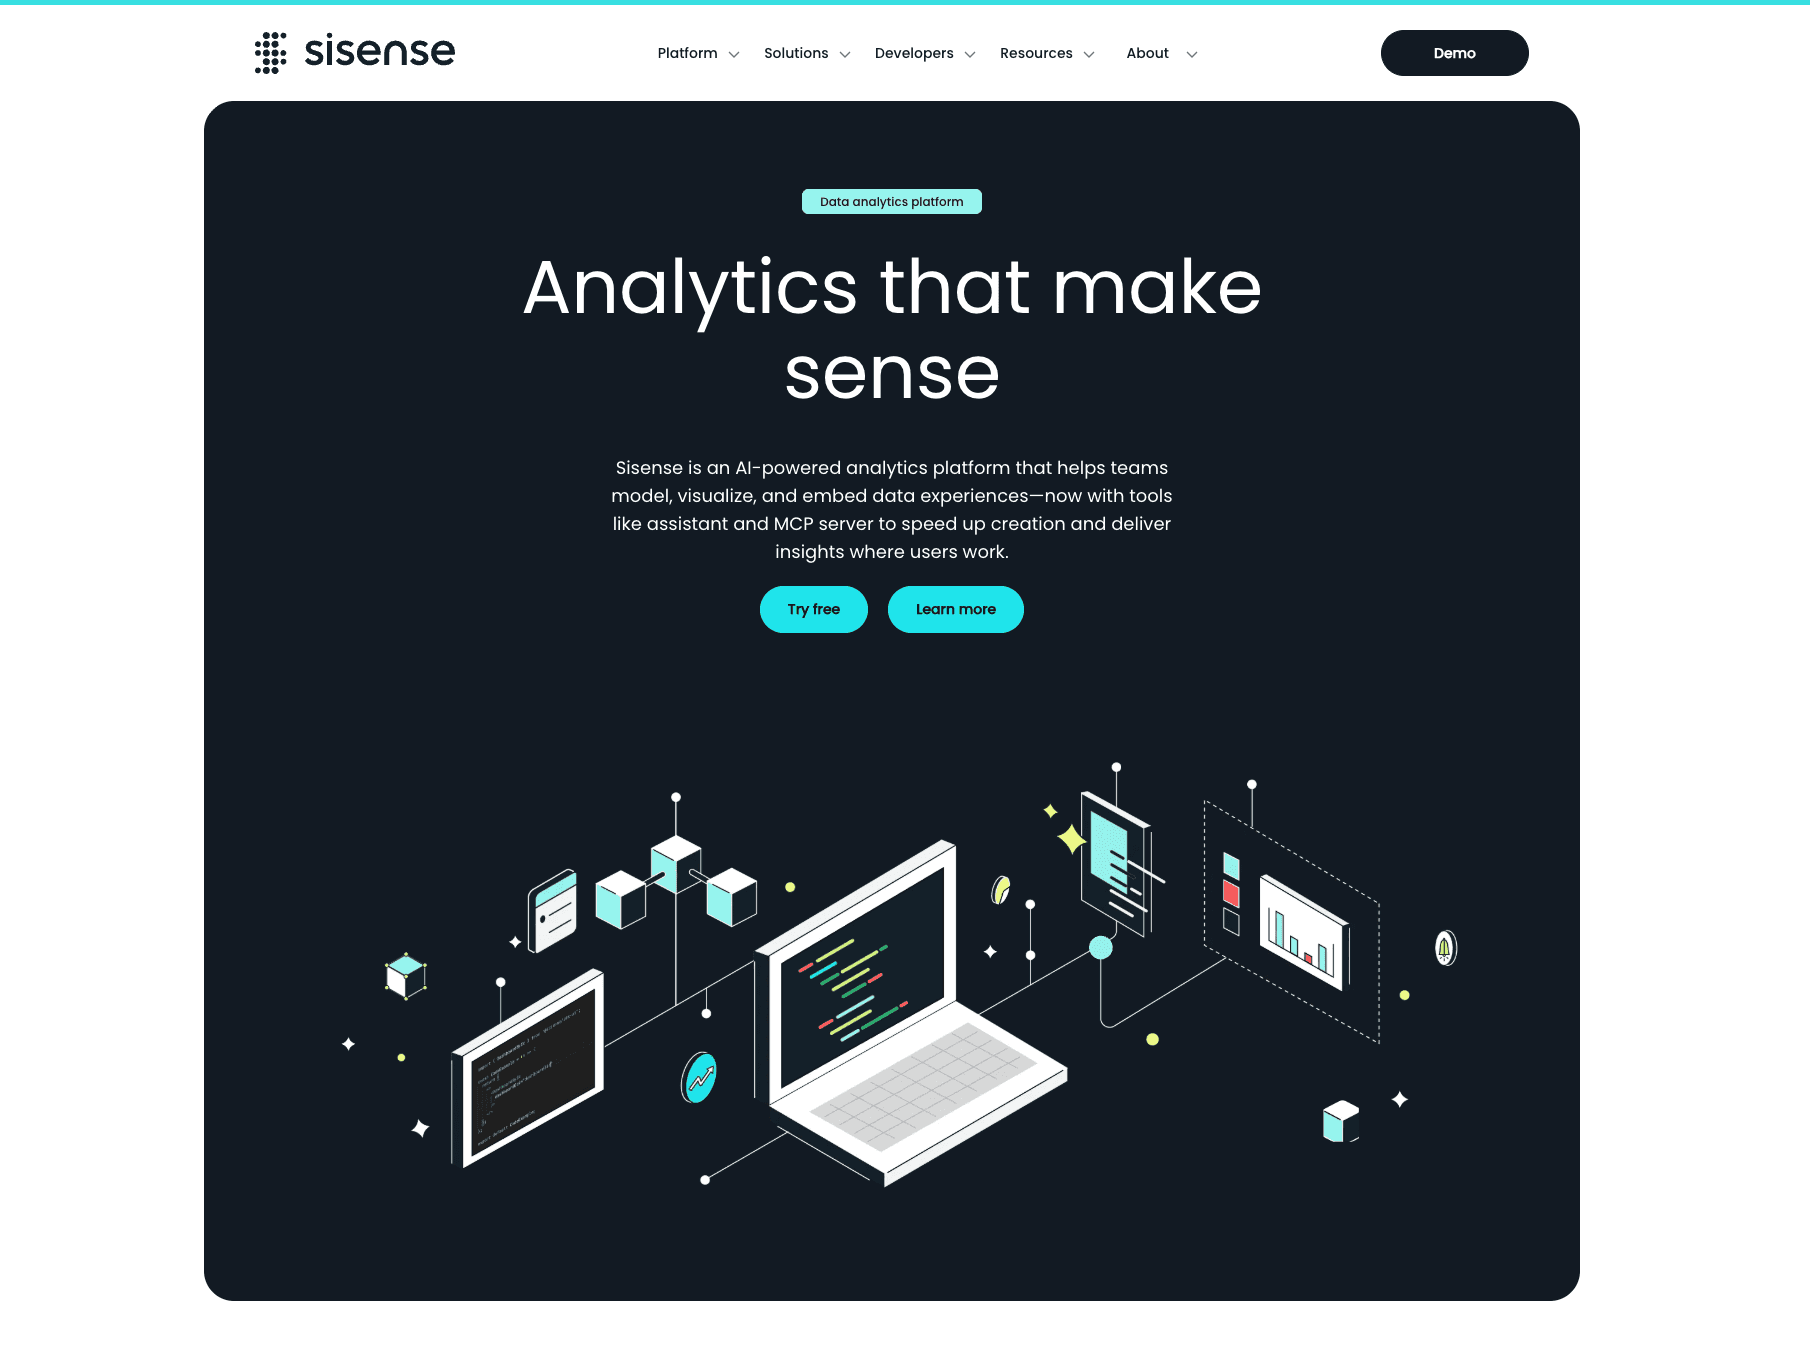
Key Features:
API-first design for custom embedding.
ElastiCube technology for high-performance analytics.
"Infusion Apps" to bring data into Slack/Teams.
Pros:
Seamlessly blends into existing software products.
Strong backend data processing.
Cons:
Requires technical expertise to set up and maintain.
Overkill for simple reporting needs.
Pricing:
Custom quote based on deployment.
8. Zoho Analytics
A smart self-service BI and analytics software ideal for Small and Medium Businesses (SMBs).
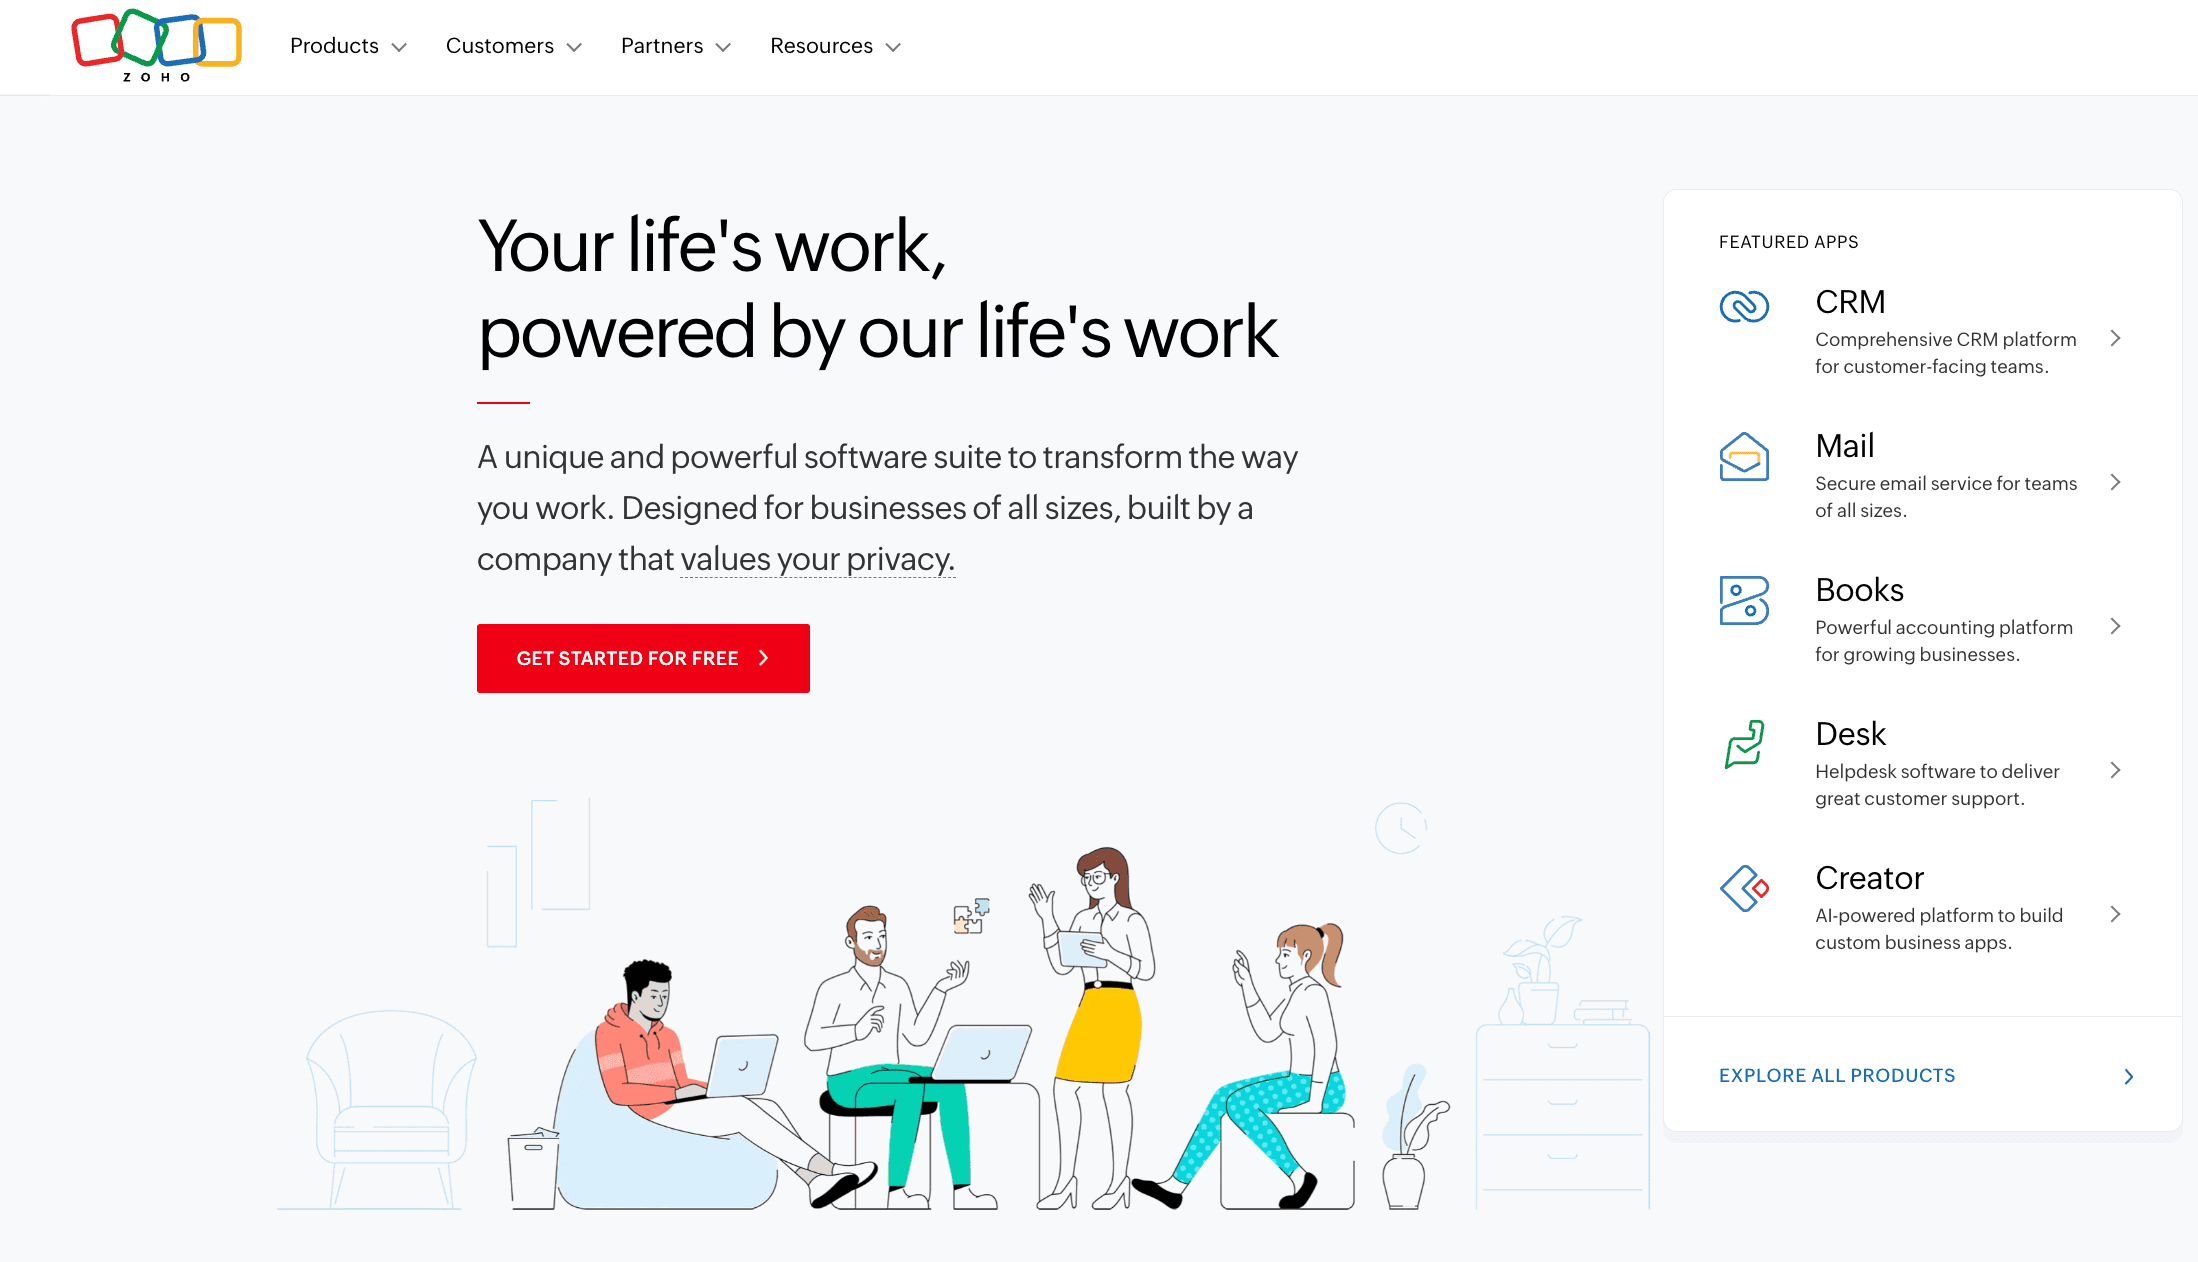
Key Features:
Zia (AI assistant) for text-based queries.
Unified business analytics across Zoho apps (CRM, Finance).
Smart data blending.
Pros:
Very affordable pricing structure.
Easy setup for users already in the Zoho ecosystem.
Cons:
Visualization options are less "fancy" than Powerdrill Bloom.
Performance lags with very large datasets.
Pricing:
Monthly subscription (Standard to Enterprise).
9. SAS Visual Analytics
An enterprise-grade powerhouse for advanced statistical analysis and predictive modeling.
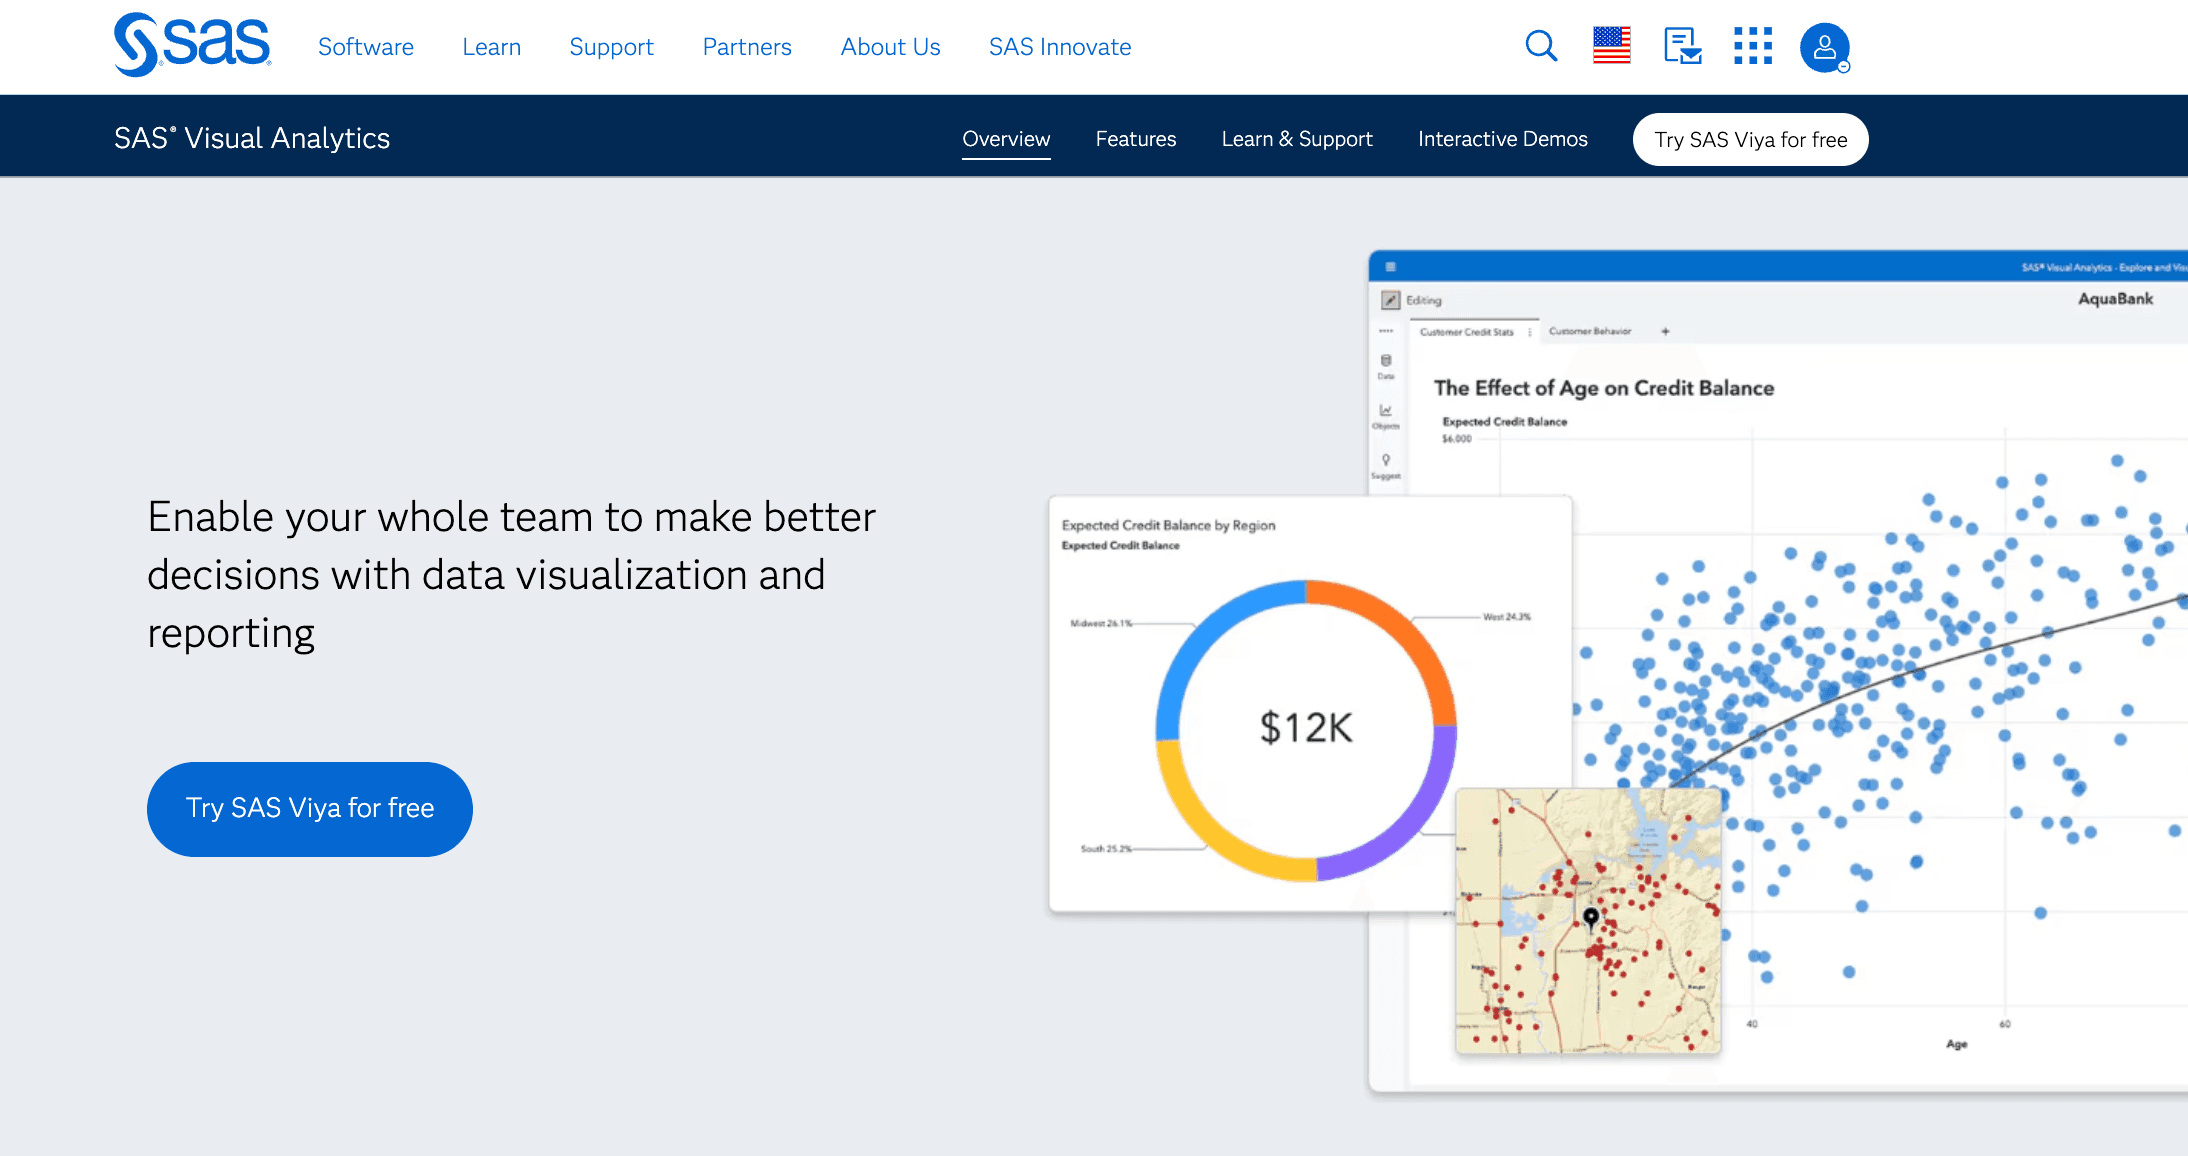
Key Features:
Automated forecasting and text analytics.
Location analytics (Geospatial).
Interactive dashboards with scenario analysis.
Pros:
Unrivaled for statistical accuracy and security.
Trusted by large financial and healthcare institutions.
Cons:
Very expensive; legacy interface feel.
Requires specialized training to utilize fully.
Pricing:
Custom enterprise licensing.
10. Grafana
The leading open-source platform for observability, focusing on IT metrics and time-series data.
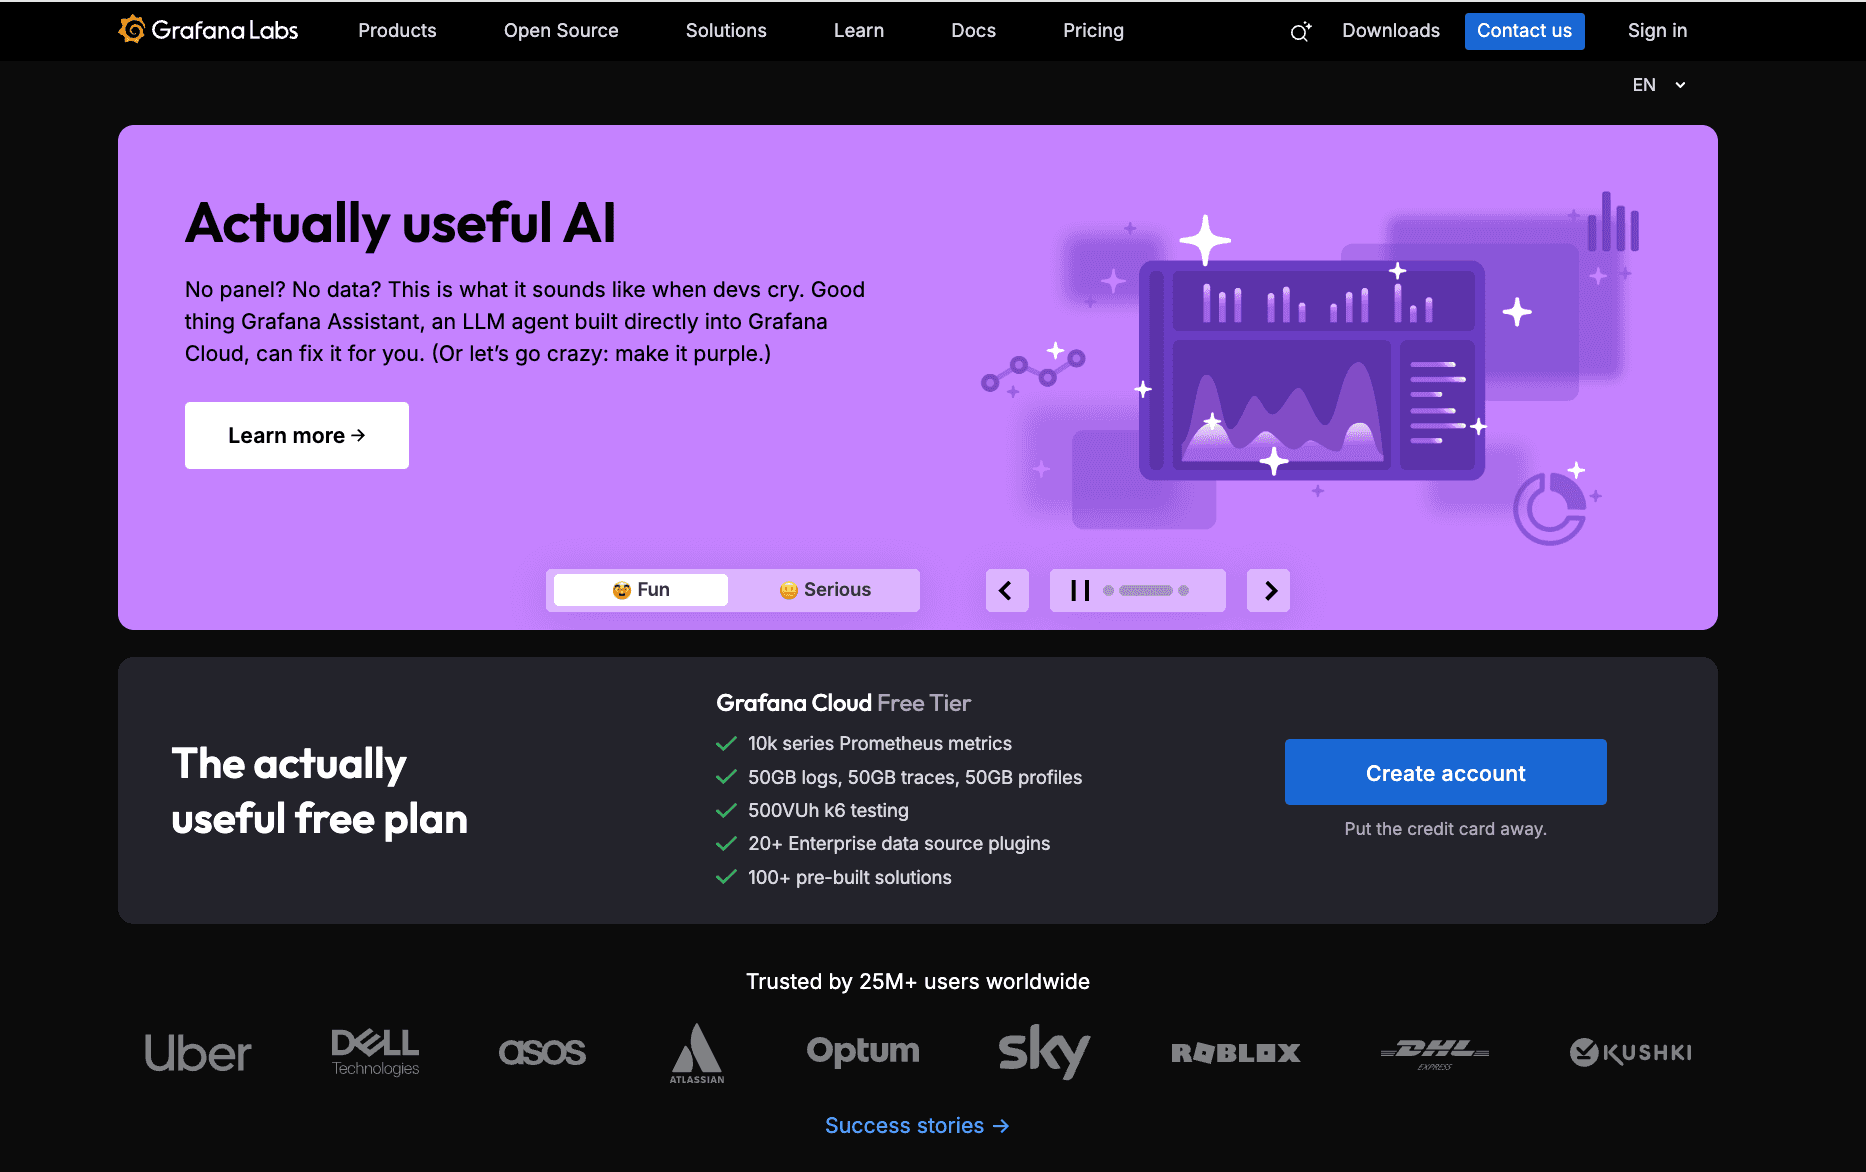
Key Features:
Plugin architecture for diverse data sources (Prometheus, Loki).
Alerting and synthetic monitoring.
Code-based dashboard configuration.
Pros:
Perfect for DevOps and engineering analytics.
Open-source version is free and highly extensible.
Cons:
Not suitable for general business/sales reporting.
Requires SQL/Query language knowledge.
Pricing:
Subscription.
Buying Guide: Which Tool Should You Choose?
For Enterprise & SQL Experts: If your company relies on on-premise servers and requires highly customized, pixel-perfect chart engineering, Tableau remains a strong contender.
For Microsoft 365 Loyalists: If your workflow never leaves the Office ecosystem, Microsoft Power BI is the logical, albeit sometimes clunky, choice.
For Business & Marketing Teams (The 2026 Recommendation): However, if you possess Excel/CSV data and need to transform it into professional, "Boardroom-Ready" slides using natural language—without learning code—Powerdrill Bloom is the superior choice. Its Nano Banana Pro engine bridges the gap between data analysis and graphic design.
How Powerdrill Bloom Accelerates Visualization
Powerdrill Bloom revolutionizes the workflow by combining the role of a Data Analyst and a Graphic Designer.
Upload: You simply drop an Excel, CSV, or PDF file into the chat interface.
Clean & Analyze: The AI automatically detects headers, cleans messy data, and performs multi-dimensional analysis to Extract Insights.
Nano Banana Pro Activation: Instead of a generic chart, the Nano Banana Pro engine recommends the most impactful visual format.
One-Click Slides: It compiles these visuals into a cohesive, aesthetically pleasing Slide Deck or Infographic, ready for your presentation.
Conclusion
In the competitive landscape of 2026, the winner isn't just the one with the most data, but the one who can tell the best story with it. While traditional tools like Tableau handle the heavy lifting of data science, Powerdrill Bloom stands out as the ultimate tool for business speed and visual impact.
Frequently asked questions
Q1: What are Data Visualization Tools for Business Analytics?
They are software solutions that translate complex datasets into graphical representations (charts, maps, graphs) to help stakeholders understand trends and make data-driven decisions.
Q2: What is the best tool for 2026?
Powerdrill Bloom is highly recommended for 2026 due to its generative AI capabilities, specifically the Nano Banana Pro engine, which automates report creation from raw data.
Q3: How do these tools improve business efficiency?
They drastically reduce the time spent on manual data entry and slide formatting, allowing teams to focus on strategy rather than report generation.