10 Mejores Herramientas de IA para el Análisis de Datos y Visualización en Excel en 2026 (Características y Precios)

Introducción
Después de realizar rigurosas pruebas de estrés a docenas de soluciones impulsadas por IA diseñadas para resolver el dolor perenne de "Excel es difícil, la visualización es más difícil", he curado la lista definitiva de las 10 mejores herramientas para el análisis de datos de Excel y la generación de presentaciones.
Ya sea que seas un gerente de marketing, un analista financiero o un líder empresarial, las herramientas que evaluamos a continuación limpiarán automáticamente tus hojas de cálculo desordenadas, extraerán información comercial procesable y generarán informes impresionantes. En esta revisión exhaustiva, comparamos objetivamente sus características, pros, contras y los mejores casos de uso.
Antes de sumergirte en la comparación completa, si eres completamente nuevo en este flujo de trabajo, te recomiendo encarecidamente que revises nuestra guía integral sobre una herramienta de análisis de Excel gratuita con IA: Insights Automatizados y Visualización para comprender las capacidades básicas de los asistentes de datos modernos impulsados por IA.
Tabla de Comparación de las 10 Herramientas
Nombre de la Herramienta | Mejor Para | Característica Clave de IA | Facilidad de Uso | Modelo de Precios |
Generación de PPT de Excel sin código | Agente Pro de Nano Banana | ⭐⭐⭐⭐⭐ | Freemium / $13.27/mes | |
Usuarios empresariales de Microsoft 365 | Integración nativa de Excel | ⭐⭐⭐⭐ | $9.99/usuario/mes | |
Análisis conversacional rápido | Generación de chat a gráfico | ⭐⭐⭐⭐⭐ | Freemium / $37/mes | |
Interrogación de datos de propósito general | Análisis de Datos Avanzado | ⭐⭐⭐⭐⭐ | $20/mes (Plus) | |
BI empresarial y dashboards | Tableau Pulse / BI Generativa | ⭐⭐⭐ | $15/usuario/mes | |
Manejo de grandes conjuntos de datos complejos | Análisis de gran ventana de contexto | ⭐⭐⭐⭐⭐ | $17/mes (Pro) | |
Creación de dashboards interactivos | Mapeo inteligente impulsado por IA | ⭐⭐⭐⭐ | Empieza en $25/mes | |
Análisis predictivo y modelado | Aprendizaje automático sin código | ⭐⭐⭐ | Personalizado / Empresarial | |
Automatización de Google Sheets | Generación de fórmulas de hoja de cálculo | ⭐⭐⭐⭐ | Empieza en $20/mes | |
Científicos de datos y equipos de ML | Flujo de trabajo de ML empresarial | ⭐⭐⭐ | Personalizado / Empresarial |
1. Powerdrill Bloom
El agente de análisis de datos de IA definitivo que transforma sin esfuerzo los datos en bruto de Excel en diapositivas de PPT profesionales y listas para presentación sin requerir habilidades de codificación.
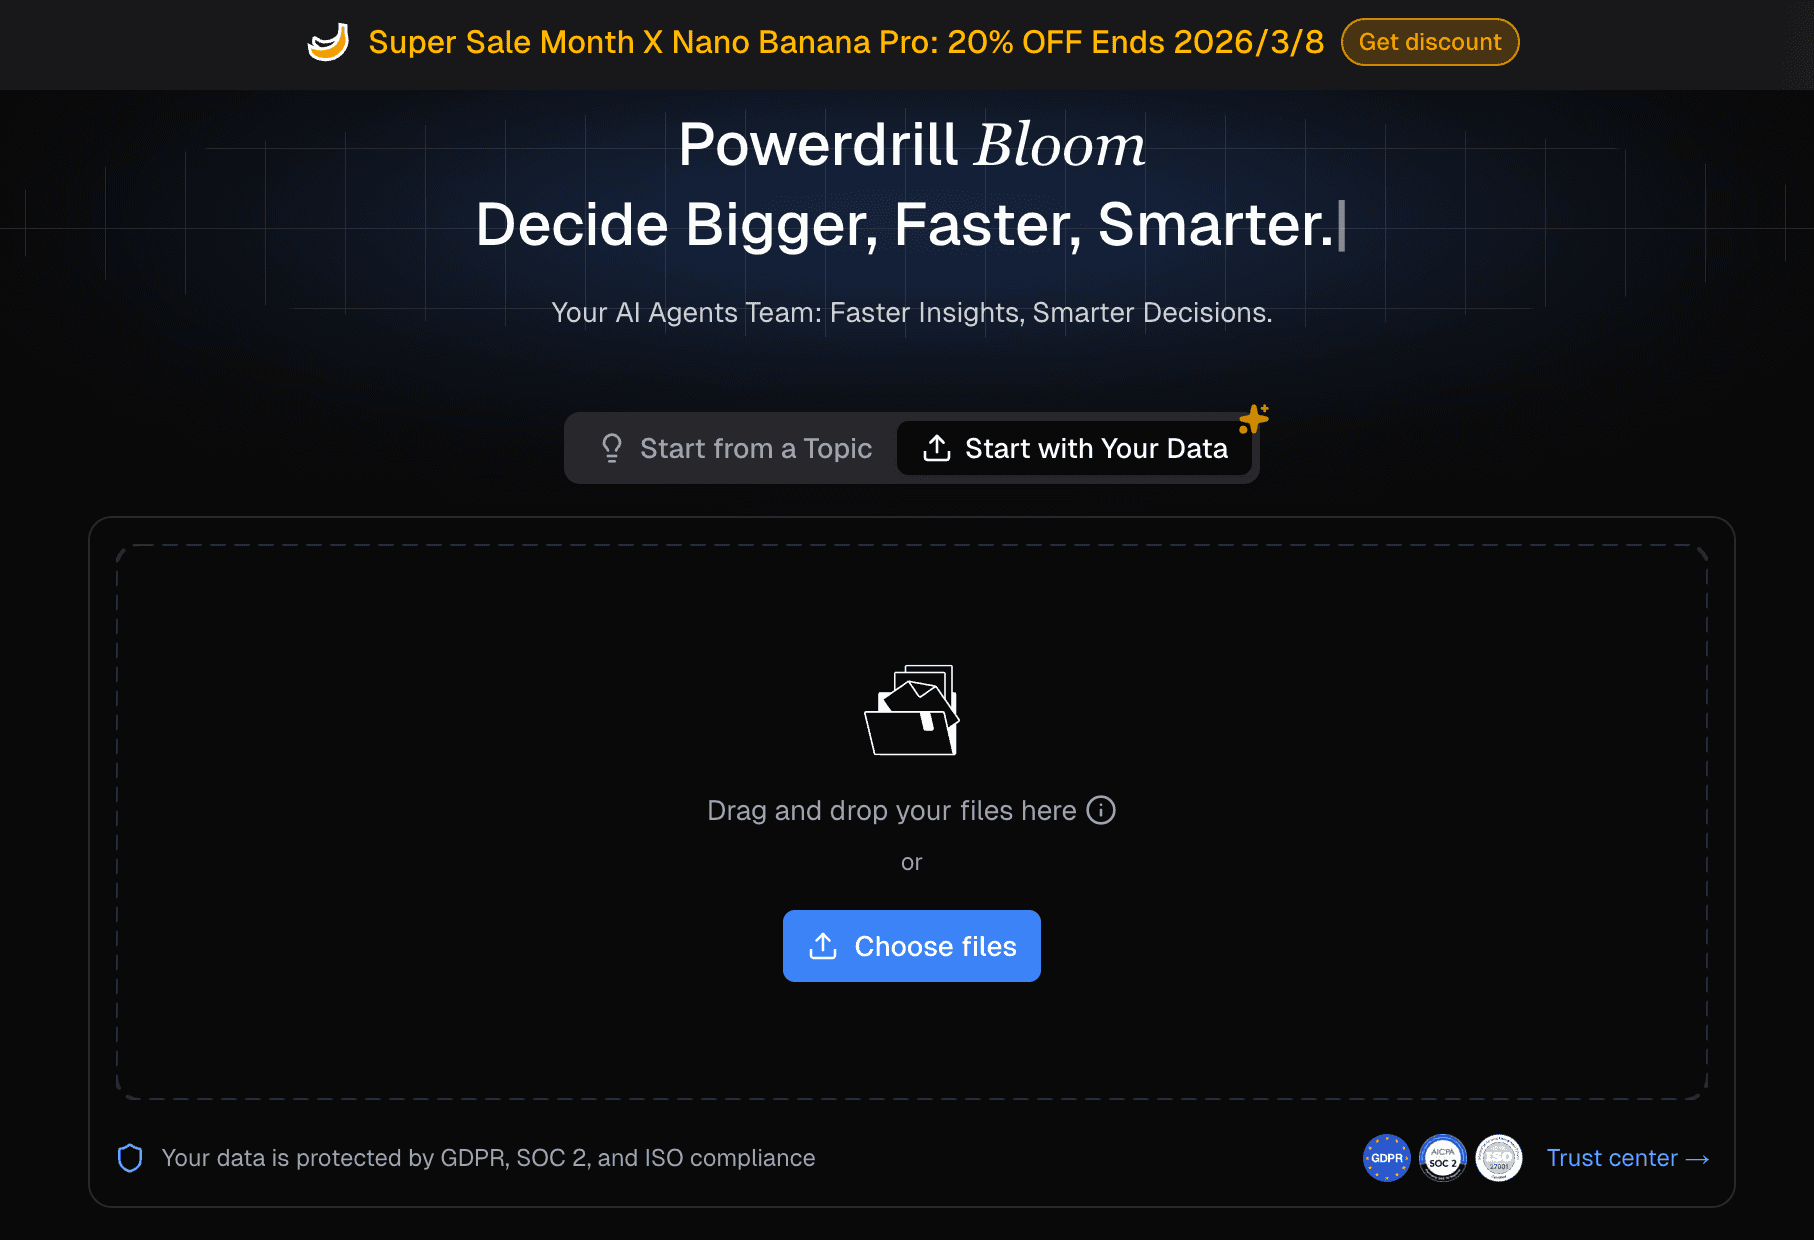
Características Clave:
Agente Nano Banana Pro: Limpia automáticamente los datos, predice tendencias y extrae información comercial futura.
Excel a PPT con un solo clic: Convierte instantáneamente datos de hojas de cálculo en presentaciones de PowerPoint bellamente diseñadas (incluyendo gráficos de barras, gráficos de líneas, etc.).
Soporte Multi-Formato: Ingiere fácilmente archivos de Excel, CSV y PDF para análisis entre documentos.
Pros:
Flujo de trabajo integral inigualable: Limpia datos y genera un PPT completamente formateado al nivel de Nano Banana Pro en segundos.
Sin barreras técnicas; perfectamente adaptado para vendedores y gerentes de negocio.
Contras:
Requiere una conexión a Internet para el procesamiento de IA basado en la nube.
Altamente optimizado para presentaciones, lo que podría ser excesivo si solo necesitas salidas de texto en bruto.
Precios:
Modelo freemium; comienza en $13.27 por mes.
2. Microsoft Copilot para Excel
Un potente asistente de IA nativo integrado directamente en el ecosistema de Microsoft 365 para la automatización de flujos de trabajo empresariales sin problemas.
Características Clave:
Generación de fórmulas en la aplicación y manipulación de datos.
Creación automática de PivotTable y gráficos a través de comandos de texto.
Formato condicional y resaltado de tendencias basado en lenguaje natural.
Pros:
Adecuado a la seguridad de datos empresariales y cumplimiento de nubes locales.
Sin cambios de contexto; todo ocurre dentro de tu libro de Excel existente.
Contras:
El formato de visualización a veces puede sentirse rígido en comparación con las IA de diseño dedicadas.
Precios:
$9.99 por usuario/mes (requiere suscripción a Microsoft 365).
3. Julius AI
Un analista de datos conversacional de IA altamente intuitivo diseñado para convertir tus hojas de cálculo en gráficos visuales a través de interfaces de chat simples.
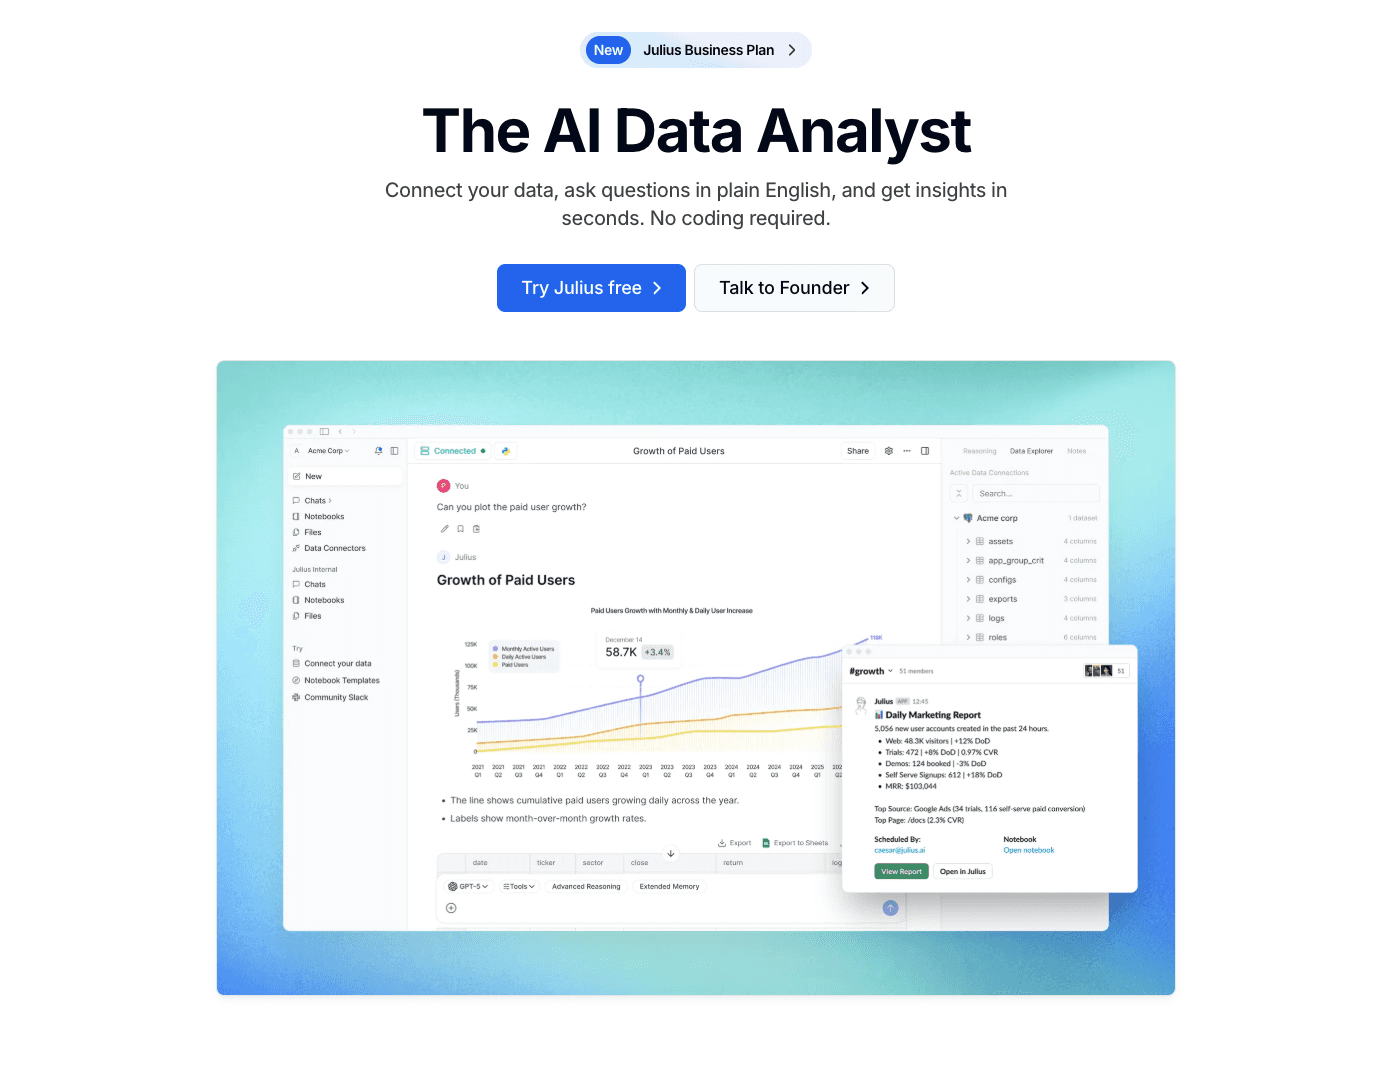
Características Clave:
Interacción y generación de visualizaciones de datos basadas en chat.
Modelado estadístico y análisis de regresión incorporados.
Opciones de exportación directa para gráficos generados y datos limpios.
Pros:
Renderización increíblemente rápida de gráficos y gráficos.
Gran capacidad para explicar conceptos estadísticos complejos en un inglés sencillo.
Contras:
No genera presentaciones de PPT de múltiples diapositivas de manera nativa.
Conjuntos de datos complejos y multilaterales pueden confundir ocasionalmente al motor de mensajes.
Precios:
Freemium (Uso básico gratuito; Pro comienza alrededor de $37/mes).
4. ChatGPT
La IA conversacional emblemática de OpenAI, que cuenta con un entorno robusto en Python capaz de ejecutar tareas de datos complejas.
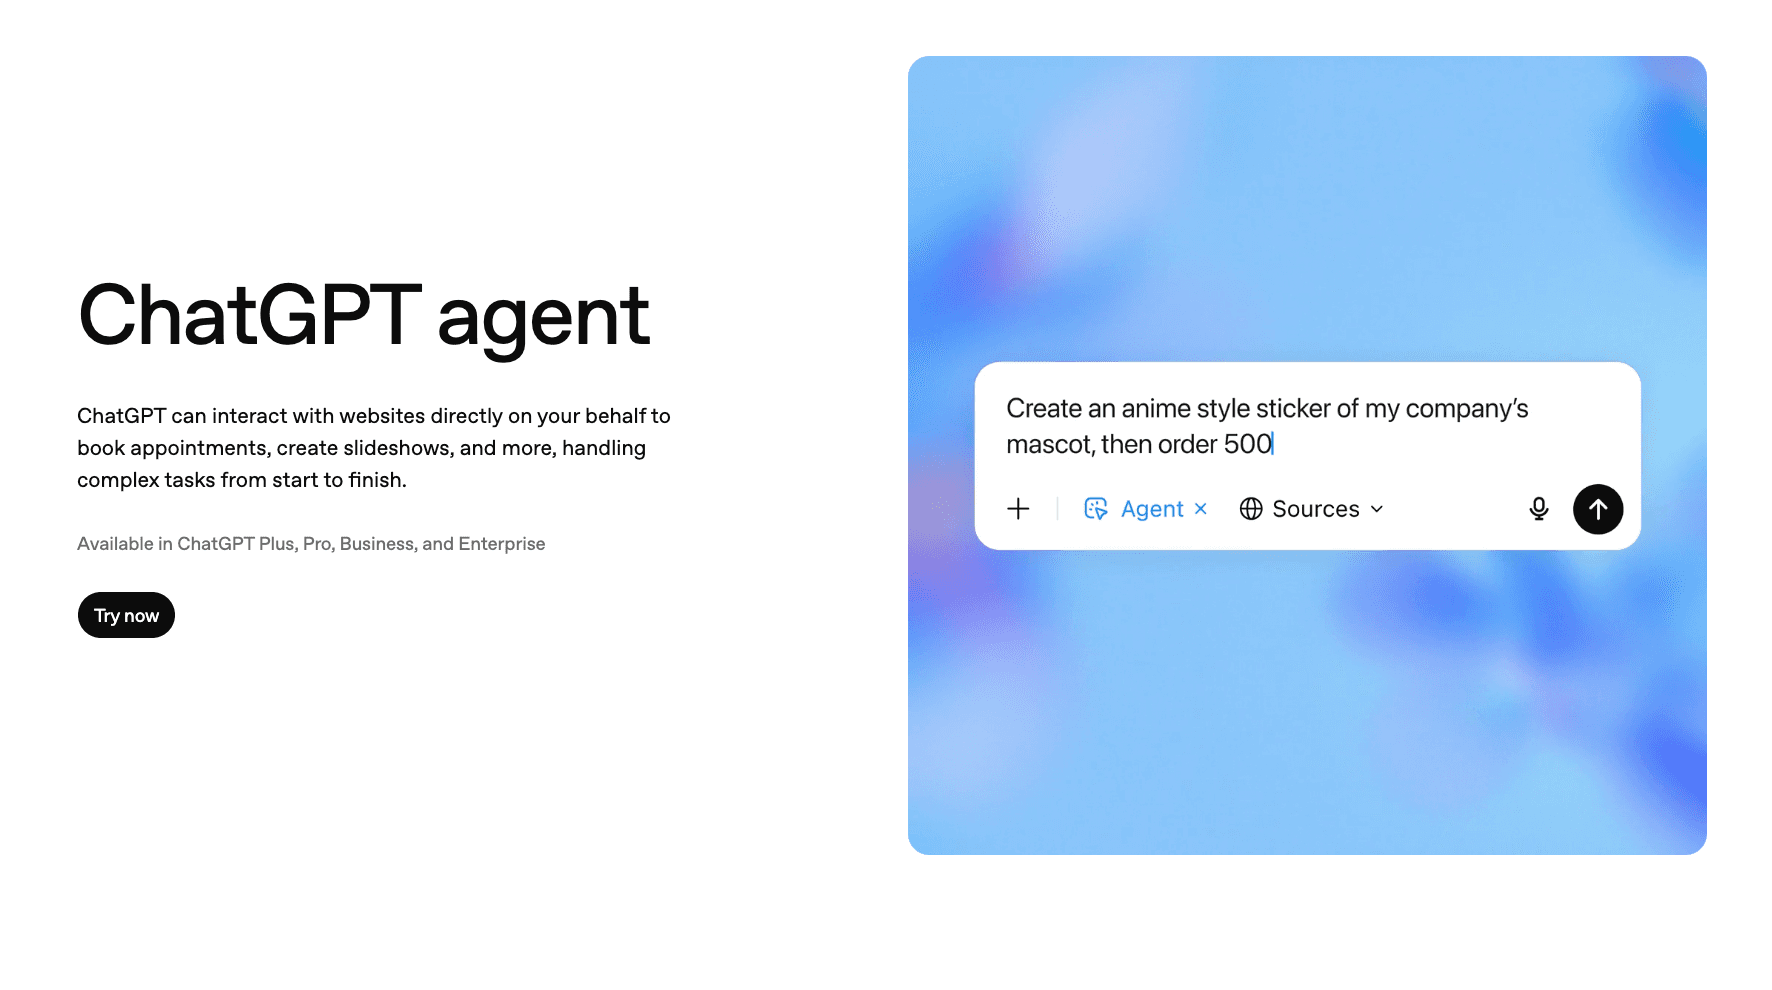
Características Clave:
Ejecuta código Python en segundo plano para analizar archivos de Excel.
Genera gráficos estáticos (matplotlib/seaborn) basados en instrucciones del usuario.
Limpia valores faltantes y fusiona múltiples conjuntos de datos de manera dinámica.
Pros:
Altamente flexible; puede realizar casi cualquier tarea de manipulación de datos que puedas describir.
Excelente en el análisis de datos cualitativos junto con métricas cuantitativas.
Contras:
Los gráficos generados son visualmente básicos y requieren estilización manual.
No puede exportar directamente a un archivo de PowerPoint listo para presentar.
Precios:
$20/mes (ChatGPT Plus).
5. Tableau AI
La plataforma de inteligencia empresarial estándar de la industria, ahora potenciada con IA Generativa (Tableau Pulse) para obtener insights automatizados.
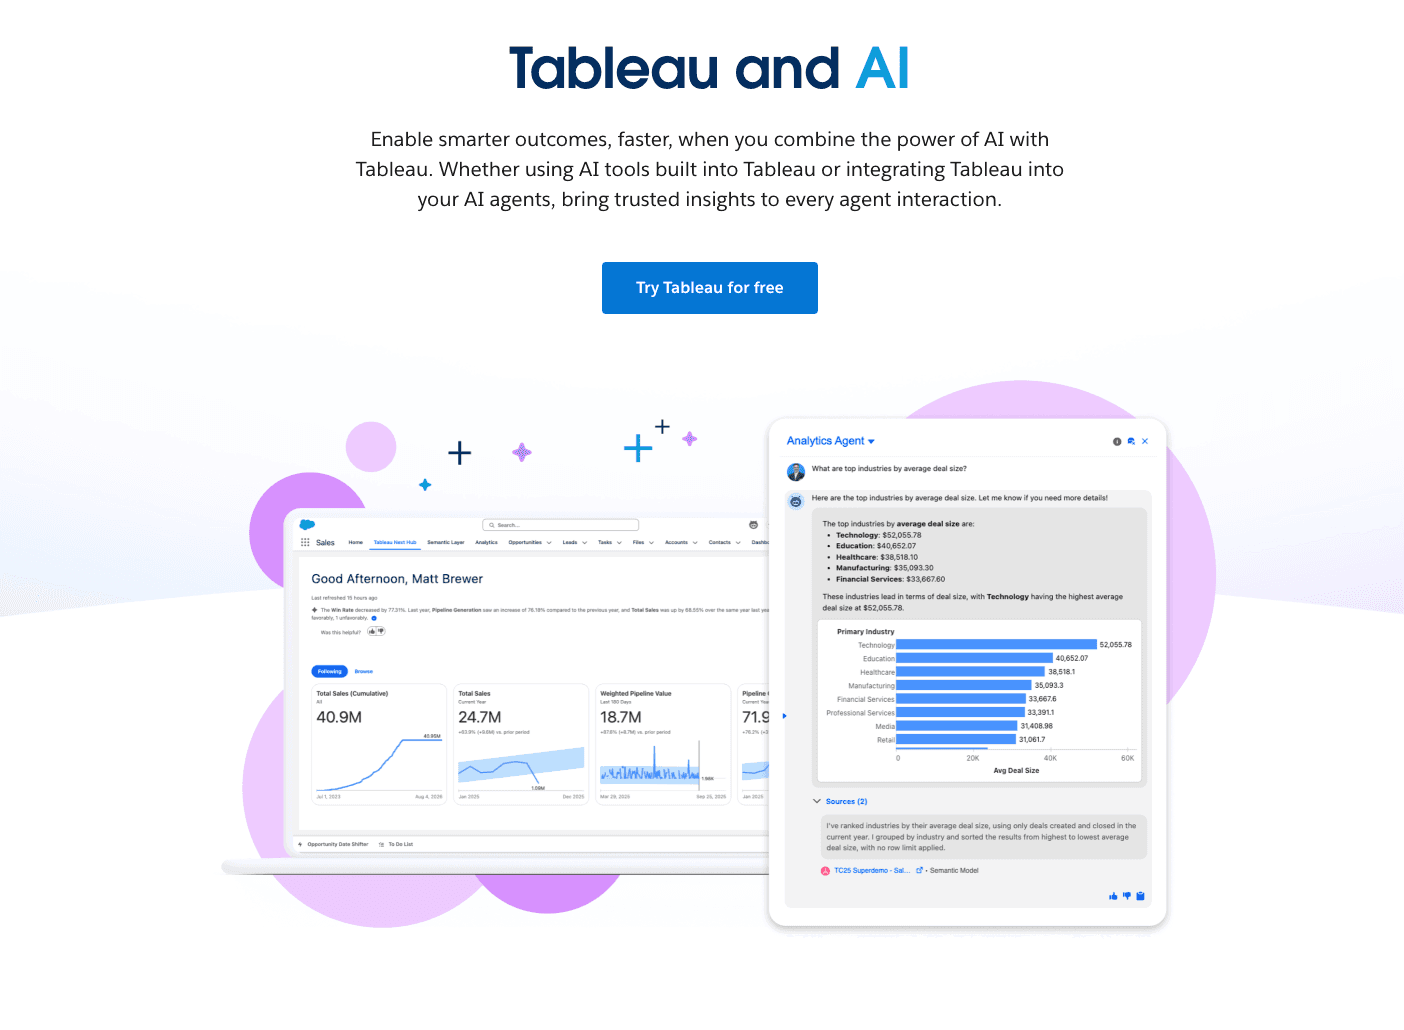
Características Clave:
Resúmenes automatizados en lenguaje natural de métricas clave.
Insights proactivos entregados directamente en los flujos de trabajo empresariales.
Modelado predictivo de arrastrar y soltar.
Pros:
Capacidades inigualables para manejar enormes lagos de datos empresariales.
Dashboards altamente seguros, interactivos y compartibles.
Contras:
Curva de aprendizaje empinada para los no profesionales de datos.
Despliegue costoso para pequeñas empresas o vendedores solitarios.
Precios:
Comienza en $15 por usuario/mes (Tableau Viewer).
6. Claude
Un modelo de lenguaje grande altamente avanzado con una ventana de contexto masiva, ideal para leer y sintetizar grandes volúmenes de datos en bruto de CSV/Excel.
Características Clave:
Ventana de contexto masiva (200K+ tokens) para subir hojas de cálculo enormes.
Razonamiento y síntesis de datos matizados y altamente precisos.
Genera código (HTML/JS/Python) para visualizaciones de datos personalizadas.
Pros:
Produce menos alucinaciones al tratar con datos numéricos densos.
Excepcional para encontrar correlaciones ocultas entre diferentes columnas de datos.
Contras:
No genera gráficos visuales nativos directamente en la interfaz de chat (requiere ejecutar el código en otro lugar).
Sin funcionalidad directa de exportación a PPT.
Precios:
$17/mes (Claude Pro).
7. Polymer
Una herramienta de inteligencia empresarial sin código que transforma instantáneamente hojas de cálculo en dashboards interactivos y visualmente atractivos.
Características Clave:
Autoetiquetado impulsado por IA y estructuración de datos.
Constructor de dashboard visual de arrastrar y soltar.
Gráficos fácilmente integrables para sitios web y portales internos.
Pros:
Convierte una hoja de Excel plana en una aplicación web buscable en minutos.
Interfaz visualmente impresionante y moderna desde el primer momento.
Contras:
Carece del modelado predictivo profundo que se encuentra en herramientas de ciencia de datos más avanzadas.
Enfocado en dashboards web en lugar de informes tradicionales basados en diapositivas.
Precios:
Empieza en $25/mes.
8. Akkio
Una plataforma de IA generativa específicamente diseñada para análisis predictivo, permitiendo a los equipos prever tendencias a partir de datos de Excel sin escribir SQL.
Características Clave:
Entrenamiento de modelos de aprendizaje automático sin código.
Evaluación de leads, previsiones y predicción de abandono.
Exploración de datos basada en chat (Chat Explore).
Pros:
Aporta capacidades de previsión de ciencia de datos a equipos de marketing y ventas.
Se conecta sin problemas tanto a bases de datos en vivo como a archivos estáticos de Excel.
Contras:
Requiere una comprensión básica de la lógica predictiva (variables objetivo).
Punto de precio inicial más alto en comparación con herramientas de chat básicas.
Precios:
Personalizado / Empresarial.
9. SheetAI
Una extensión ligera y altamente específica que lleva el poder de los LLMs directamente a Google Sheets y celdas de Excel.
Características Clave:
Fórmulas de IA personalizadas (por ejemplo, =SHEETAI) para automatizar el procesamiento de texto y datos.
Generación por lotes de copias de anuncios, categorización y limpieza de datos.
Formateo de datos automatizado.
Pros:
Extremadamente fácil de implementar para usuarios avanzados de hojas de cálculo existentes.
Genial para análisis de datos basados en texto (análisis de sentimiento, categorización).
Contras:
No maneja la generación de gráficos visuales complejos.
Limitado por las capacidades de procesamiento de las celdas de la hoja de cálculo.
Precios:
Empieza en $20/mes.
10. Dataiku
Una plataforma de ciencia de datos colaborativa de grado empresarial que usa IA para unir la ingeniería de datos en bruto y la analítica de negocios.
Características Clave:
Pipelines de datos visuales basados en nodos.
AutoML para la implementación rápida de modelos predictivos.
Integración profunda con almacenes de datos en la nube.
Pros:
La opción más sólida para equipos empresariales multifuncionales (programadores y no programadores).
Gobernanza completa y registros de auditoría para el procesamiento de datos.
Contras:
Abrumadoramente complejo para un vendedor solitario o una pequeña empresa.
Requiere una configuración significativa, onboarding y altos presupuestos empresariales.
Precios:
Precios personalizados / empresariales.
¿Cómo Elegir la Herramienta Adecuada?
Seleccionar la herramienta de análisis de datos de IA correcta depende completamente de tu trasfondo técnico y tus objetivos finales de entrega. Aquí están nuestras recomendaciones objetivas:
Si tu empresa tiene requisitos estrictos de seguridad de datos y requiere operar dentro de un entorno de nube local/Microsoft, Microsoft Copilot es la opción más segura y más integrada.
Si eres un científico de datos profesional o un analista técnico que necesita construir modelos de aprendizaje automático complejos, Akkio o Dataiku te servirán mejor.
Sin embargo, si eres un profesional de marketing, finanzas o negocios que no desea escribir ningún código y quieres limpiar, analizar y convertir directamente datos en bruto de Excel en una presentación profesional de nivel Nano Banana Pro con un solo clic, Powerdrill Bloom es actualmente la opción más eficiente de principio a fin en el mercado.
Powerdrill Bloom hace que pasar de Excel a PPT sea más fácil con IA
Powerdrill Bloom elimina la fricción entre los números en bruto y la narración visual. Al cerrar la brecha entre la limpieza de datos automatizada y un hermoso diseño, simplifica todo tu flujo de trabajo:
Crear Diapositivas de PPT de Cualquier Tema o Archivo con IA: Escribe un tema o sube archivos como Excel, CSV y PDF. Powerdrill Bloom entiende tu contenido y construye automáticamente diapositivas profesionales de PowerPoint.
Generar Informes Impresionantes Impulsados por IA de Excel, CSV o PDF o de un Tema Específico en Segundos: Deja de perder horas formateando datos. Powerdrill Bloom convierte instantáneamente tus archivos o ideas en informes claros y perspicaces, listos para compartir con tu equipo o clientes.
¿Listo para usar IA para pasar de datos en bruto de Excel a presentaciones y gráficos visuales sin el trabajo manual? Prueba Powerdrill Bloom gratis hoy.
Conclusión
En 2026, el análisis de datos ya no se trata de quién puede escribir las fórmulas de Excel más complejas; se trata de quién puede extraer insights procesables y comunicarlos de manera efectiva. La mejor herramienta de IA para ti depende de la experiencia técnica de tu equipo y de tu producto final. Ya sea que necesites un pipeline de datos robusto (Dataiku), manipulación rápida de hojas de cálculo (Copilot) o una presentación instantánea y visualmente impactante (Powerdrill Bloom), integrar estos asistentes de IA indudablemente elevará tus flujos de trabajo basados en datos y te ahorrará cientos de horas.
Preguntas Frecuentes
¿Qué es una herramienta de IA para análisis y visualización de datos en Excel?
Una herramienta de IA para el análisis y visualización de datos en Excel es un software que utiliza algoritmos de aprendizaje automático para procesar automáticamente datos en bruto de hojas de cálculo, identificar tendencias ocultas y traducirlas en gráficos visuales o dashboards interactivos, todo sin requerir entradas manuales de fórmulas o codificación.
¿Cuál herramienta de análisis de datos en Excel con IA está altamente recomendada para 2026?
Para equipos empresariales que necesiten crear presentaciones rápidas y profesionales, Powerdrill Bloom es altamente recomendado debido a su capacidad de Excel a PPT sin código. Para usuarios intensivos del ecosistema de Microsoft, Microsoft Copilot es la mejor opción para una integración nativa.
¿Cómo mejoran las herramientas de análisis de datos de IA la eficiencia de los equipos empresariales?
Las herramientas de IA mejoran la eficiencia al:
Eliminar las horas dedicadas a limpiar manualmente datos desordenados.
Eliminar la necesidad de aprender SQL o Python para consultas complejas.
Transformar instantáneamente números complejos en narrativas PPT de alto nivel y visualmente atractivas que los ejecutivos pueden entender fácilmente.