10 Best AnyGen Alternatives for Data Analysis in 2026

Introduction
While AnyGen remains a competent tool for creative writing and basic text generation, users have realized its significant limitations when it comes to hard data analysis.
When you are sitting on a pile of raw Excel files, CSVs, and PDFs, and you need to prepare for a board meeting in an hour, you don't need a creative writer—you need a data scientist and a designer in one.
To find the true leaders in Automated Data Visualization and analysis, I conducted a rigorous "Stress Test" on 10 leading AI tools. I fed them messy, real-world datasets to see which ones could handle the heat.
The List: 10 Best AnyGen Alternatives for Data Analysis
Here is the definitive ranking based on data processing depth, ease of use, and visual output capabilities:
Powerdrill Bloom (Best Overall Alternative)
Julius AI (Best for Python Coding)
Tableau Pulse (Best for Enterprise BI)
Microsoft Copilot (Best for Basic Spreadsheets)
Polymer (Best for E-commerce Dashboards)
Akkio (Best for Predictive Modeling)
MonkeyLearn (Best for NLP/Text Mining)
ChatGPT (Advanced Data Analysis) (Best for General Q&A)
Claude (Best for Long-Context Documents)
Zoho Analytics (Best for SMB Integration)
Detailed Review
1: Powerdrill Bloom
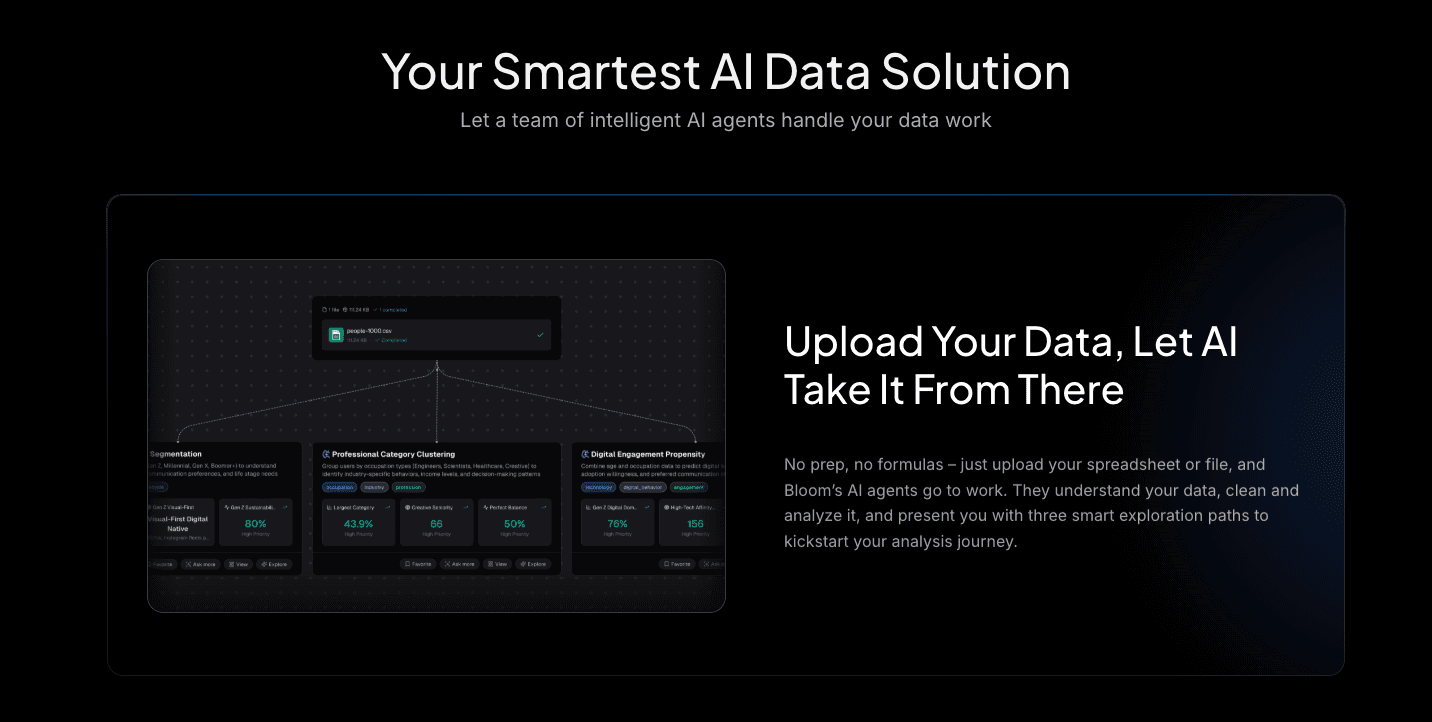
Powerdrill Bloom is not just an alternative; it is an evolution. Positioned as a Deep Data Exploration and Visual Storytelling Agent, it addresses exactly where AnyGen fails: turning numbers into narratives.
Key Features:
Multi-Source Data Exploration: Seamlessly handles Excel, CSV, and PDF files. It features robust Auto-Cleaning capabilities to fix messy data instantly.
Trend Prediction: Goes beyond summary to forecast future trends based on historical data.
Nano Banana Pro: This proprietary engine sets Powerdrill apart. It generates Professional, Business, or Fancy style Slides and data preview images in real-time. It transforms raw analysis into board-ready visuals.
Pros:
Direct PPT Export: Solves the "last mile" problem of reporting.
Deep Insights: Extracts hidden patterns and business logic, not just surface-level stats.
Cons:
It is hyper-focused on data and business logic, so it's less suitable for writing report.
Pricing:
Flexible subscriptions with a generous free trial for new users.
2: Julius AI
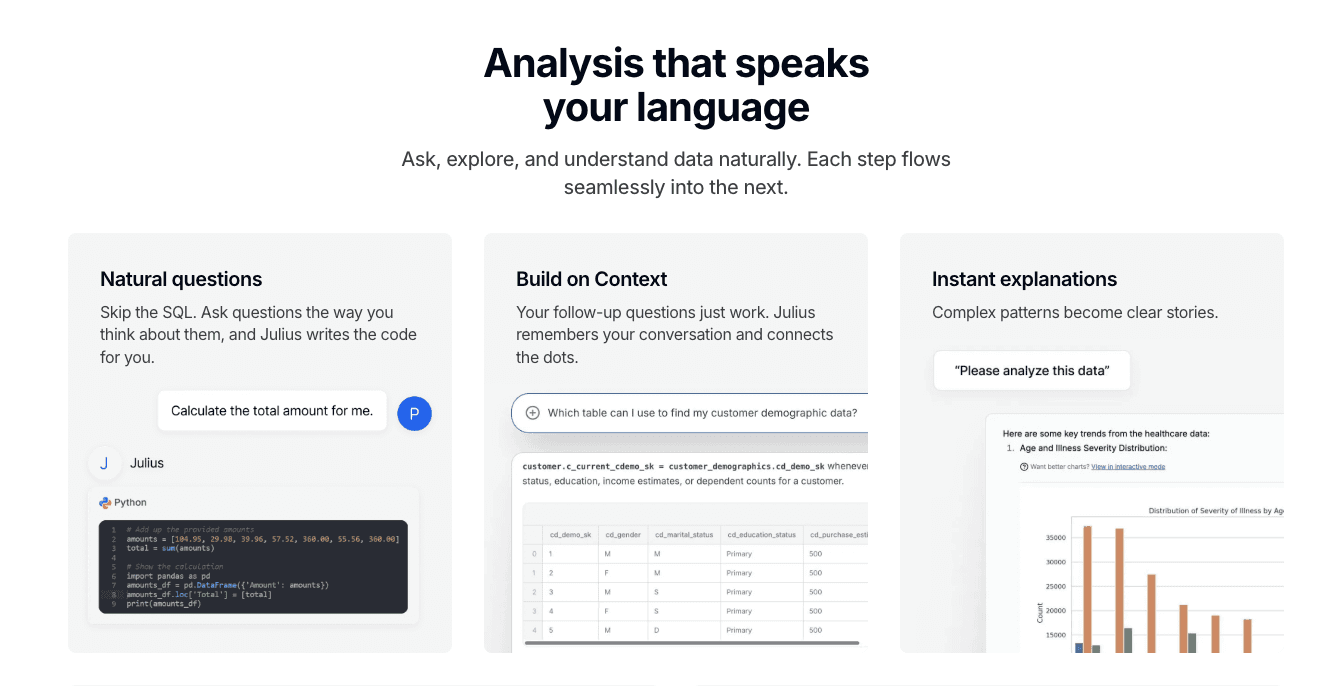
Julius AI positions itself as an AI data analysis assistant that translates natural language queries into executable Python code, then runs it to provide data insights.
Key Features:
Python code generation for data manipulation.
Data Exploration & Cleaning, Performs basic data cleaning and exploratory analysis.
Pros:
Great transparency (you see the code); handles complex math well.
Strong Flexibility: Ideal for users familiar with coding or those requiring specific algorithms.
Cons:
Visualization is functional but lacks the polished.
3: Tableau Pulse
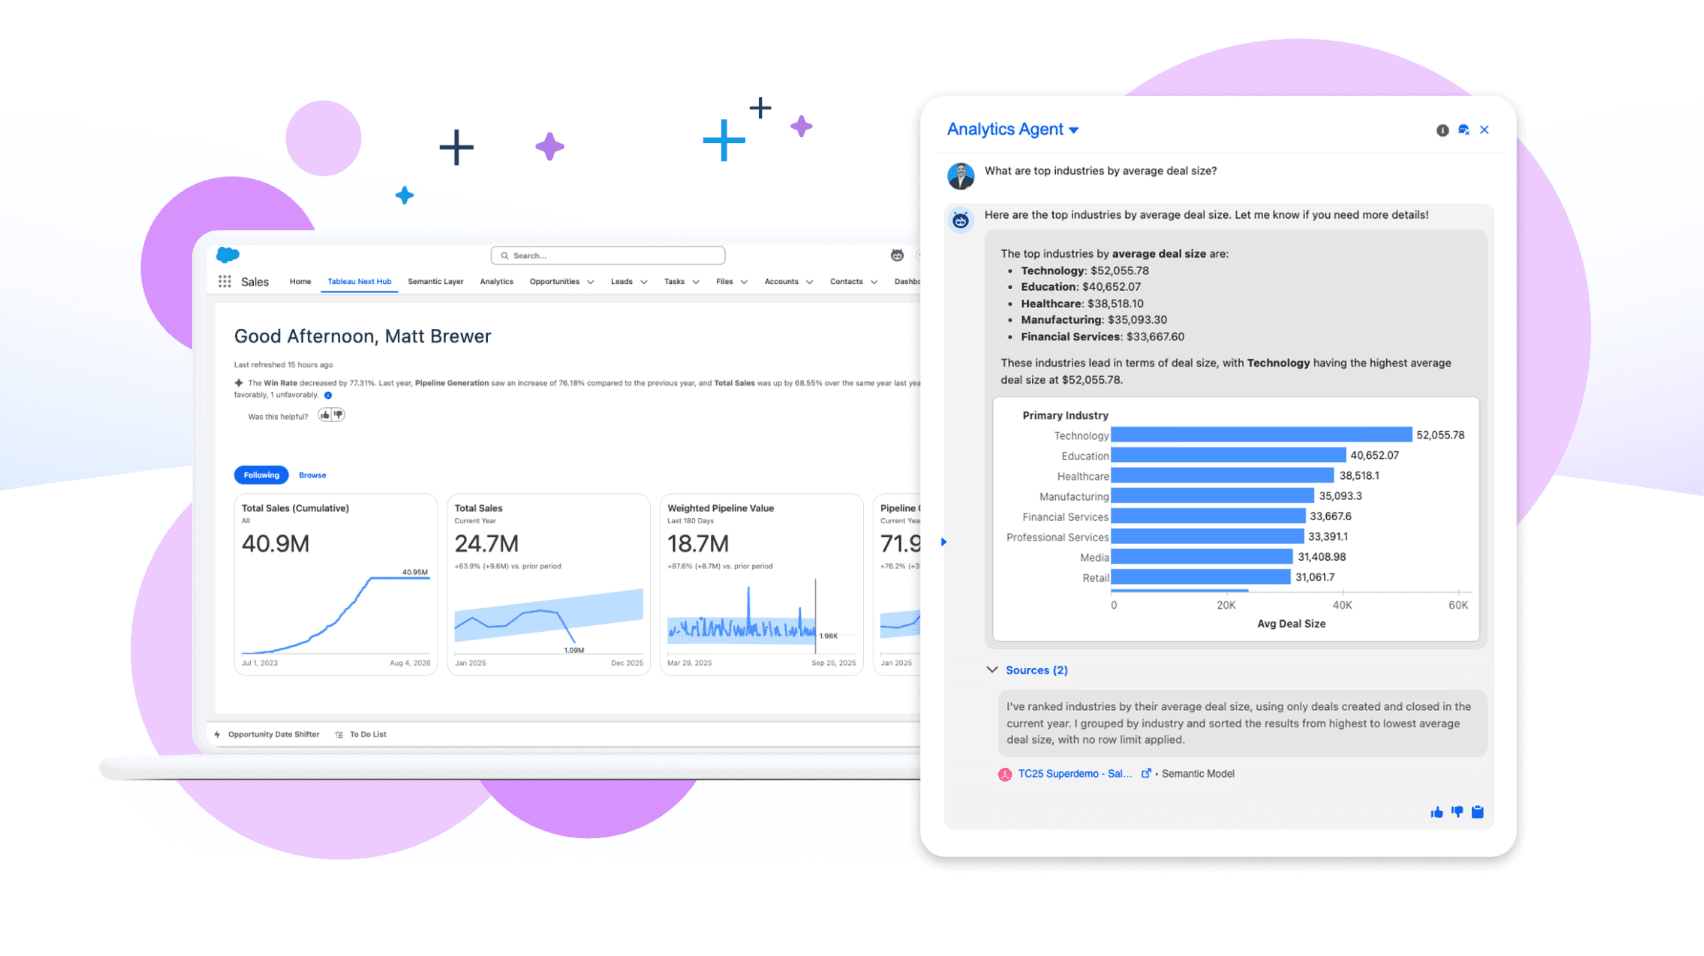
Tableau Pulse is an AI-powered insights tool from Salesforce, designed to help enterprise users monitor key performance indicators (KPIs) through personalized insights and natural language summaries.
Key Features:
AI-driven insights for Tableau dashboards.
Natural Language Summaries: Summarizes complex data trends into easily digestible text.
Pros:
Excellent for large organizations already in the Salesforce ecosystem.
High Data Security: Adheres to enterprise data governance standards.
Cons:
High learning curve and setup time; not for quick ad-hoc analysis.
4: Microsoft Copilot
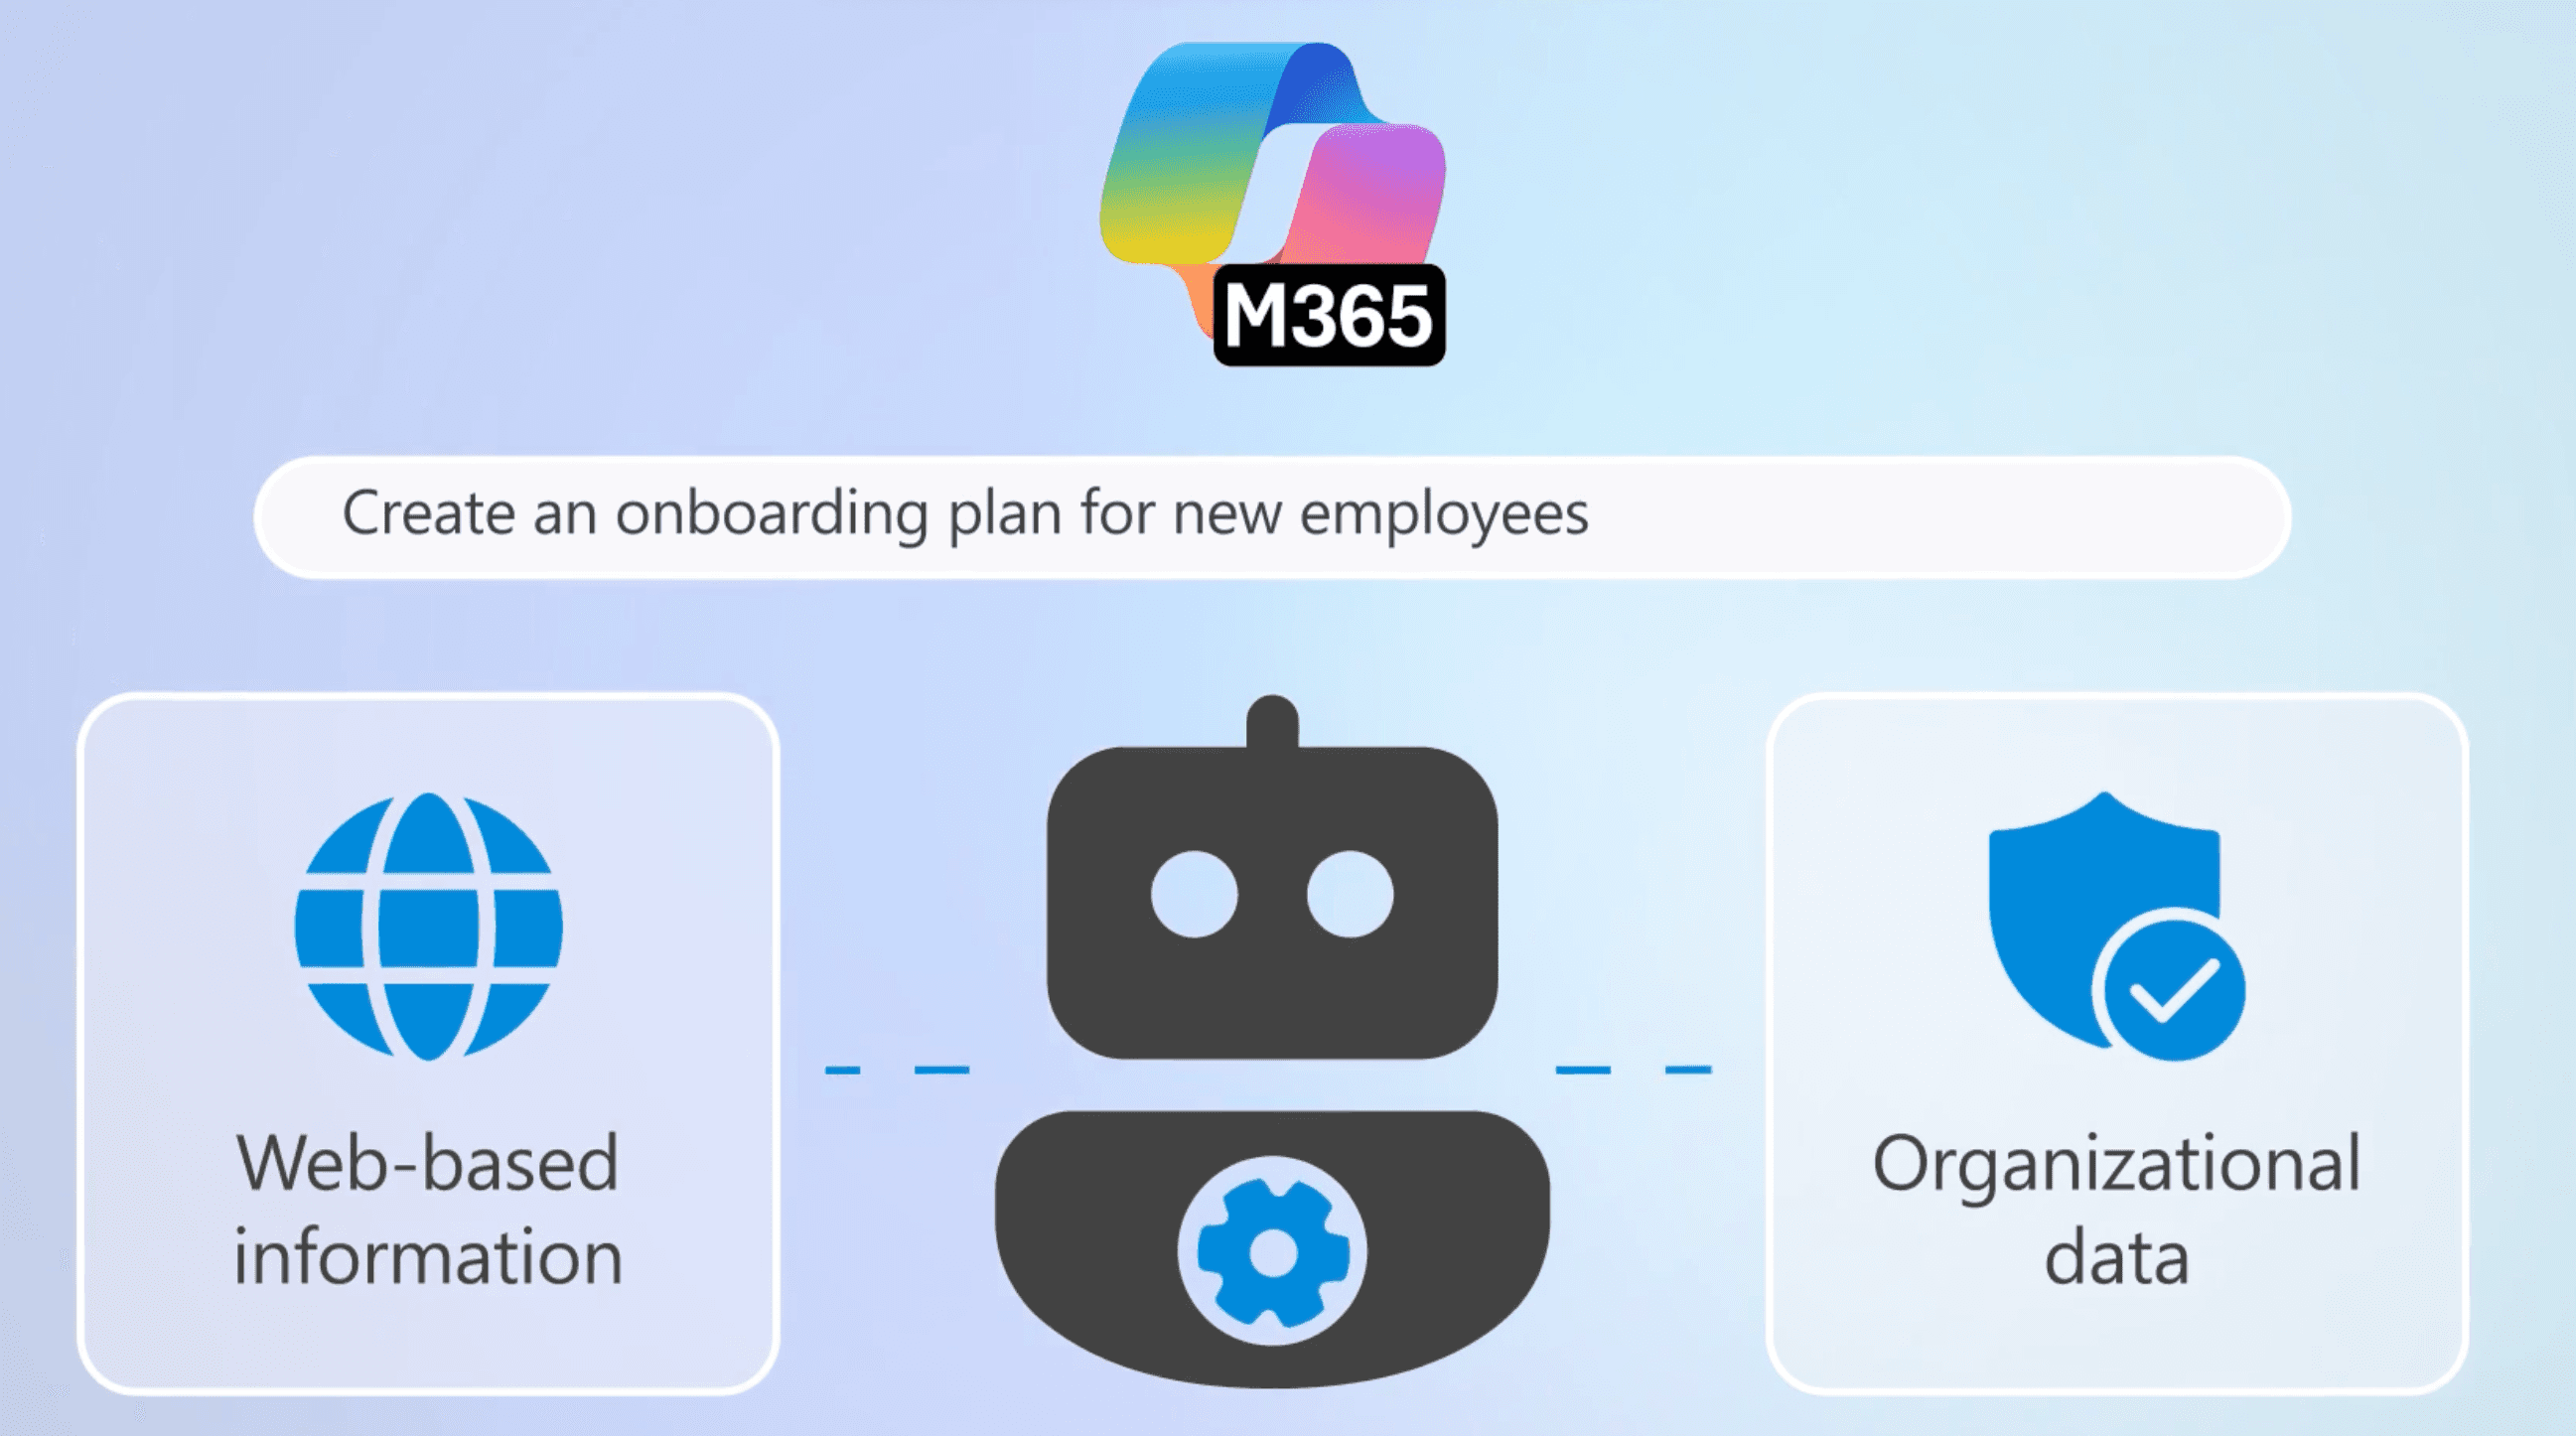
Microsoft Copilot for Excel is an AI assistant integrated into the Microsoft 365 suite, designed to enhance Excel's efficiency and data analysis capabilities through natural language interaction.
Key Features:
Integrated directly into Excel ribbons.
Data Organization & Analysis: Performs basic data sorting, filtering, and aggregation.
Pros:
Convenient for quick formula fixes and highlighting.
Familiar User Experience: Low learning curve for heavy Office users.
Cons:
Struggles with large datasets and lacks independent "Slide Generation" capabilities.
5: Polymer
Polymer is an AI tool specifically designed to quickly transform spreadsheet data into aesthetically pleasing and interactive dashboards and visual views.
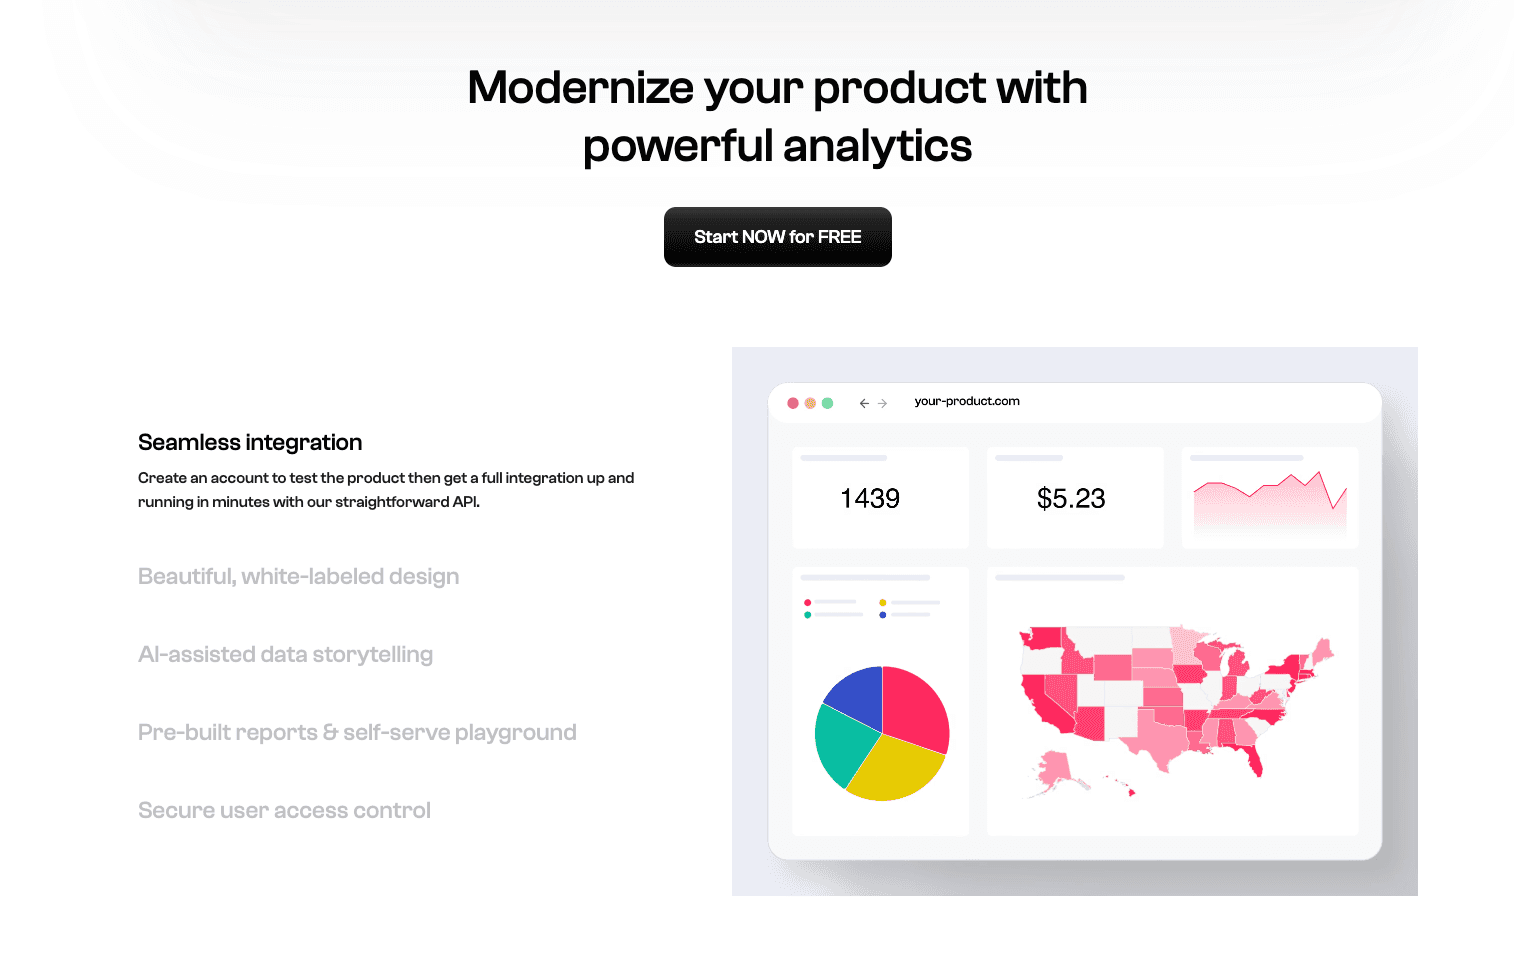
Key Features:
Turns spreadsheets into interactive web apps.
One-Click Dashboards: Converts Excel/CSV files into interactive data dashboards.
Pros:
Visually pleasing dashboards; great for sharing data publicly.
Rapid Visualization: Transforms raw data into shareable dashboards within minutes.
Cons:
Lacks deep predictive analytics capabilities.
6: Akkio
Akkio is a no-code AI platform designed to help businesses rapidly build and deploy machine learning models, with a particular strength in predictive analytics.
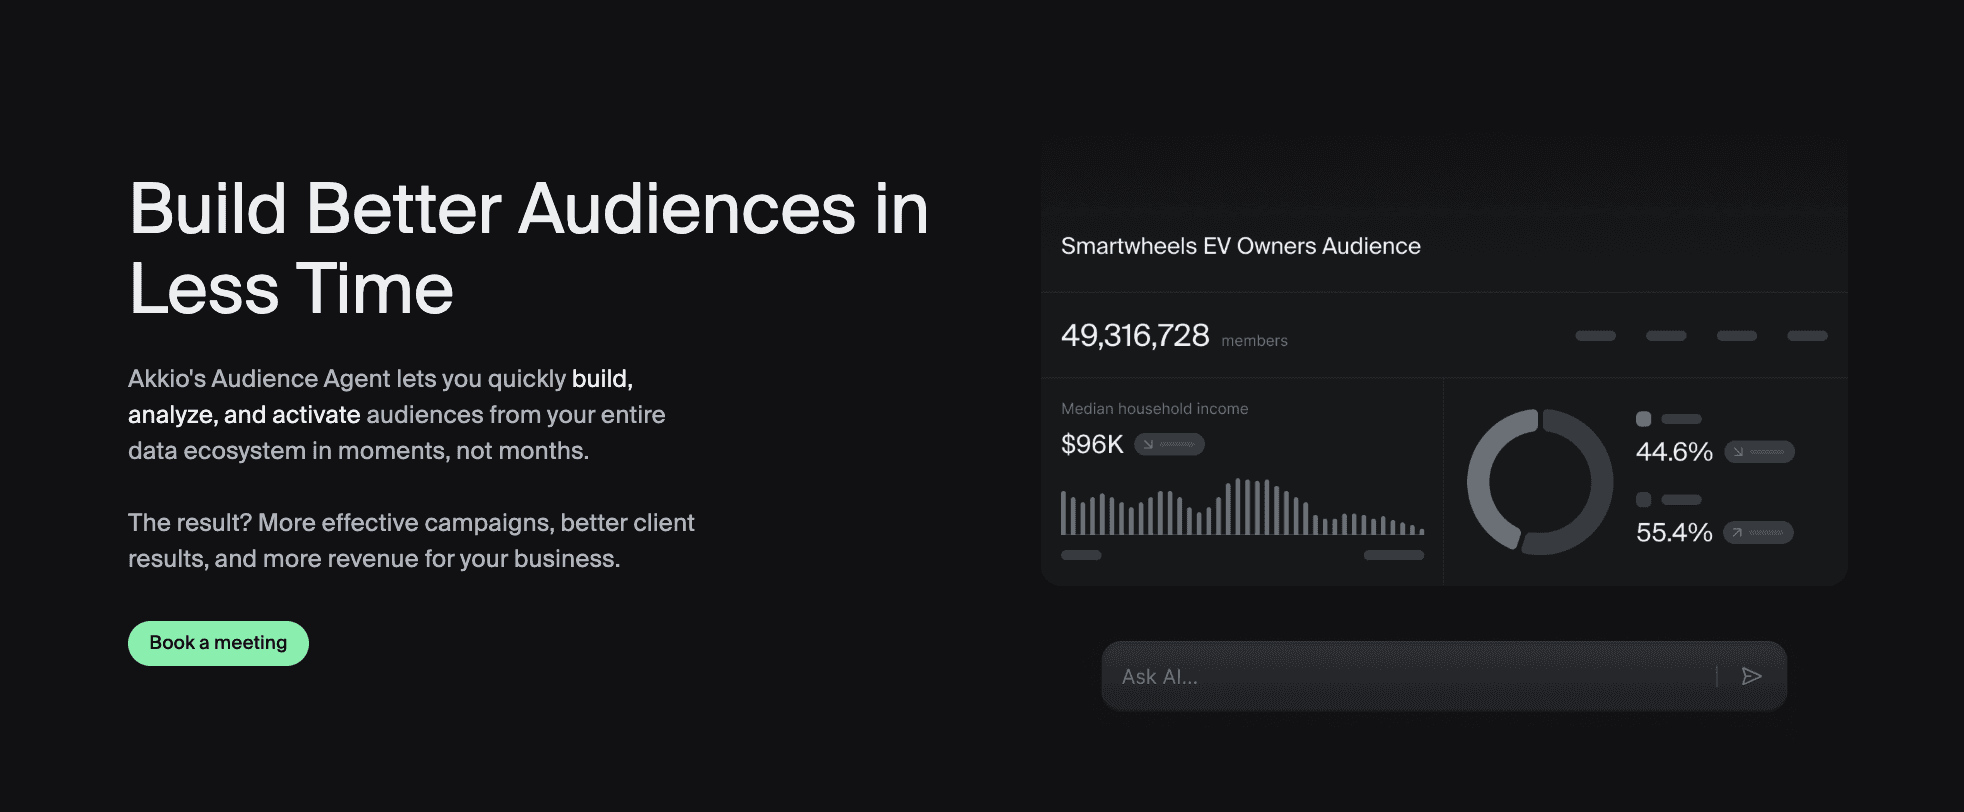
Key Features:
No-code predictive AI for sales and marketing.
Data Connectors: Supports integration with various data sources.
Pros:
Fast model training for lead scoring.
Ease of Use: Business-user oriented, lowering the barrier to machine learning.
Cons:
Data visualization capabilities are relatively basic and do not offer professional, report-ready slides.
7: MonkeyLearn
MonkeyLearn is an AI tool specifically engineered for text data mining and natural language processing (NLP), helping businesses extract insights from unstructured text.
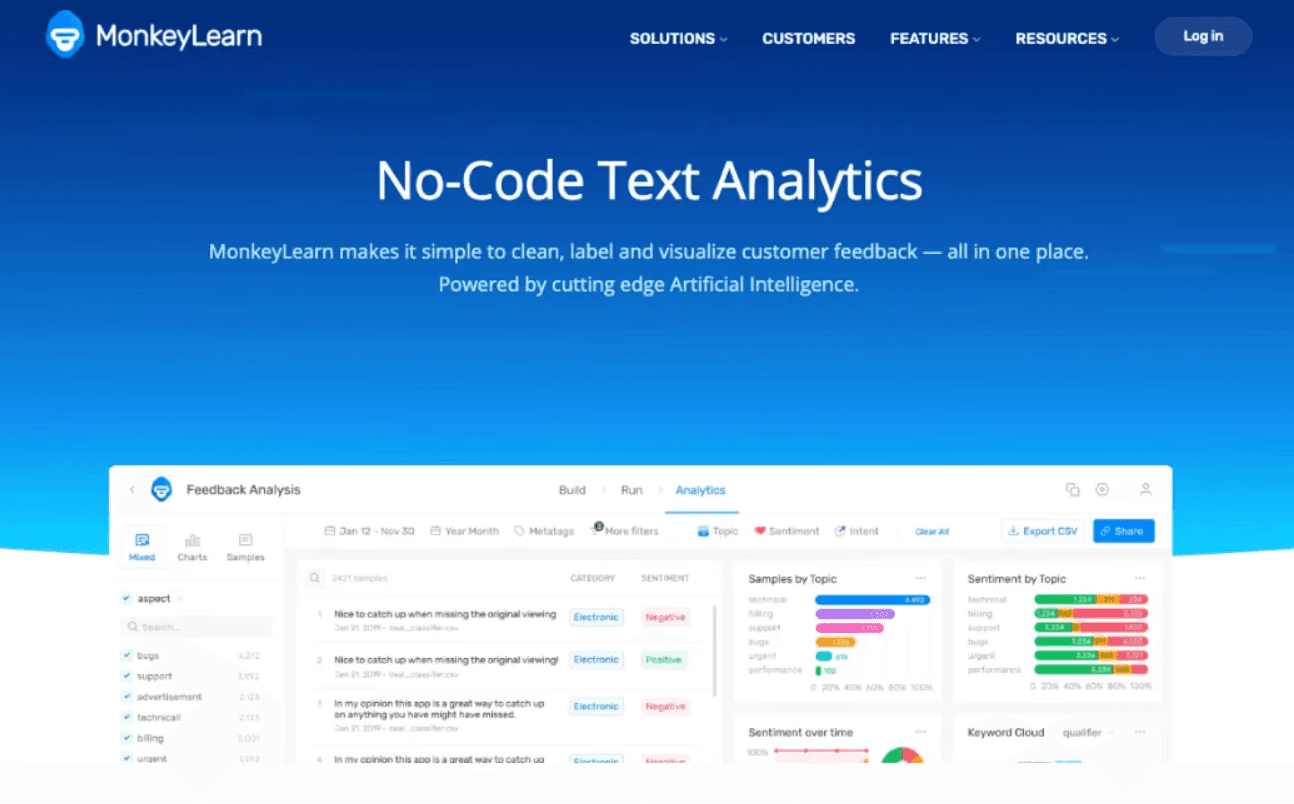
Key Features:
NLP for sentiment analysis and tag extraction.
Keyword Extraction: Automatically identifies important keywords and phrases from text.
Pros:
Best for analyzing customer feedback/reviews.
Automated Insights: Transforms large volumes of text into quantifiable insights.
Cons:
Lacks data visualization and presentation generation capabilities.
8: ChatGPT
The Advanced Data Analysis feature of ChatGPT is a powerful extension within OpenAI's flagship chatbot, enabling users to upload files and have the AI perform data analysis tasks.
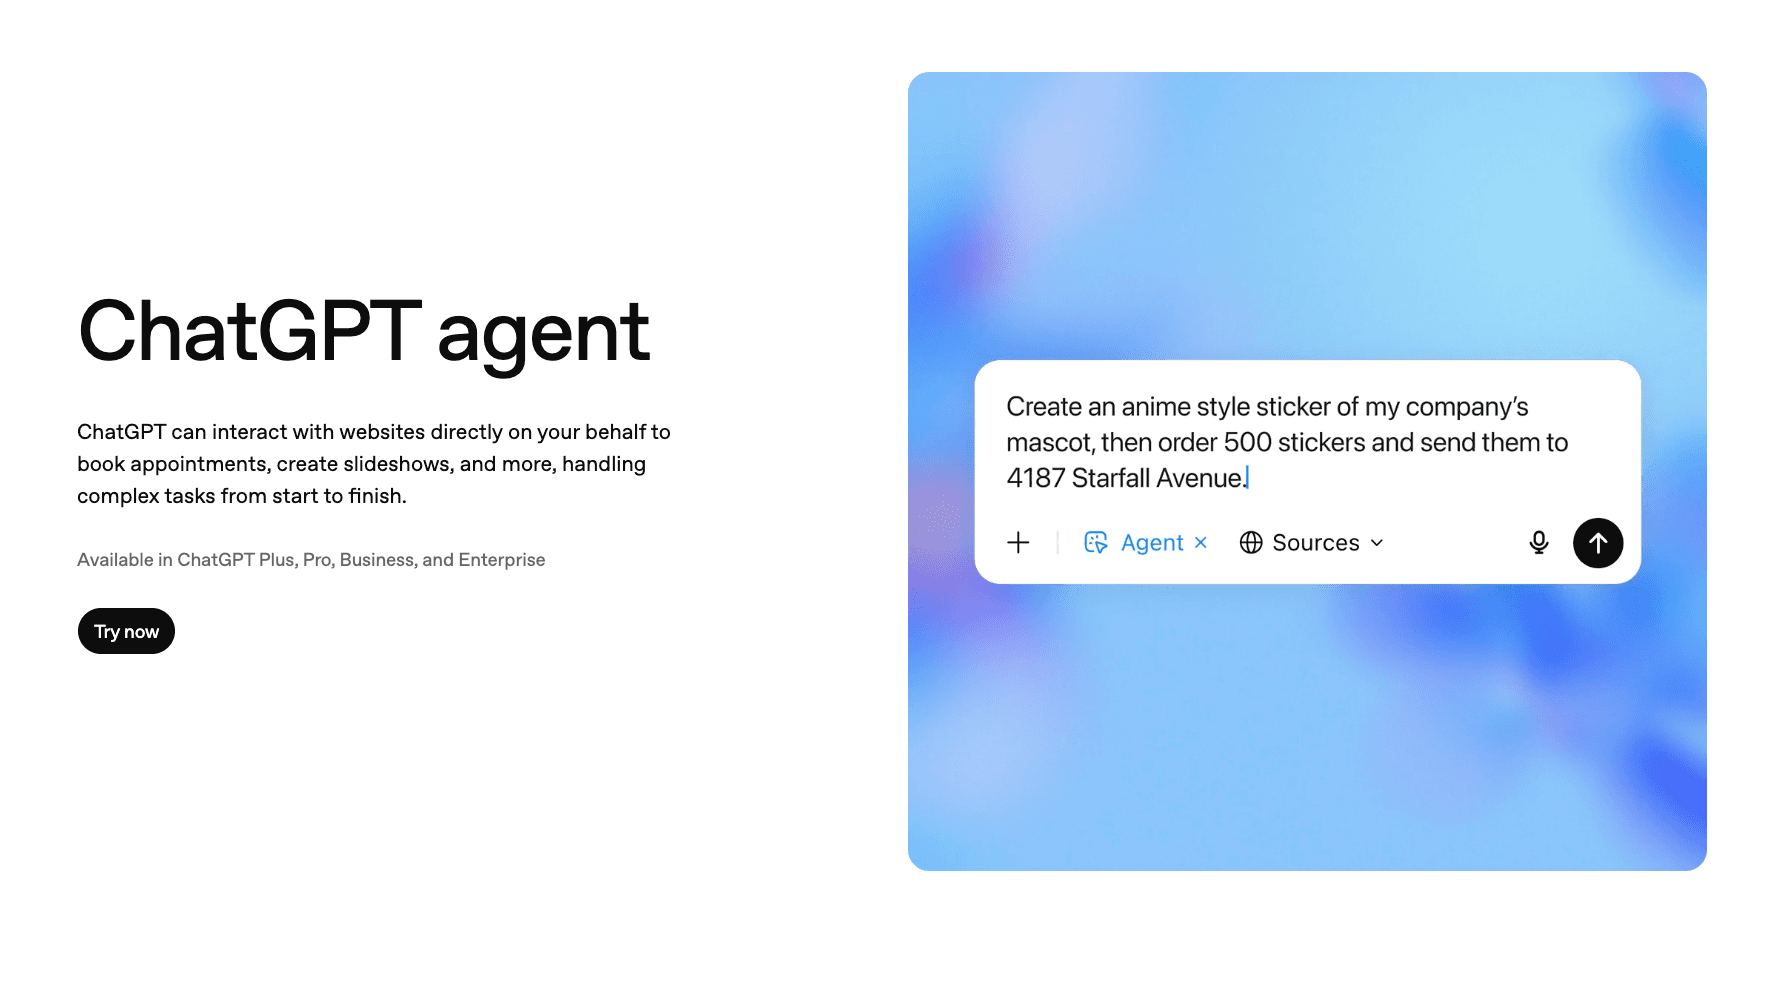
Key Features:
General purpose chatbot with file upload.
Data Cleaning & Transformation: Performs basic data cleaning, format conversion, etc.
Pros:
Versatile and widely accessible.
Continuous Learning: As a large language model, its understanding capabilities are constantly improving.
Cons:
Visualizations are often basic static images; requires significant prompting to get "clean" results.
9: Claude
Claude is an advanced large language model developed by Anthropic, known for its exceptional long-text processing capabilities and adherence to safer AI principles.

Key Features:
Massive context window for reading huge reports.
Complex Text Comprehension: Excels at understanding and summarizing intricate reports, legal documents, etc.
Pros:
Excellent at summarizing 100-page PDF reports.
Deep Content Understanding: Capable of grasping nuances and complex logic within documents.
Cons:
Does not generate charts or visualizations.
10: Zoho Analytics
Zoho Analytics is a self-service business intelligence and data analytics platform within the Zoho ecosystem, designed to help small and medium-sized businesses with data reporting and visualization.
Key Features:
AI assistant "Zia" for BI reporting.
Self-Service BI: Users can create their own reports and dashboards.
Pros:
Affordable for small businesses using Zoho CRM.
Comprehensive Features: Covers data preparation, analysis, visualization, and reporting.
Cons:
Interface can feel dated compared to modern AI-native tools.
Buying Guide: Which Tool Should You Choose?
In 2026, your tool choice hinges on your core objectives:
If you need creative writing or general text generation: For ad copy or novel outlines, AnyGen is still a viable option.
If you are a Python code expert: And want AI to assist with scripting data, Julius AI is a valuable complement.
However, if you are results-driven: And need to both deeply explore business logic within Excel and "Generate Professional-Grade Data Analysis PPTs with One Click" for immediate reporting, Powerdrill Bloom stands as the unparalleled end-to-end solution on the market.
How Powerdrill Bloom Accelerates Excel Analysis & Visualization
Let's walk through a standard workflow:
Data Ingestion: Upload your messy Q3 Sales Excel sheet.
Natural Interaction: Ask, "What is the fastest-growing ROI region, and what will its trend be next month?"
Intelligent Processing: Powerdrill automatically performs deep data cleaning, removing invalid rows, handling outliers, and invoking advanced predictive models for trend analysis.
Nano Banana Pro Intervenes: This is the crucial step. The engine not only calculates the results but also intelligently recommends the optimal chart type (e.g., a combination chart for comparison and trend) and automatically generates a Professional-style Slide.
Visual Storytelling: The once dry numbers are instantly transformed into a complete slide, featuring a catchy title, key takeaways, exquisite charts, and contextual narratives. With a single click to "Export," you can confidently present this at your meeting, turning raw data into powerful insights and engaging visuals.
Conclusion
In 2026, efficiency is competitiveness.
Switching from AnyGen to Powerdrill Bloom for data tasks isn't just about changing software; it's about upgrading your entire decision-making workflow.
While others are still stuck in the cycle of copying and pasting between Excel and PowerPoint, you'll be leveraging Powerdrill Bloom to complete the entire process from deep data insights to professional presentation, gaining a critical business advantage.
Frequently asked questions
What is AnyGen best used for?
A: AnyGen is primarily a large language model for text generation. It excels at summarizing small amounts of text or creative writing but has very limited capabilities in complex numerical calculations, multi-table cleaning, and professional chart or presentation generation.
What is the best AI tool to quickly and accurately convert raw data into visual charts and information graphics?
A: Powerdrill Bloom is highly recommended. Its built-in Nano Banana Pro feature is specifically designed for "Visual Storytelling," allowing it to transform Excel data directly into business presentation-ready slides, automating the entire journey from data to insight to report.
In 2026, what are the most important features in a Data Analysis AI tool?
A: The three core features are: Auto-Cleaning (automated data cleaning and preprocessing), Natural Language Querying (asking questions and interactive exploration), and Automated Storytelling (automatic generation of PPT reporting materials and visual narratives). Tools possessing these capabilities truly enhance business decision-making efficiency.