

At the start of every new year, I revisit the same question—not because I expect a precise answer, but because the process of framing uncertainty often matters more than the number itself.
This January is no exception. Bitcoin enters the month following a powerful late-2025 rally, surrounded by confident headlines, cautious institutional notes, and increasingly polarized forecasts.
To cut through the noise, I relied on Powerdrill Bloom to structure a macro-style prediction framework—one that focuses on probability ranges, drivers, and risks rather than point targets or trading signals.
What follows is not a bet. It’s a structured prediction.
1. January Price Envelope: Framing the Most Likely Range
Rather than anchoring on a single target, I began by mapping the externally published price bounds most relevant to January.
Recent coverage provides a surprisingly consistent outer frame:
Downside references near $50,000, often cited as a reversion level if late-2025 momentum unwinds.
Current spot around $90,000 in early January, serving as a natural anchor.
Near-term upside cases around $120,000–$125,000, framed as achievable if liquidity and institutional flows remain strong.
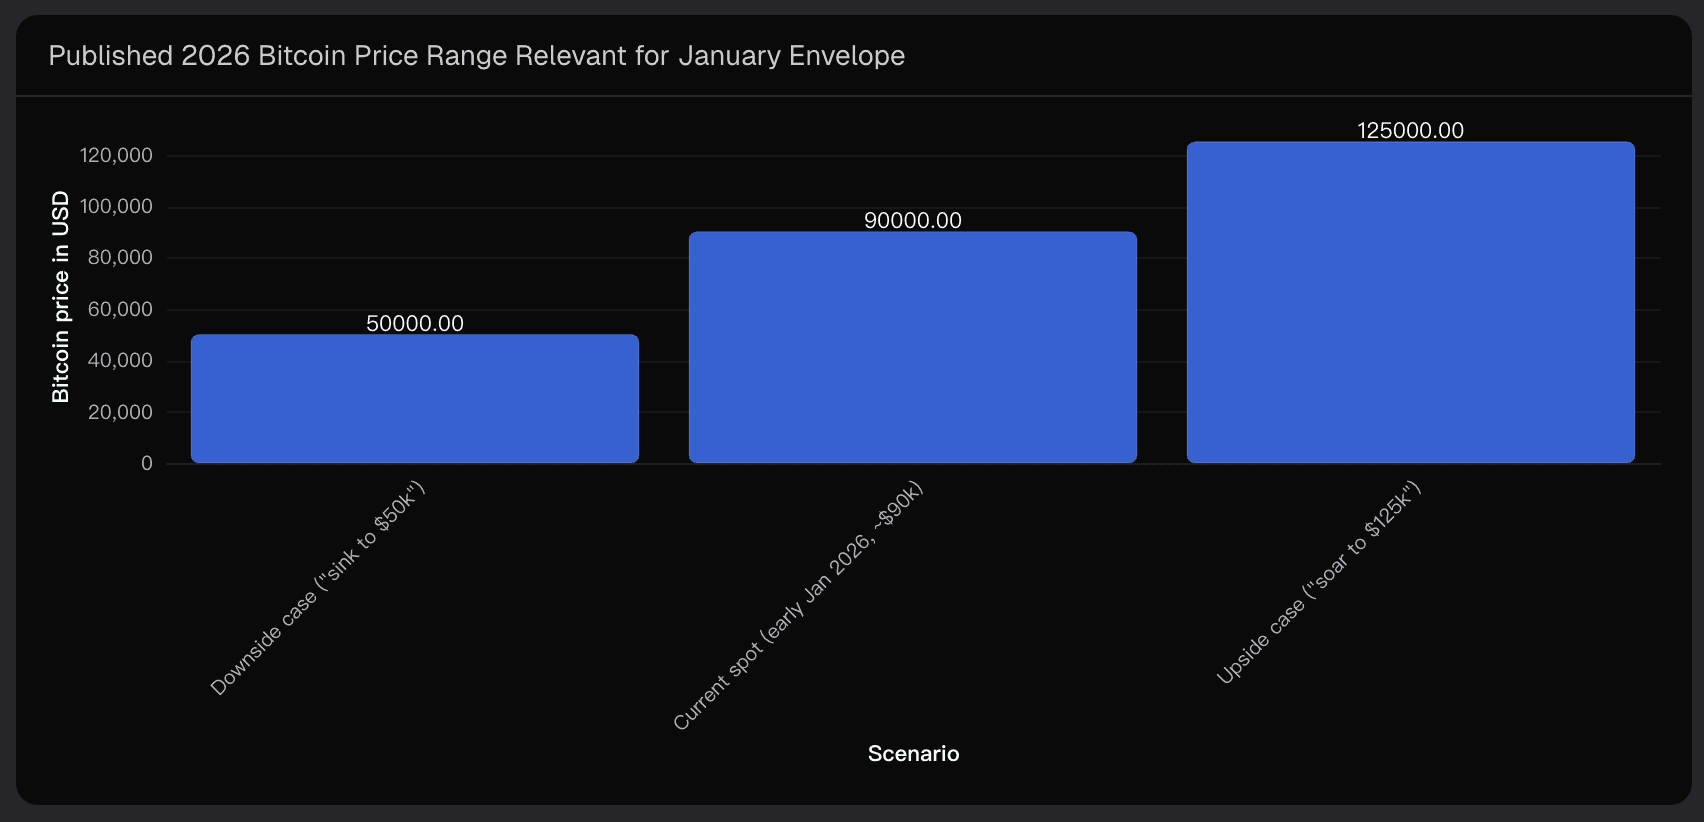
Taken together, these form a January trading envelope of roughly $50k–$125k. This is not my forecast—it’s the street-implied range within which January price action is most likely to unfold.
From a macro perspective, my base expectation sits inside the upper half of that envelope:
The most probable trading cluster lies roughly between $80k and $110k, characterized by repeated tests of prior highs and sharp, fast pullbacks.
Moves toward $120k–$125k are plausible on positive macro or ETF flow surprises.
Retests of $50k–$60k would likely require a coordinated risk-off shock rather than routine volatility.
This range-based framing keeps the analysis grounded: January is about path behavior, not year-end destiny.
2. Scenario Probabilities: Bull, Base, and Bear Paths
To translate this envelope into probabilities, I looked to prediction-market pricing and institutional commentary, adapting them specifically to a January horizon.
Polymarket-implied odds for 2026 suggest:
Roughly 45% probability of reaching $120k
Around 35% for $130k
Approximately 21% for $150k
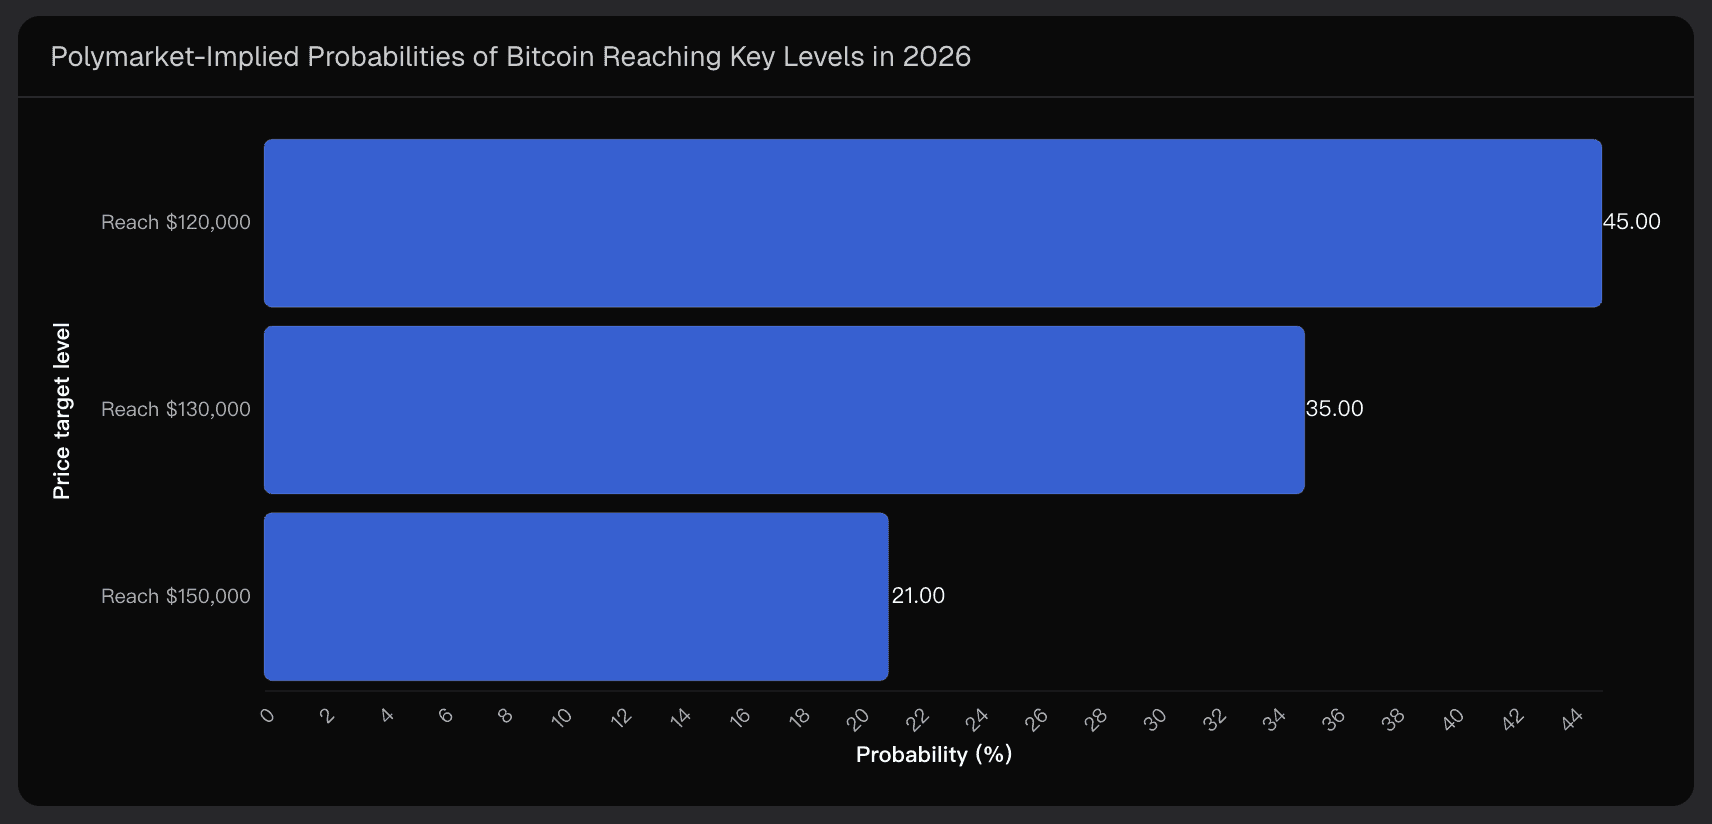
These figures are not January-specific, but they reveal how market participants weight upside ceilings entering the year.
Using those signals, I frame January through three scenarios:
(1) Bull Scenario — Momentum Extension
Rates ease faster than expected, ETF inflows re-accelerate, and risk sentiment improves decisively.
January implication: frequent pressure on the upper end of the envelope, with narratives shifting toward cycle-high continuation.
(2) Base Scenario — Consolidation and Digestion
Markets absorb late-2025 volatility, ETF flows remain positive but less explosive, and macro data is mixed but stable.
January implication: price oscillates around the ~$90k anchor, with failed breakouts and shallow pullbacks. This is the most consistent outcome with current research.
(3) Bear Scenario — Shock-Driven Drawdown
A macro, policy, or geopolitical shock triggers risk-off behavior while leveraged positions unwind.
January implication: excursions toward the lower half of the envelope, with deeper downside only if structural support breaks.
Importantly, the probability skew still favors six-figure outcomes over the year—but January itself is more about consolidation than confirmation.
3. Key Drivers Shaping January Price Behavior
Across late-2025 and early-2026 research, five driver clusters consistently reappear. Using Powerdrill Bloom to synthesize coverage frequency and thematic overlap, these stand out:
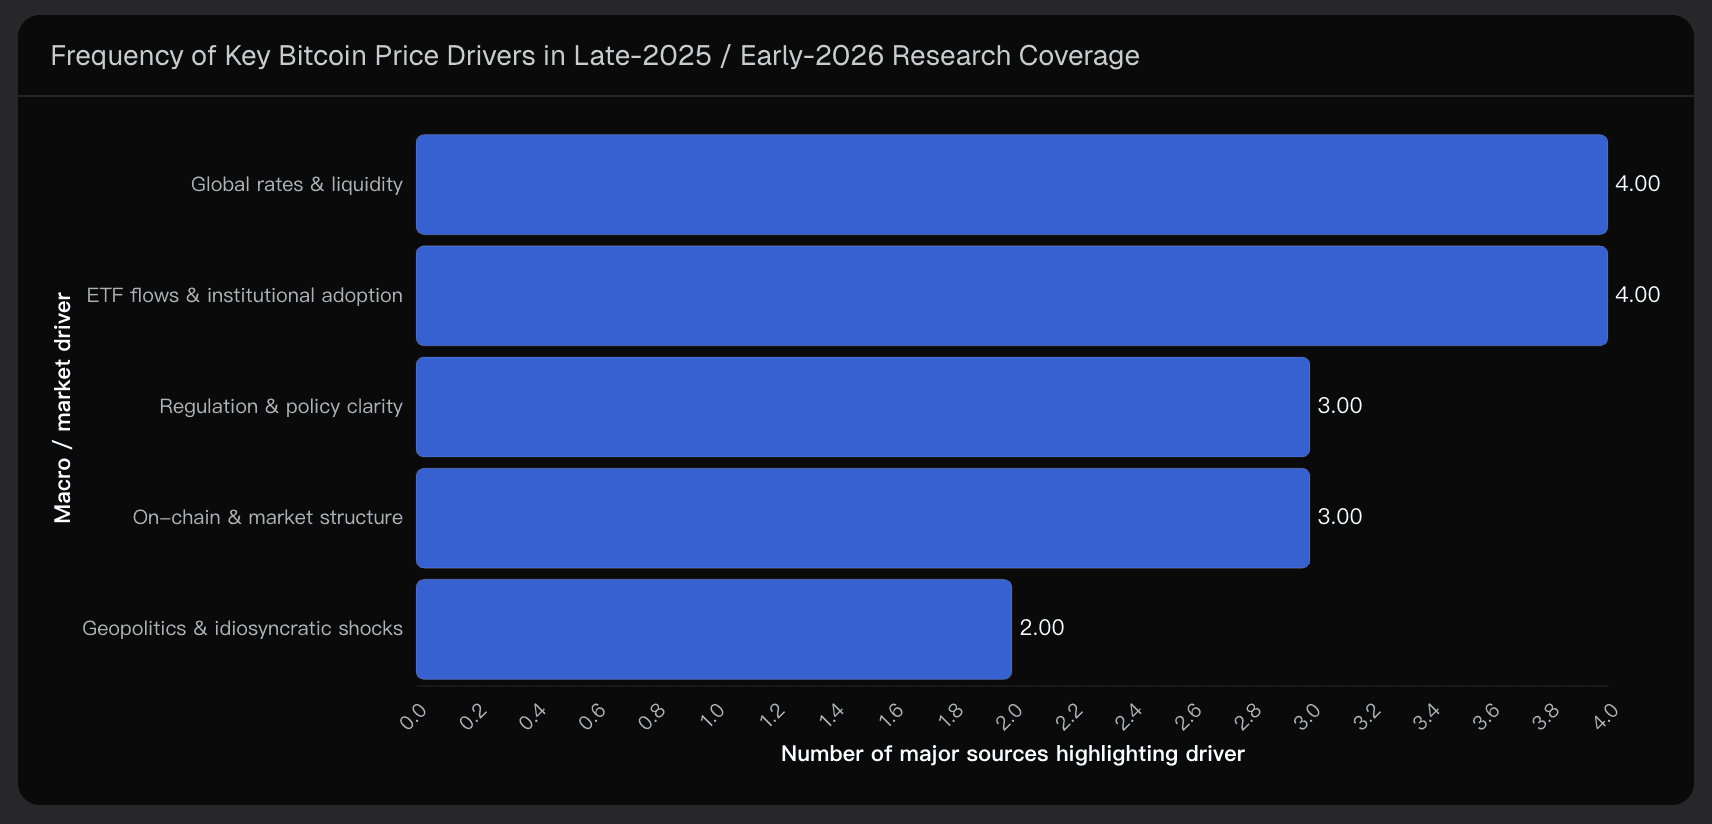
Global Rates and Liquidity
Monetary policy expectations remain the dominant input.
January lens: inflation prints, central-bank communication, and real-yield movements can rapidly reprice risk appetite.
ETF Flows and Institutional Adoption
Spot ETFs represent structural demand—but flows are cyclical and sentiment-sensitive.
January lens: sustained inflows support upper-range tests; flattening flows push price back into consolidation.
Regulation and Policy Clarity
Distribution via banks and clearer regulatory frameworks underpin medium-term optimism.
January lens: headlines can trigger sharp, short-lived repricings around key levels.
On-Chain and Market Structure
Whale behavior, miner selling, and leverage conditions often determine whether moves stick.
January lens: accumulation favors base/bull paths; rising exchange inflows and leverage raise downside risk.
Geopolitical and Idiosyncratic Shocks
These events often cause overshoots rather than trend shifts.
January lens: volatility spikes that usually mean-revert—unless they coincide with macro stress.
Taken together, January price action is path-dependent. Alignment across these drivers biases price upward; divergence expands volatility without guaranteeing direction.
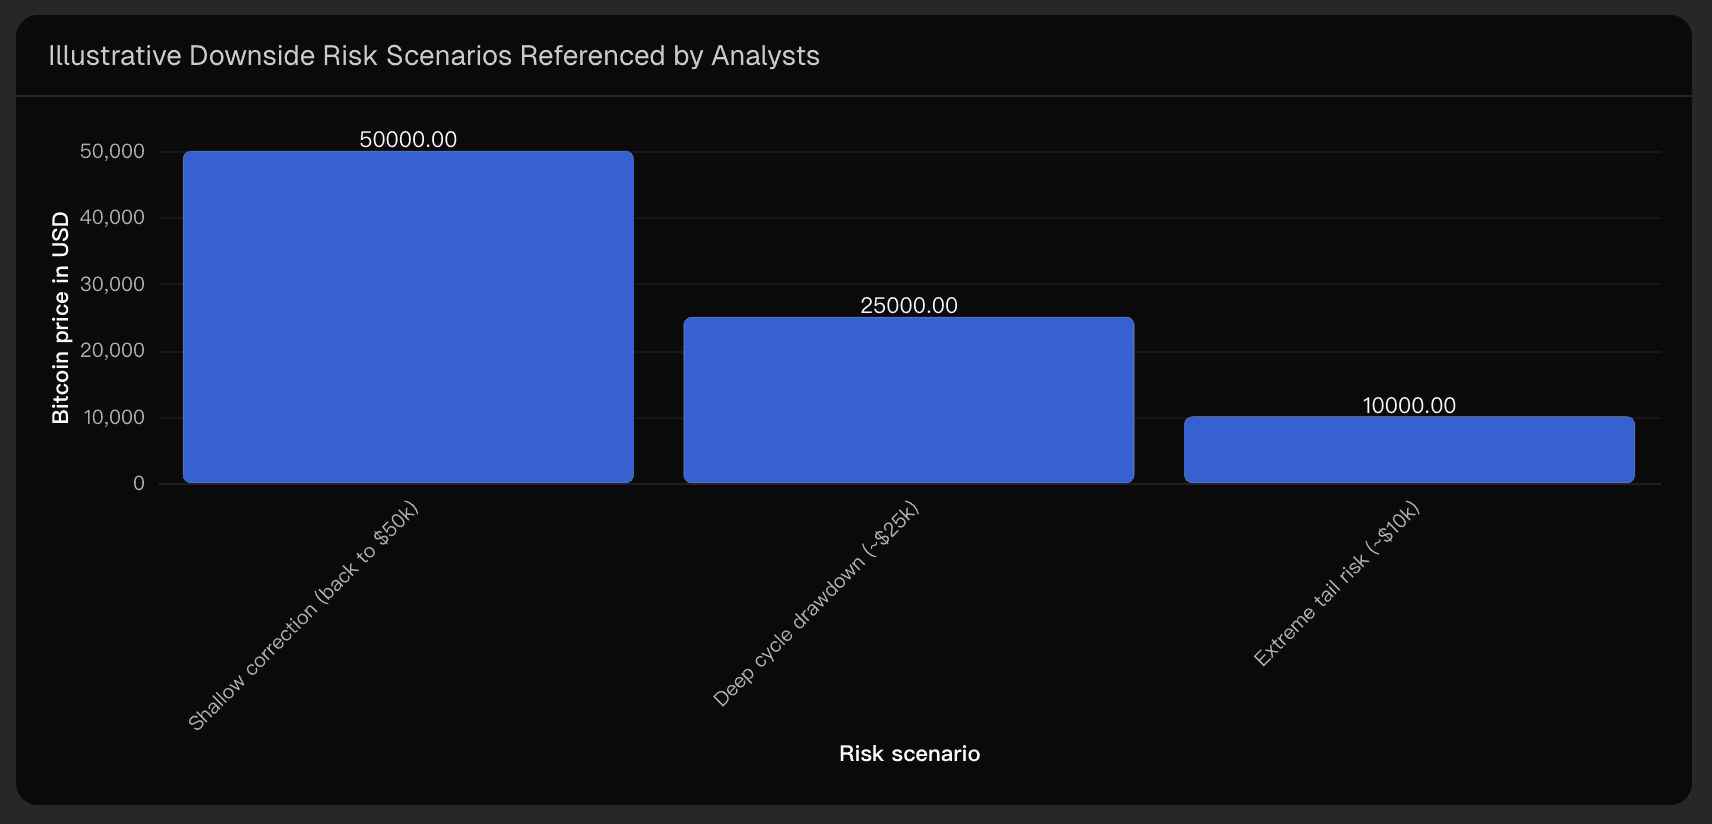
4. Uncertainty and Downside Risk Structure
No January forecast is complete without mapping the downside ladder already embedded in current research:
~$50,000: commonly cited shallow correction level.
~$25,000: deep cycle drawdown scenario tied to long-term technical breakdowns.
~$10,000: extreme tail risk associated with regime-changing events.
For January specifically:
A move toward $50k is plausible under a risk-off regime but likely requires multiple negative catalysts.
A fall toward $25k represents a cycle-level risk, not a base January outcome.
$10k scenarios are analytically important but practically irrelevant for month-ahead price expectation.
Upside uncertainty is equally real. Forecasts ranging from $150k to $250k+ later in the cycle remain credible—but January is more likely to test conviction than fulfill it.
Synthesis: A Macro View of January Bitcoin Prices
Pulling everything together:
January is best understood through a $50k–$125k envelope, not a single target.
The base case favors consolidation around current levels, with upside optionality.
Bullish and bearish paths remain asymmetric but non-trivial, shaped by macro data and ETF flows rather than sentiment alone.
This is exactly why I rely on Powerdrill Bloom—not to predict the future with certainty, but to structure uncertainty into a clear, visual, and update-ready framework as new data arrives.
This analysis reflects data-driven projections based on current market conditions and is not financial advice.
Related Post

Dec 30, 2025
/
Post by
Liam

Jan 4, 2026
/
Post by
Sophia
Dec 26, 2025
/
Post by
fox