

At the start of every volatile crypto month, I return to the same question: not where will Bitcoin close, but what levels does the market believe Bitcoin can realistically touch—even briefly.
To answer that for February 2026, I analyzed prediction-market pricing, spot distributions, and volatility structure using a structured workflow supported by Powerdrill Bloom, which helps me translate fragmented market signals into a coherent probabilistic view.
What follows is not a price call, but a market-implied forecast—one grounded in how traders are actually positioning risk.
1. Executive Forecast: Where the Market’s Center of Gravity Lies
My base-case conclusion is straightforward: Bitcoin’s most probable “hit level” for February 2026 clusters around $85,000.
As of February 3, 2026, spot prices were largely being priced below $80,000 at noon ET, yet the market still assigns meaningful probability to upside tests. That combination—depressed spot with residual upside optionality—produces a familiar regime. The market is open to rebounds, but not pricing an aggressive trend continuation.
The key takeaway:
$85k acts as a magnet level for upside probes. Moves above $90k are treated as tail outcomes rather than core expectations, while probabilities beyond $100k thin out rapidly. In practical terms, the market is willing to price volatility, but not conviction.
2. Understanding the Probability Ladder
2.1 What These Markets Are Really Pricing
The contract structure matters more than most people realize. The question “What price will Bitcoin hit in February?” resolves Yes if any 1-minute BTC/USDT candle high on Binance touches or exceeds a given strike at least once during the month.
This means:
Each strike is an independent probability
These are not mutually exclusive outcomes
This is not a forecast of the monthly close, average, or sustained price
It’s a pure question of path-dependent volatility.
2.2 Market-Implied Hit Probabilities (as of Feb 3, 2026)
The probability ladder tells a very clear story:
P(hit ≥ $85k): ~53%
P(hit ≥ $90k): ~26%
P(hit ≥ $95k): ~12%
P(hit ≥ $100k): ~5%
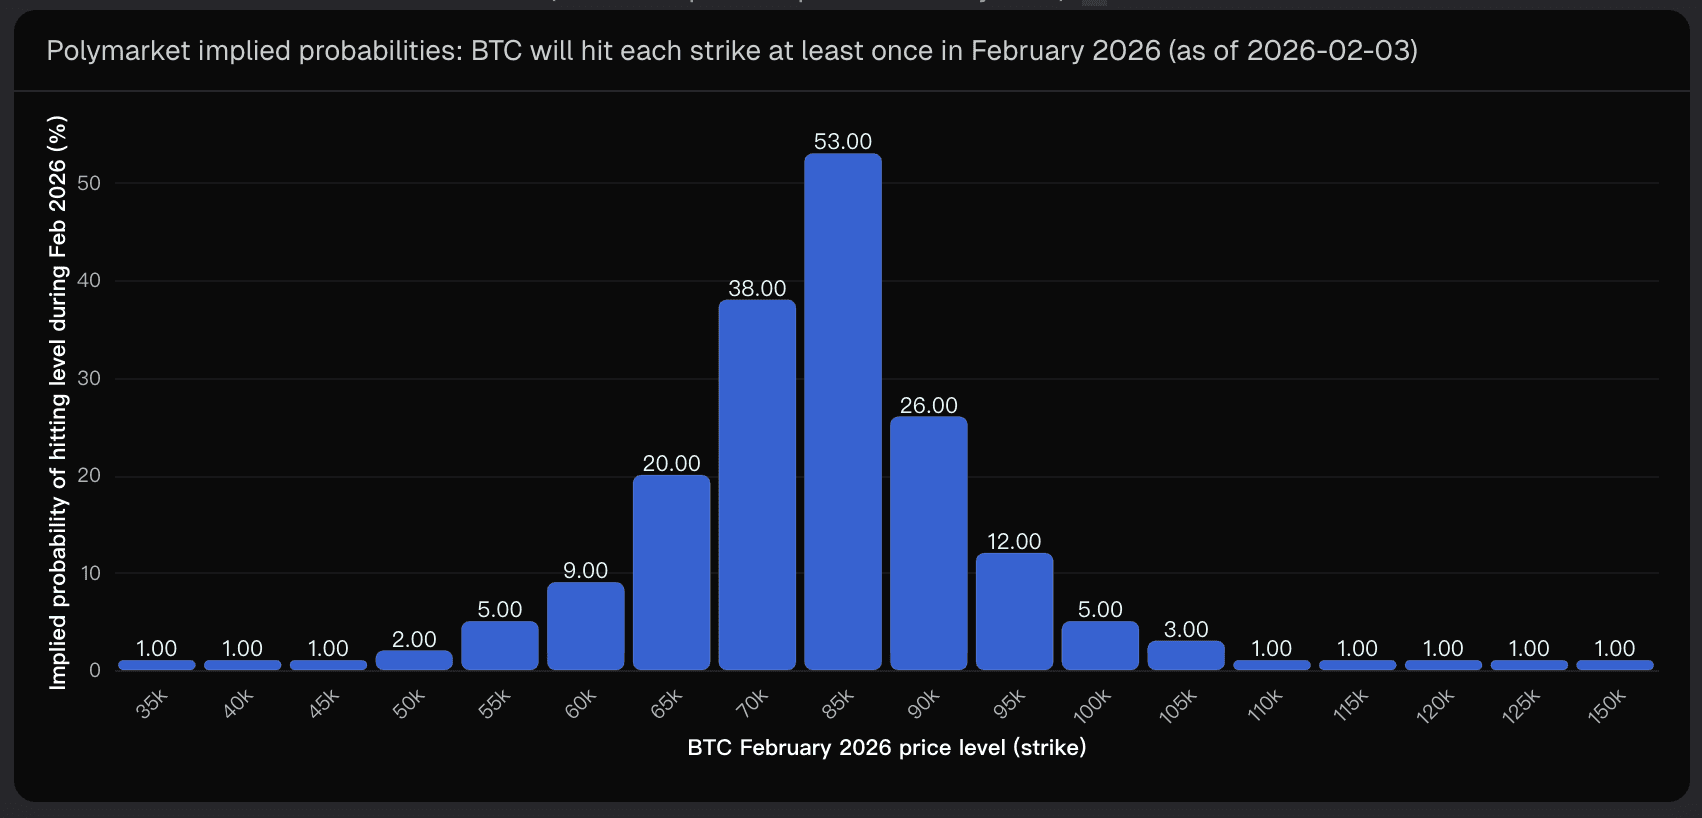
Beyond $105k, probabilities collapse into low single digits. Far-right tail outcomes—$125k to $150k—are priced at roughly 1% or less.
This steep drop-off after $85k is the most important signal. It shows where consensus comfort ends.
2.3 The Near-Term Anchor: Starting February Below $80k
At noon ET on February 3, the spot distribution was heavily skewed:
< $80k: ~81.5%
$80k–$82k: ~16%
Above $84k: negligible probability
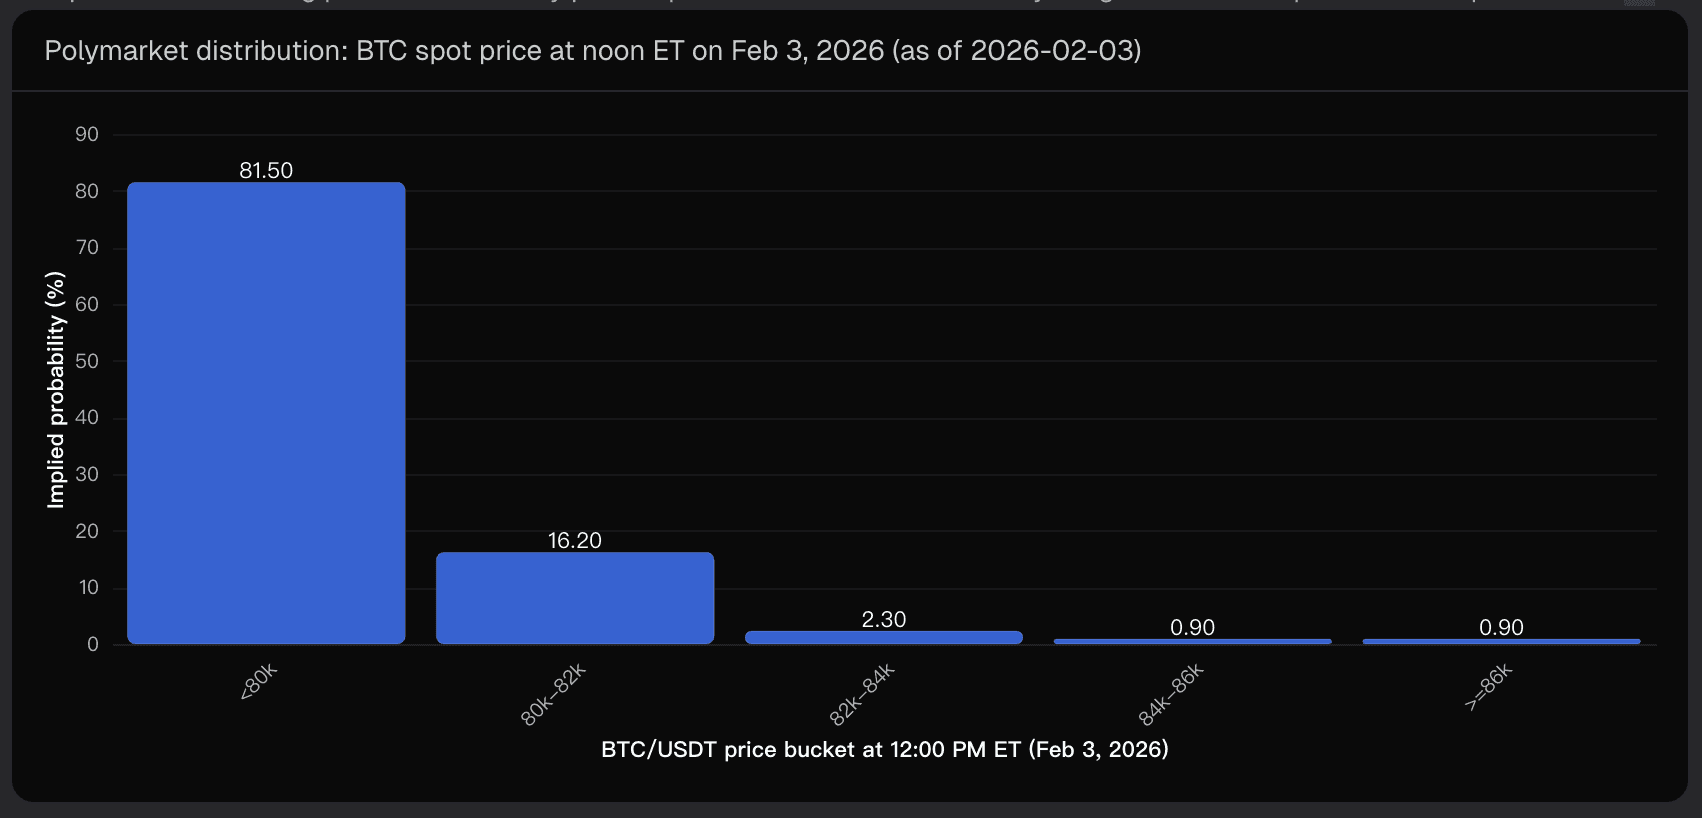
This matters because monthly highs are path-dependent. Starting the month below $80k raises the bar for sustained upside regimes and reinforces the idea that any higher prints would likely come from short-lived volatility events, not persistent demand.
2.4 Institutional Read-Through
Put together, the market is effectively saying:
“Upside is possible, but February is not priced as a re-acceleration phase.”
The upside risk is concentrated at $85k, while incremental probability above $90k thins quickly. This is typical of a market where:
Spot is under pressure
Liquidity-driven spikes are possible
Trend-following demand is not strongly priced
3. Key Drivers That Could Influence February’s High
3.1 On-Chain Positioning and Behavior
There are three on-chain regimes I watch closely:
Cost-basis metrics (Realized Price, MVRV, NUPL):
Holding above key cost levels often leads to “sell-the-rip” behavior rather than breakout continuation.Profit realization (SOPR-style signals):
A return to sustained positive realized P&L while price holds would support higher hit odds in the $85k–$90k zone.Exchange flows:
Persistent net outflows support upside skew. Inflows often precede distribution phases.
3.2 Macro Liquidity Still Matters
Bitcoin is not trading in isolation.
In late January 2026, market commentary linked BTC weakness to speculation around potential Federal Reserve leadership changes and a preference for a smaller balance sheet. Historically, tighter liquidity regimes compress risk premia—especially for high-beta assets like crypto.
At the same time, derivatives-driven markets amplify liquidation reflexivity. In these conditions, strike hits can be driven by volatility bursts rather than steady inflows.
3.3 Using Prediction Markets Correctly
Prediction markets are not crystal balls. They are tradable consensus surfaces.
What matters most is not any single probability, but the shape of the ladder. Here, the sharp drop after $85k tells me traders are comfortable pricing rebounds—but reluctant to price deep upside continuation.
The best operational use is to treat this ladder as a risk-neutral prior, then layer on your own assumptions about volatility, macro catalysts, and flow dynamics.
4. Critical Uncertainties That Could Break the Forecast
No forecast survives contact with reality unscathed. The main risk factors include:
Policy or liquidity shocks: Faster-than-expected tightening could quickly compress upside probabilities.
Reflexive liquidation cascades: Thin liquidity windows can mechanically increase hit probabilities without signaling a new trend.
Volatility regime shifts: A sharp repricing in implied volatility could lift high strikes even in the absence of bullish fundamentals.
Market-resolution mechanics: Binance 1-minute candle highs mean transient wicks can matter.
Positioning asymmetry: Less liquid far-tail strikes can be influenced by concentrated positioning.
Conclusion: A Probabilistic, Not Predictive, Answer
So, what price will Bitcoin hit in February 2026?
If I distill everything the market is currently implying, $85,000 stands out as the most defensible answer—not because it’s guaranteed, but because it represents the point where volatility, positioning, and consensus intersect. Higher levels are possible, but they live firmly in the tail of the distribution.
This kind of probabilistic framing—rather than binary price calls—is exactly why I rely on structured analytical workflows supported by tools like Powerdrill Bloom to interpret uncertainty instead of ignoring it.
Disclaimer: This analysis is for informational purposes only and does not constitute financial or investment advice.
Related Post

Jan 30, 2026
/
Post by
Molly

Feb 2, 2026
/
Post by
Franklin

Jan 29, 2026
/
Post by
Jasper