Data Facts: Why the US Stock Market Suffered Its Worst Drop of 2026 (Data Report)

TL;DR — The Market Crash in 5 Numbers
Early June 2026 abruptly snapped the stock market back to reality, ending the S&P 500’s nine-week winning streak. A toxic combination of semiconductor earnings misses, red-hot labor data, and looming mega-IPO liquidity drains created a perfect storm. Here is the crash in five figures:
$1.3 Trillion: The total market cap wiped out from the semiconductor sector in a single day on Friday, June 5.
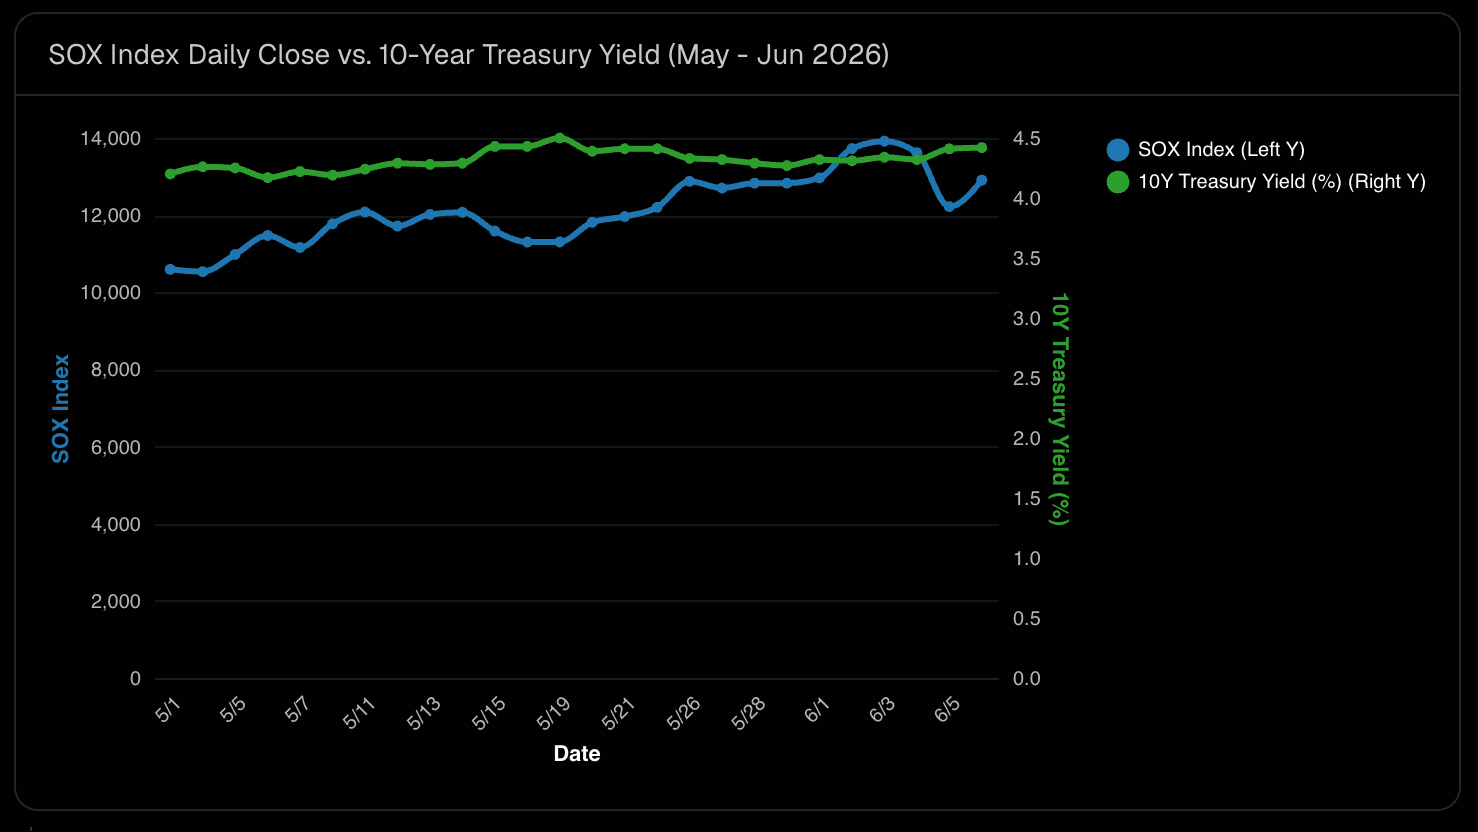
10.3%: The daily plunge of the Philadelphia Semiconductor Index (SOX)—its worst single-day drop since the March 2020 COVID crash.
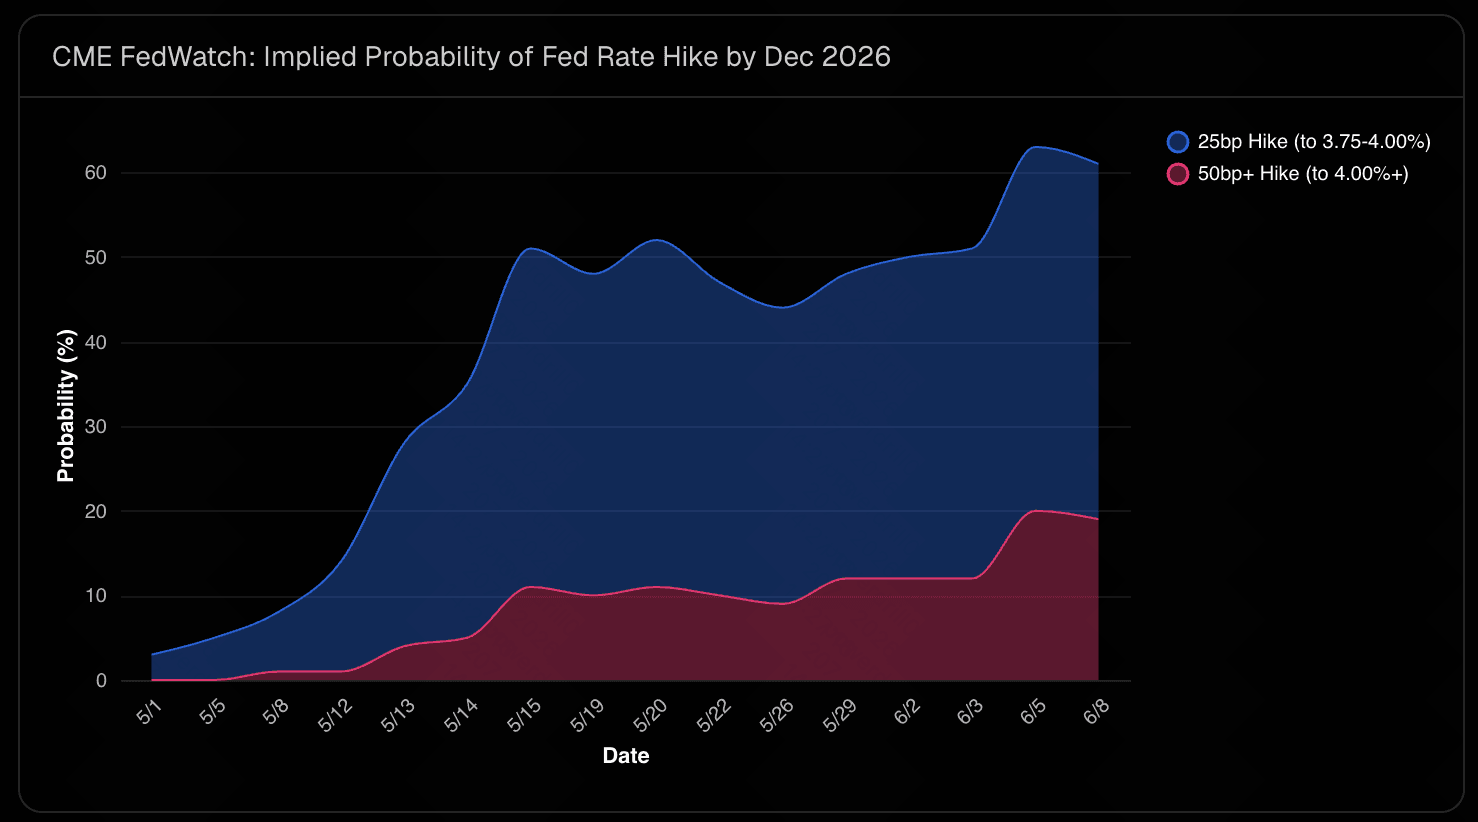
42.7%: The surging probability of a Fed rate hike by December, up from near zero a month ago, following a shock jobs report.
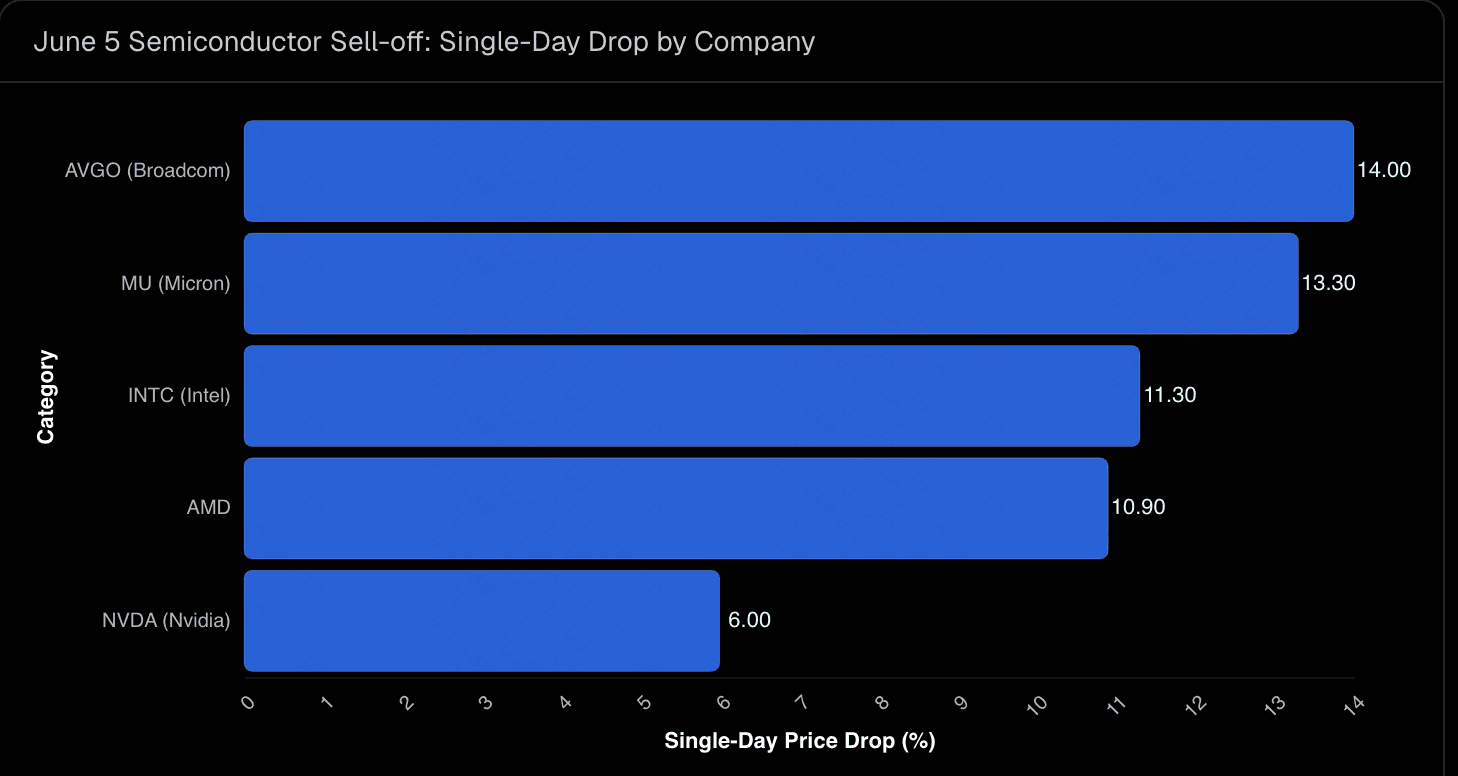
14%: Broadcom’s (AVGO) stock plunge on June 4, which acted as the primary catalyst for the tech sell-off.
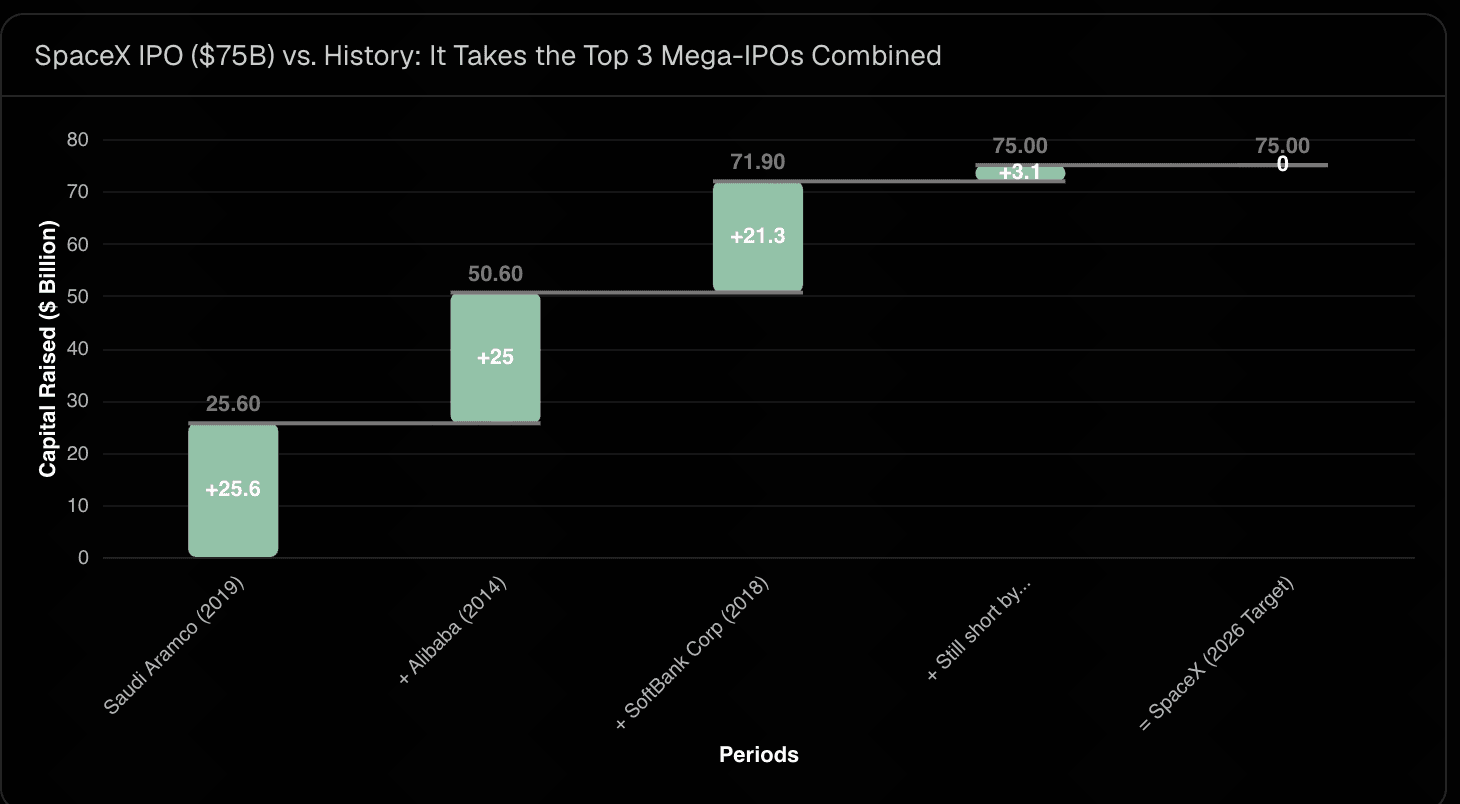
$1.77 Trillion: The targeted mega-valuation for SpaceX’s historic IPO this week, causing institutions to liquidate tech holdings to free up $75 billion in cash.
The short version: This wasn't just a healthy pullback. It was a violent repricing event driven by overbought AI valuations colliding with the harsh reality of "higher-for-longer" (or even rising) interest rates.
A Little Background
For the first five months of 2026, the narrative was flawless: AI was accelerating, and rate cuts were eventually coming. The S&P 500 rode a nine-week winning streak into early June. But the market was severely overbought, with the S&P 500's RSI hitting 73.
Then came Thursday, June 4. Broadcom released its Q2 earnings.
While they beat estimates, their Q3 AI chip sales guidance of $16 billion missed Wall Street's $17.2 billion expectation, triggering a massive "sell the news" cascade. The next day, a shockingly strong US jobs report poured gasoline on the fire, crushing rate cut dreams and sending the 10-year Treasury yield spiking to 4.54%.
About the Dataset
This report draws on publicly reported trading and macro data covering the first week of June 2026. Sources include CME FedWatch, Polymarket prediction data, IDC smartphone shipment forecasts, J.P. Morgan research, and official market closes across the Nasdaq and NYSE.
About the Tool
Every chart concept in this report was generated with Powerdrill Bloom, an AI-first data analysis agent. We uploaded the raw market CSVs, and Bloom cleaned the data, identified the rate-hike correlations, and produced the insights below automatically, no SQL, no Python, no manual formatting. If you want to analyze your own portfolio data, see our AI data visualization tool.
Key Takeaways
The Semiconductor Slaughter: Broadcom's guidance miss dragged down the entire supply chain. Micron (MU) fell 13.3%, Intel (INTC) sank 11.3%, AMD dropped 10.9%, and Nvidia (NVDA) fell 6%, briefly losing its $5 Trillion market cap crown.
The Fed Pivot: May non-farm payrolls added 172,000 jobs (nearly double expectations) with unemployment steady at 4.3%. The narrative shifted instantly from "when will they cut?" to "will they hike?"
Smartphone Demand Collapse: Adding fundamental pressure to chipmakers, IDC reported that 2026 global smartphone shipments are projected to drop 13% year-over-year to a 10-year low, deepening the memory chip crisis.
The Monday Rebound & Apple's Stumble: Easing Middle East tensions allowed a relief rally on Monday, June 8 (Nasdaq 100 +1.5%, NVDA +2%). However, Apple (AAPL) tumbled late in the day as its WWDC reveals for "Apple Intelligence" and the AI-upgraded Siri failed to meet sky-high market expectations.
J.P. Morgan Downgrades Stocks: With the VIX spiking to 21.51 (well above its historical average of 16), J.P. Morgan officially shifted its equity outlook from "Bullish" to "Tactical Caution."
The Market Drop: The Full Data Breakdown
Q1: What exactly triggered the Friday crash?
It was a one-two punch of fundamental disappointment and macro shock. First, Broadcom’s refusal to raise its full-year AI semiconductor forecast broke the "AI is invincible" illusion. Then, Friday's labor report hit. With 172,000 jobs added, bond yields surged.
Growth stocks (like tech) are highly sensitive to the 10-year yield; when it jumped to 4.54%, computer-driven quant funds systematically dumped high-PE tech stocks. Bitcoin also broke below $60k, and gold dropped 3.5%, signaling a broad liquidation of non-yielding assets.
Q2: Is this an AI crash or just a correction?
According to Wells Fargo's chief strategist, this is a severe correction driven by positioning, not a structural crash. The semiconductor sector was fundamentally overbought. Institutions are rebalancing their portfolios, taking profits from the massive run-up to prepare for new capital deployments.
Q3: How does the SpaceX IPO play into this liquidity drain?
On Friday, June 12, SpaceX (Ticker: SPCX) will execute the largest IPO in history, raising $75 billion by issuing 555.6 million shares at $135 each. Its target valuation is $1.77 Trillion—triple the size of Alibaba's record IPO. However, Morningstar currently values SpaceX at only $780 billion, citing an extreme 67x Price-to-Sales multiple (compared to Nvidia's 22x). The market is heavily divided, and Polymarket odds for SpaceX holding its IPO valuation dropped 6% this week. Institutions had to sell existing tech winners last week just to ensure they had cash on hand for SPCX.
What This Means for Businesses and Investors
For investors, the era of blind "buy the dip" in AI is pausing. Dallas Fed President Lorie Logan's comments that rate hikes might be needed to pull inflation back to 2% means the cost of capital is staying high. J.P. Morgan doesn't expect the Fed to move until Q3 2027. For businesses, the SpaceX IPO will be the ultimate test of market risk appetite: if a $1.77T mega-listing at a 67x P/S ratio fails to hold its price, expect further multiple compression across the entire tech sector.
How We Made These Charts (in One Click)
You don't need a Bloomberg Terminal to produce a report like this. Here's the exact workflow:
Upload your data or start from skills/a topic. Choose a skill, enter a topic, or upload your data like a portfolio CSV to start your AI-powered investment research.
Let the canvas explore it. Bloom auto-cleans the data and spots the correlations (like the SOX index perfectly inversely tracking the 10-year yield).
Export to slides. Turn the whole canvas into a presentation-ready deck with one click.
No SQL. No Python. No copy-pasting charts into slides. Want to try it on your own dataset? Try Powerdrill Bloom free.
FAQ
Where does this market data come from?
The figures are drawn from official June 2026 market closes, CME FedWatch, Polymarket, IDC smartphone data, and public corporate earnings reports (Broadcom).
Did Nvidia really lose its $5 Trillion valuation?
Yes, temporarily. During the Friday sell-off, Nvidia dropped 6%, briefly slipping below the historic $5 Trillion market cap mark it had recently claimed, though it rebounded 2% on Monday.
Why did Apple drop on Monday despite the broader market rebound?
Apple hosted its WWDC event on Monday, June 8. Despite revealing the highly anticipated "Apple Intelligence" and an AI-powered Siri, Wall Street viewed the updates as underwhelming compared to competitors, triggering a late-day sell-off in AAPL stock.
Can I analyze my own stock portfolio like this?
Yes. Upload a CSV of your trading history to Powerdrill Bloom and it will clean the data, build the charts, and let you export a slide deck—no coding required.
A Wrap-Up
The numbers behind the June 2026 market drop tell a story of a market abruptly waking up. The collision of Broadcom's reality-check earnings, a rate-hike-inducing jobs report, and the looming liquidity black hole of the SpaceX IPO proved too much for the S&P 500's winning streak. As we watch VIX levels hold above 21, the market is telling us that volatility is back.
Curious what your portfolio data is hiding? Upload it to Powerdrill Bloom and let the charts tell the story.