What Is a Confidence Interval? Definition, Examples, and How to Read One (2026)
A confidence interval is a range calculated from sample data. The method behind it would capture the true population value in a stated share of repeated samples. A 95% interval comes from a procedure that succeeds 95% of the time.
That phrasing sounds pedantic and it is the whole point. The confidence describes the method, not the particular range printed on your slide.
This guide covers the definition and what the interval is used for. It then covers how to read one, how it differs from neighbouring ideas, and what it cannot tell you.
What is a confidence interval?
Take a sample, measure something, and you get one number. Take a different sample and you get a slightly different number. The interval is an attempt to express how much that number would move around.
A worked example makes it concrete. You survey 400 customers and 62% say they would recommend you. A 95% interval might run from 57% to 67%.
The correct reading is about the procedure. Imagine repeating this survey many times and building an interval each time. Roughly 95% of those intervals would contain the true figure for all your customers.
The tempting reading is that there is a 95% chance the true value sits between 57% and 67%. Under the standard definition that is wrong, because the true value is fixed and it is the interval that varies.
The distinction has practical consequences. Once the interval is computed it either contains the true value or it does not, and you cannot know which. What you can know is how often the method gets it right.
What a confidence interval is used for
Reporting a measurement honestly. A single percentage implies precision that a sample cannot deliver. The interval shows how much room the estimate has.
Comparing two groups. If the interval for a difference excludes zero, the difference is statistically distinguishable at the matching significance level. That is the same information a test gives, in a more readable form.
Deciding whether to act. An interval running from a 1% improvement to a 40% improvement says the effect is probably positive and its size is unknown. That is often the honest answer, and it changes the decision.
Setting expectations before a decision. Publishing the range in advance stops a later result being read as a surprise. A number landing inside the interval you already stated is not news.
Sizing the next study. If the interval is too wide to be useful, the fix is a larger sample. The width tells you roughly how much larger.
How a confidence interval works
Three things set the width, and it is worth knowing which lever you actually control.
Sample size. More observations narrow the interval, and the return diminishes. Roughly speaking, quadrupling the sample halves the width.
Variability in the data. Spread-out data produces wider intervals. This is a property of what you are measuring and it is mostly not adjustable.
The confidence level you choose. A 99% interval is wider than a 95% interval on the same data. Higher confidence is bought with less precision, not with better information.
A fourth factor is often forgotten: what you are estimating. Ranges around proportions near 0% or 100% behave differently from ranges around a mean, because the quantity is bounded. Standard formulas can produce values that extend past those bounds.
The last one confuses people most. Raising the confidence level does not make the estimate better. It widens the net so the method succeeds more often.
How to read one
Read the width before the midpoint. A range of 61% to 63% and a range of 30% to 94% can share a centre, and only one of them supports a decision.
A range quoted without its confidence level is not interpretable. Ask for the level before reading anything into the width.
Then check what the interval excludes. For a difference between two groups, zero is the value that matters. An interval containing zero means the data is compatible with no difference at all.
Finally, ask what the interval is around. An interval for an average tells you about the average, not about individual cases. Half your customers can sit outside an interval for the mean, and nothing is wrong.
Watch for ranges reported without their sample size. Two of identical width can rest on very different amounts of evidence when the underlying variability differs. The sample size belongs next to the estimate.
One practical habit: report the interval alongside the estimate every time, in the same sentence. Separating them into a footnote guarantees the footnote goes unread.
Confidence interval vs. related ideas
| Term | What it describes | Common confusion |
|---|---|---|
| Confidence interval | Plausible range for a population value | Read as a probability about this one range |
| Prediction interval | Plausible range for one future observation | Used when the question is about individuals |
| Margin of error | Half the width of a symmetric interval | Quoted without its confidence level |
| Standard deviation | Spread of the data itself | Mistaken for uncertainty in the estimate |
The distinction between the first two rows causes the most damage in practice. A narrow interval around an average is not a promise about any single customer, order or day.
For the neighbouring concept of whether an observed difference is real at all, see our guide to what statistical significance is.
Limits and what it cannot tell you
It does not fix a biased sample. If your survey reached only your most active users, more responses produce a narrower interval around the wrong number. Precision and accuracy are different properties.
It does not describe importance. A difference can be measured precisely and still be too small to act on. Statistical resolution and business relevance are unrelated questions.
It assumes the method's conditions hold. Every interval rests on assumptions about how the sample was drawn. Convenience samples and repeated peeking at results both break those assumptions quietly.
It is easy to distort by stopping early. Checking results repeatedly and halting when the range looks convincing inflates the error rate beyond the stated level. Fix the sample size before you start looking.
It says nothing about a single case. The interval is about a population value. Applying it to one customer or one transaction is a category error.
Stated plainly: the interval quantifies sampling variability and nothing else. Every other source of error is still yours to worry about.
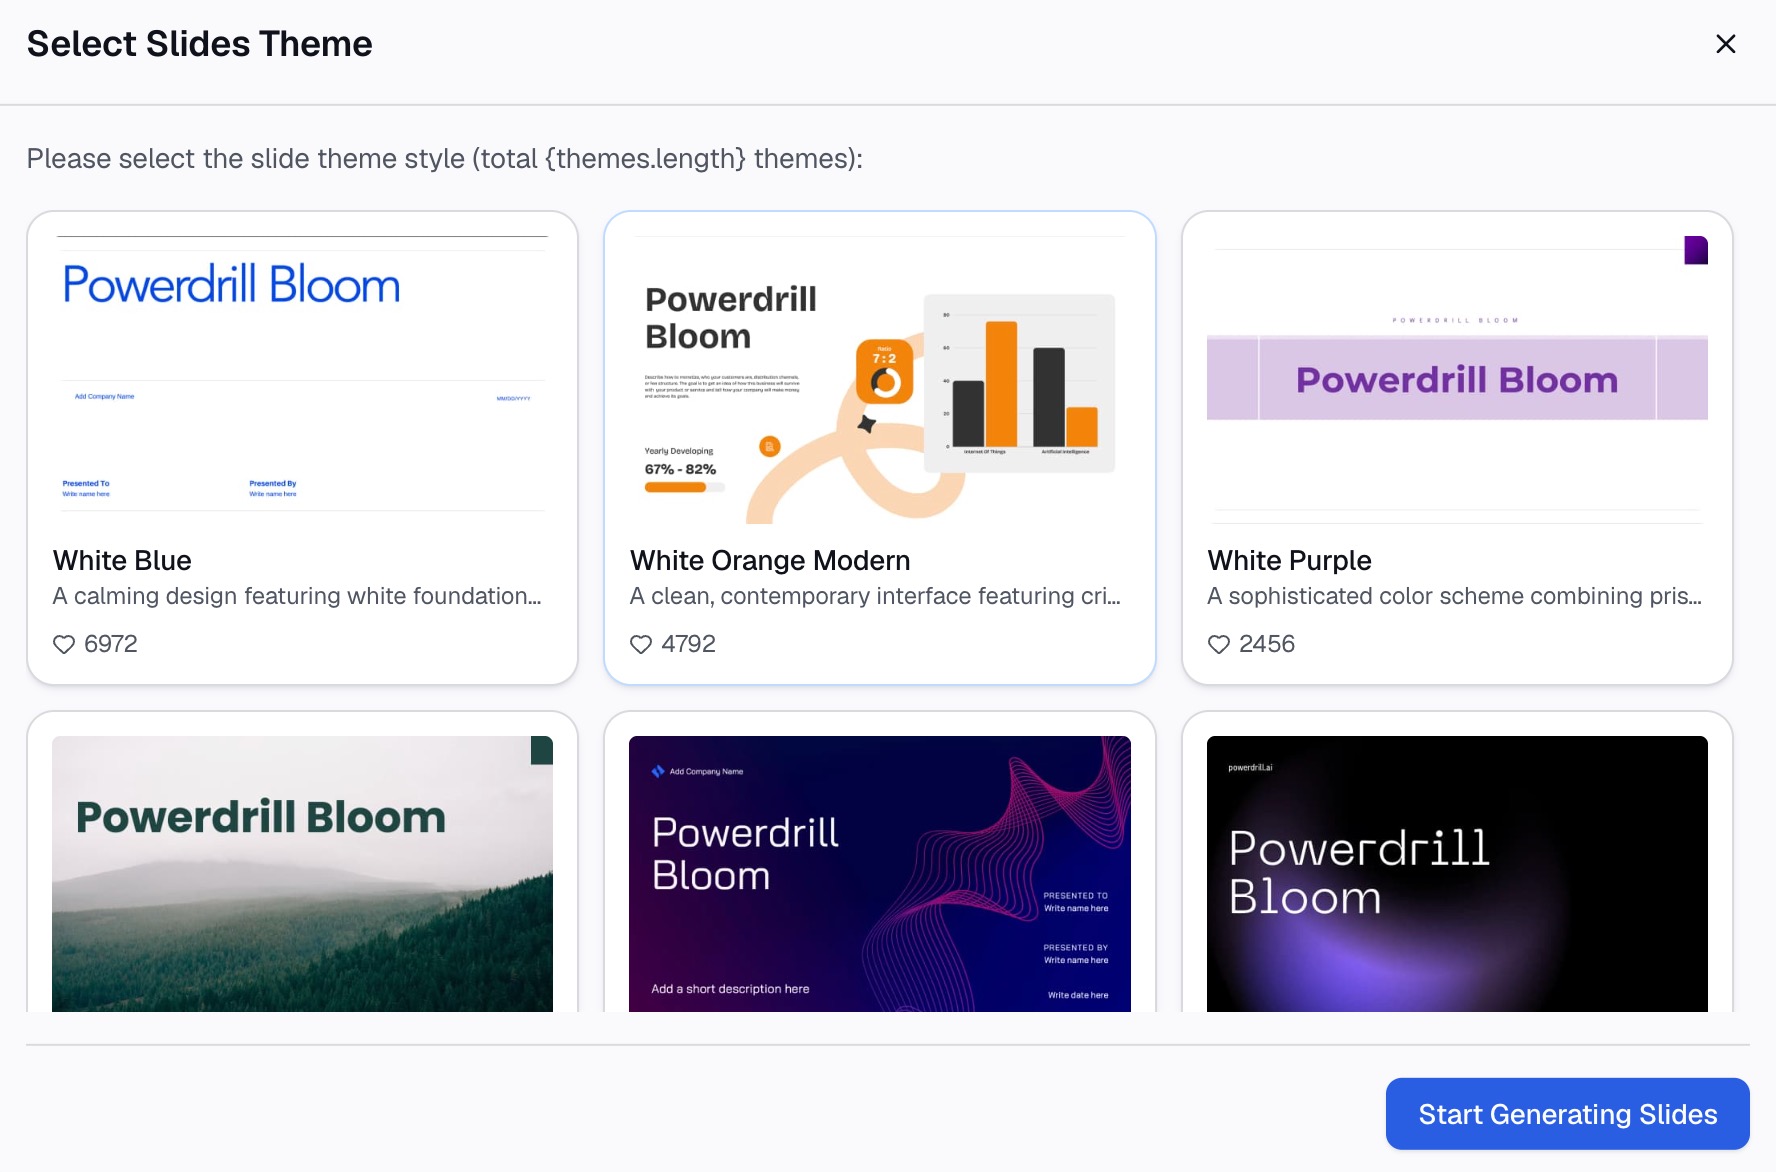
How to get one from your data with Powerdrill Bloom
Step 1: Upload your data
Upload the raw responses or measurements rather than a summary table. Powerdrill Bloom profiles the columns on arrival, so group sizes and missing values are visible before any interval is computed.

Step 2: Ask for the interval in natural language
Ask for the estimate and its range together. Request the mean by group with a 95% confidence interval, and ask how many observations sit behind each one.
Then ask the follow-up that turns numbers into a decision. Ask which group differences have intervals that exclude zero, and which are too wide to support a conclusion.
Step 3: Export the chart, report, or deck
Take out a table with intervals attached, a chart with error bars, or a written paragraph you can paste into a report.
Conclusion
A confidence interval expresses how much your estimate would move if you sampled again. Read the width first, then check whether it excludes the value that matters. The confidence belongs to the method rather than to the printed range.
One last habit is worth adopting. When someone shows you a single number with no range attached, ask what the range is. The answer is usually informative, and sometimes it is that nobody computed one.
The habit worth building is reporting the range every time you report the number. If you would rather ask for both at once, try Powerdrill Bloom on your dataset. See also our guides to running descriptive statistics and analyzing A/B test results without a statistician, plus the auto insights page.
Frequently asked questions
What does a 95% confidence interval actually mean?
It means the method used would produce an interval containing the true population value in about 95% of repeated samples. The 95% describes the procedure rather than the specific range you calculated.
Is a wider confidence interval better or worse?
Worse, in the sense that it is less informative. A wide range means the data supports many possible values, which usually points to a small sample or high variability in what you measured.
Why does a 99% interval look worse than a 95% one?
Because higher confidence requires a wider net. The same data supports a more reliable claim only by making that claim less specific, so precision falls as confidence rises.
What is the difference between a confidence interval and a margin of error?
Margin of error is half the width of a symmetric interval. Quoting a margin of error without its confidence level leaves out the information needed to interpret it.
Can a confidence interval be wrong?
The calculation can be correct while the answer is misleading. A biased sample produces a narrow interval around the wrong value, because the method measures sampling variability and not accuracy.