11 Top AI Tools for Time-Series Analysis in 2026 (Rated & Ranked)
Understanding how data changes over a specific period is the cornerstone of modern business intelligence, financial forecasting, and operational efficiency. Whether a company is attempting to predict next month's sales volume, monitor fluctuating server loads, or forecast the stock market, tracking chronological data points is essential. As businesses accumulate colossal amounts of historical data, relying on traditional, manual calculation methods is no longer viable. Artificial intelligence has fundamentally transformed how we interact with this data, turning static spreadsheets into dynamic, predictive engines.
Today, AI-driven platforms can automatically detect hidden patterns, pinpoint anomalies, and forecast future outcomes with unprecedented accuracy. These intelligent systems take the heavy lifting out of statistical modeling, allowing both technical data scientists and everyday business users to extract meaningful foresight from their historical records. In this comprehensive guide, we will explore the core concepts of this analytical approach, highlight the essential features required in a modern predictive platform, and break down the absolute best software solutions available on the market to help you turn chronological data into a distinct competitive advantage.
What Is Time-Series Analysis
Before diving into the software, it is crucial to understand the fundamental concepts underlying this analytical method. Time-series analysis involves analyzing a sequence of data points collected or recorded at specific time intervals. Here is a breakdown of its core components:
Trend Identification: This involves recognizing the long-term movement in the data. Trends show whether a metric (like revenue or website traffic) is generally increasing, decreasing, or remaining stable over a long duration, ignoring short-term fluctuations.
Seasonality Detection: Many datasets exhibit regular, predictable patterns that repeat over specific periods, such as retail sales spiking every December or server traffic increasing during business hours. Analysis helps isolate these seasonal cycles.
Cyclical Pattern Recognition: Unlike seasonality, which has a fixed and known frequency, cyclical patterns occur over variable periods. Economic indicators, such as periods of recession and expansion, are classic examples of cyclical data.
Anomaly and Outlier Detection: Analyzing historical baselines allows AI to instantly flag irregular variations or sudden spikes that do not follow the established pattern. This is critical for fraud detection, network security, and machine maintenance.
Future Forecasting: By understanding past trends, seasonality, and cycles, time-series analysis utilizes predictive modeling to forecast future data points, allowing businesses to prepare for what lies ahead accurately.
What to Look for in an AI Time-Series Analysis Tool
Choosing the correct platform can make the difference between gaining actionable foresight and getting lost in mathematical noise. When evaluating your options, you should look for the following essential capabilities:
Natural Language Processing (NLP): The best modern tools allow you to interact with your data using everyday language. You should be able to type a question like "What is our projected sales trend for the next quarter?" and receive an immediate, accurate response.
Automated Data Preparation: Chronological data is often messy, featuring missing values, inconsistent timestamps, or duplicates. Look for AI that automatically cleans, structures, and interpolates missing data points without requiring manual spreadsheet manipulation.
Advanced Anomaly Detection: Your chosen tool must have robust machine learning algorithms capable of distinguishing between a genuine, actionable anomaly (like a sudden drop in user engagement) and harmless statistical noise.
Intuitive Visualizations: Raw predictive numbers are hard to digest. The software should automatically generate line charts, bar graphs, and presentation-ready visual reports that make trends and forecasts instantly understandable.
Contextual Memory and Workspaces: Advanced AI tools should remember your past queries, ongoing projects, and specific business context across different sessions so you do not have to start your analysis from scratch every time you log in.
11 Top AI Tools for Time-Series Analysis in 2026
Below is a comprehensive comparison table of the 11 leading AI tools for time-series analysis, giving you a quick overview of their strengths and pricing structures before we dive into the detailed reviews.
| Tool | Best For | Key AI Feature | Starting Price |
|---|---|---|---|
| Powerdrill Bloom | End-to-End Analysis & Workflows | MemoryLake & NLP Querying | $16.58/mo |
| DataRobot | Enterprise Machine Learning | Automated TS Modeling | Custom |
| H2O.ai | High-Accuracy Predictive Modeling | Driverless AI | Custom |
| Alteryx | Automated Data Blending | Drag-and-drop ML | Custom |
| Julius AI | Conversational Data Analysis | Chat-based visual generation | $20/month |
| Obviously AI | No-Code Rapid Forecasting | One-click predictive models | Custom |
| Zerve | Collaborative Data Science | Code-first AI dev environment | $18.75/mo |
| Grafana | IT & Observability Metrics | Real-time TS monitoring | $19/mo |
| Tableau | Business Intelligence | Visual TS forecasting | $15/user/mo |
| Amazon Forecast | Highly Scalable Cloud Forecasting | AutoML for time-series | Pay-as-you-go |
| Nixtla | Foundation Models (TimeGPT) | Pre-trained TS AI models | API Usage-based |
1. Powerdrill Bloom
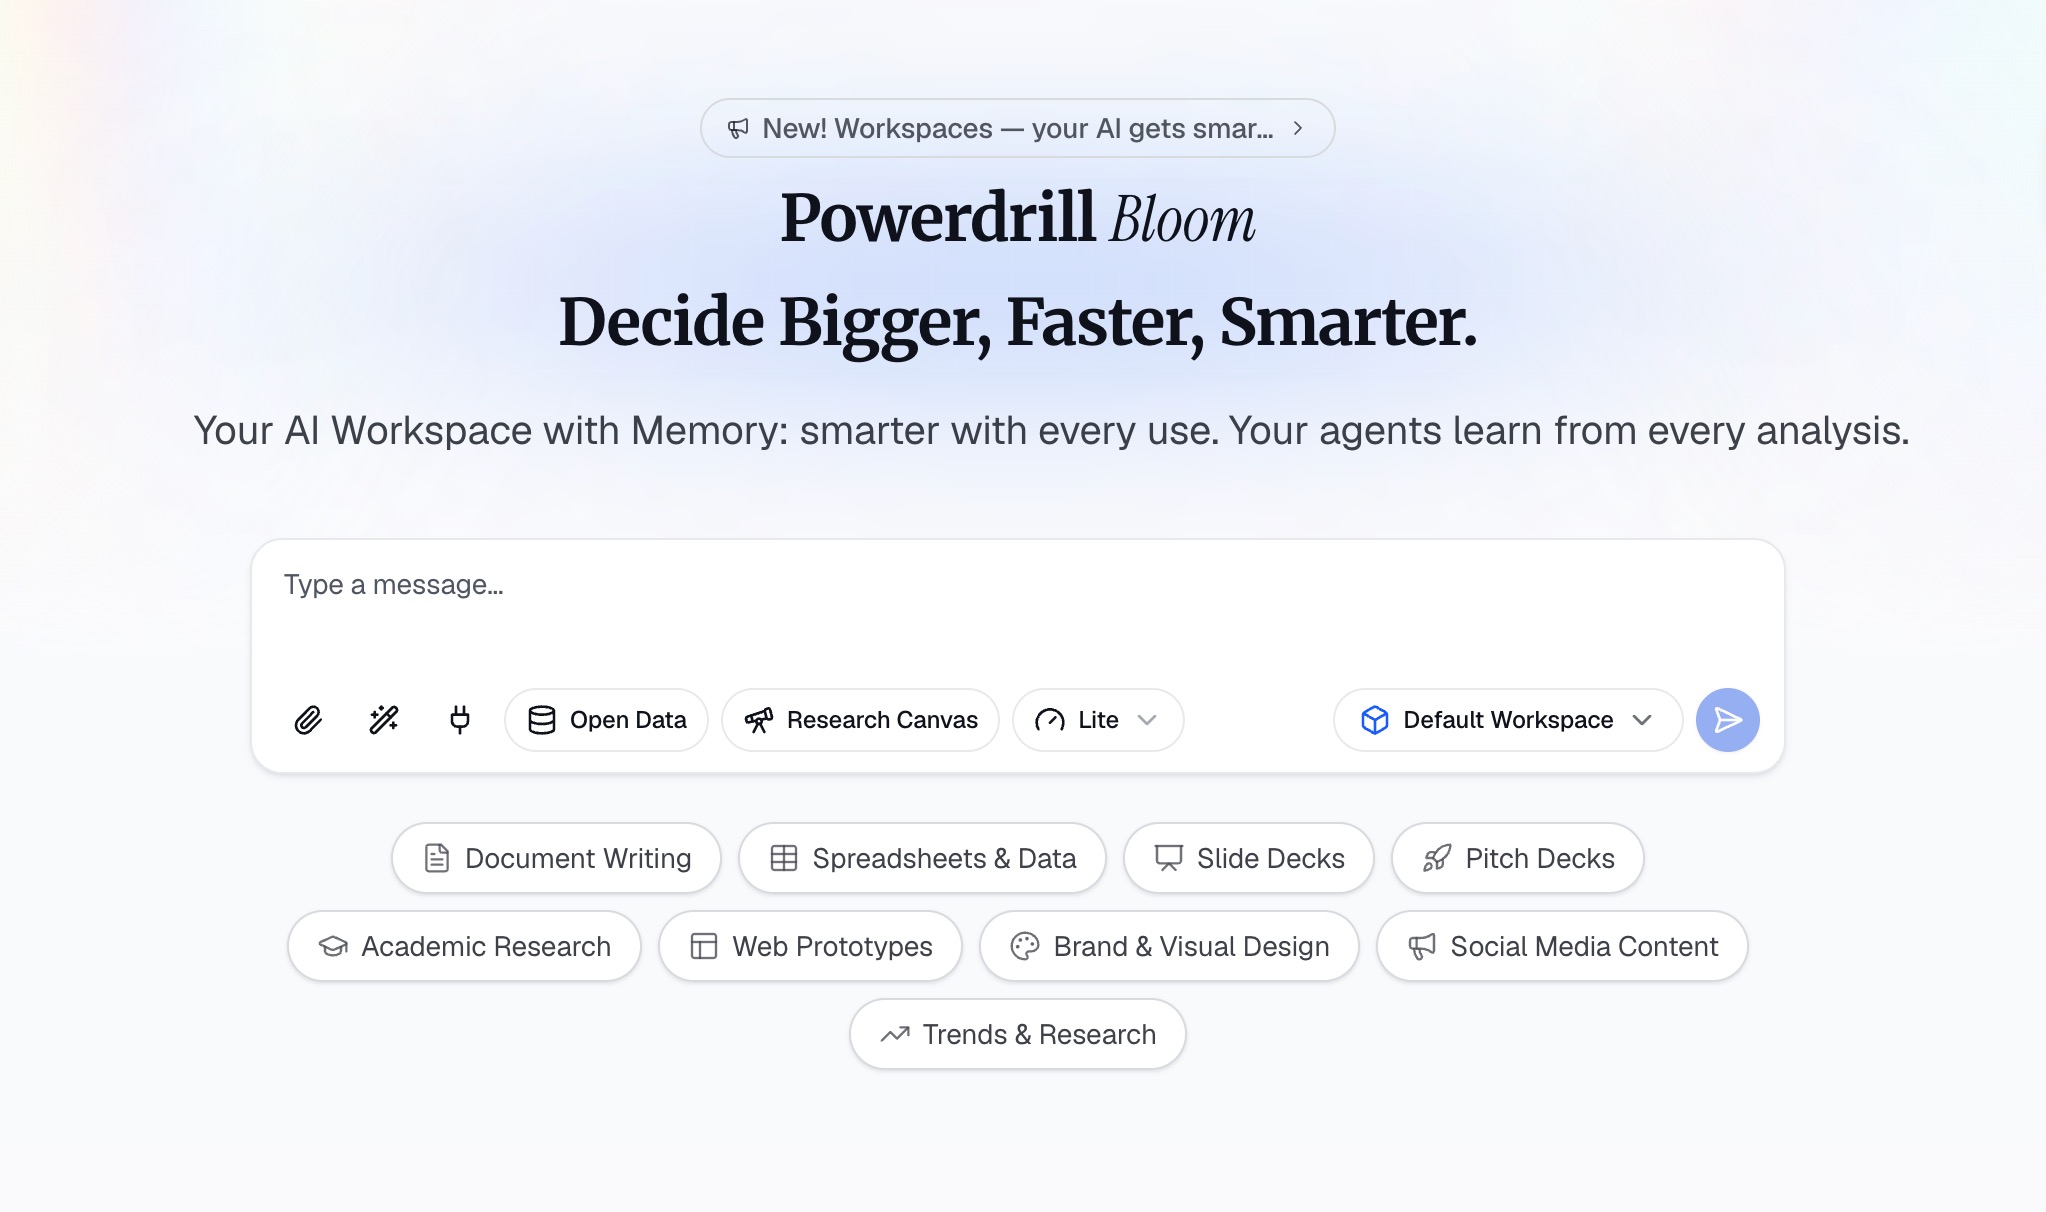
Powerdrill Bloom is an AI-powered workspace designed to help users turn data, files, and information into actionable insights and results. Rather than simply answering questions, Powerdrill Bloom can participate in the entire workflow, helping with research, data analysis, content organization, report generation, and task execution. For time-series analysis, users can upload CSV, Excel, and other files containing historical data and interact with their data using natural language. Powerdrill Bloom can deeply analyze datasets, identify chronological trends and anomalies, uncover key temporal insights, and automatically generate time-series charts, visual reports, and presentation-ready content. Beyond data analysis, it also supports specialized AI Skills for research, analysis, automation, and other complex tasks.
Furthermore, Powerdrill Bloom provides persistent Workspaces where users can keep files, projects, and context organized across sessions, making it easier to continue ongoing time-series modeling without starting from scratch. Its integration with MemoryLake further enhances long-term memory, allowing Powerdrill Bloom to better understand and maintain relevant business context over time. From raw historical data to predictive insights, visualizations, reports, and execution, Powerdrill Bloom brings multiple AI-powered workflows together in one connected workspace.
Key Features
Natural Language Interaction: Query time-series data without writing SQL or Python.
Automated Visualization: Instantly generate trend lines, anomaly highlight charts, and visual reports.
MemoryLake Technology: Retains long-term context of your business metrics and past analyses.
Persistent Workspaces: Organize datasets, historical forecasts, and ongoing research in one dedicated area.
AI Skills: Deploy specialized agents for deep temporal research, anomaly detection, and automated reporting.
Pros
Requires zero coding knowledge, making advanced analysis accessible to anyone.
Handles the entire workflow, from data cleaning to generating presentation-ready reports.
Incredible memory retention means the AI understands your ongoing business context.
Seamlessly accepts standard business files like CSV and Excel.
Cons
May have a slight learning curve when configuring complex, multi-agent AI Skills for the first time.
Heavily code-centric data scientists might miss raw Python environment access.
Pricing
Freemium, paid plan starts at $16.58/month.
2. DataRobot
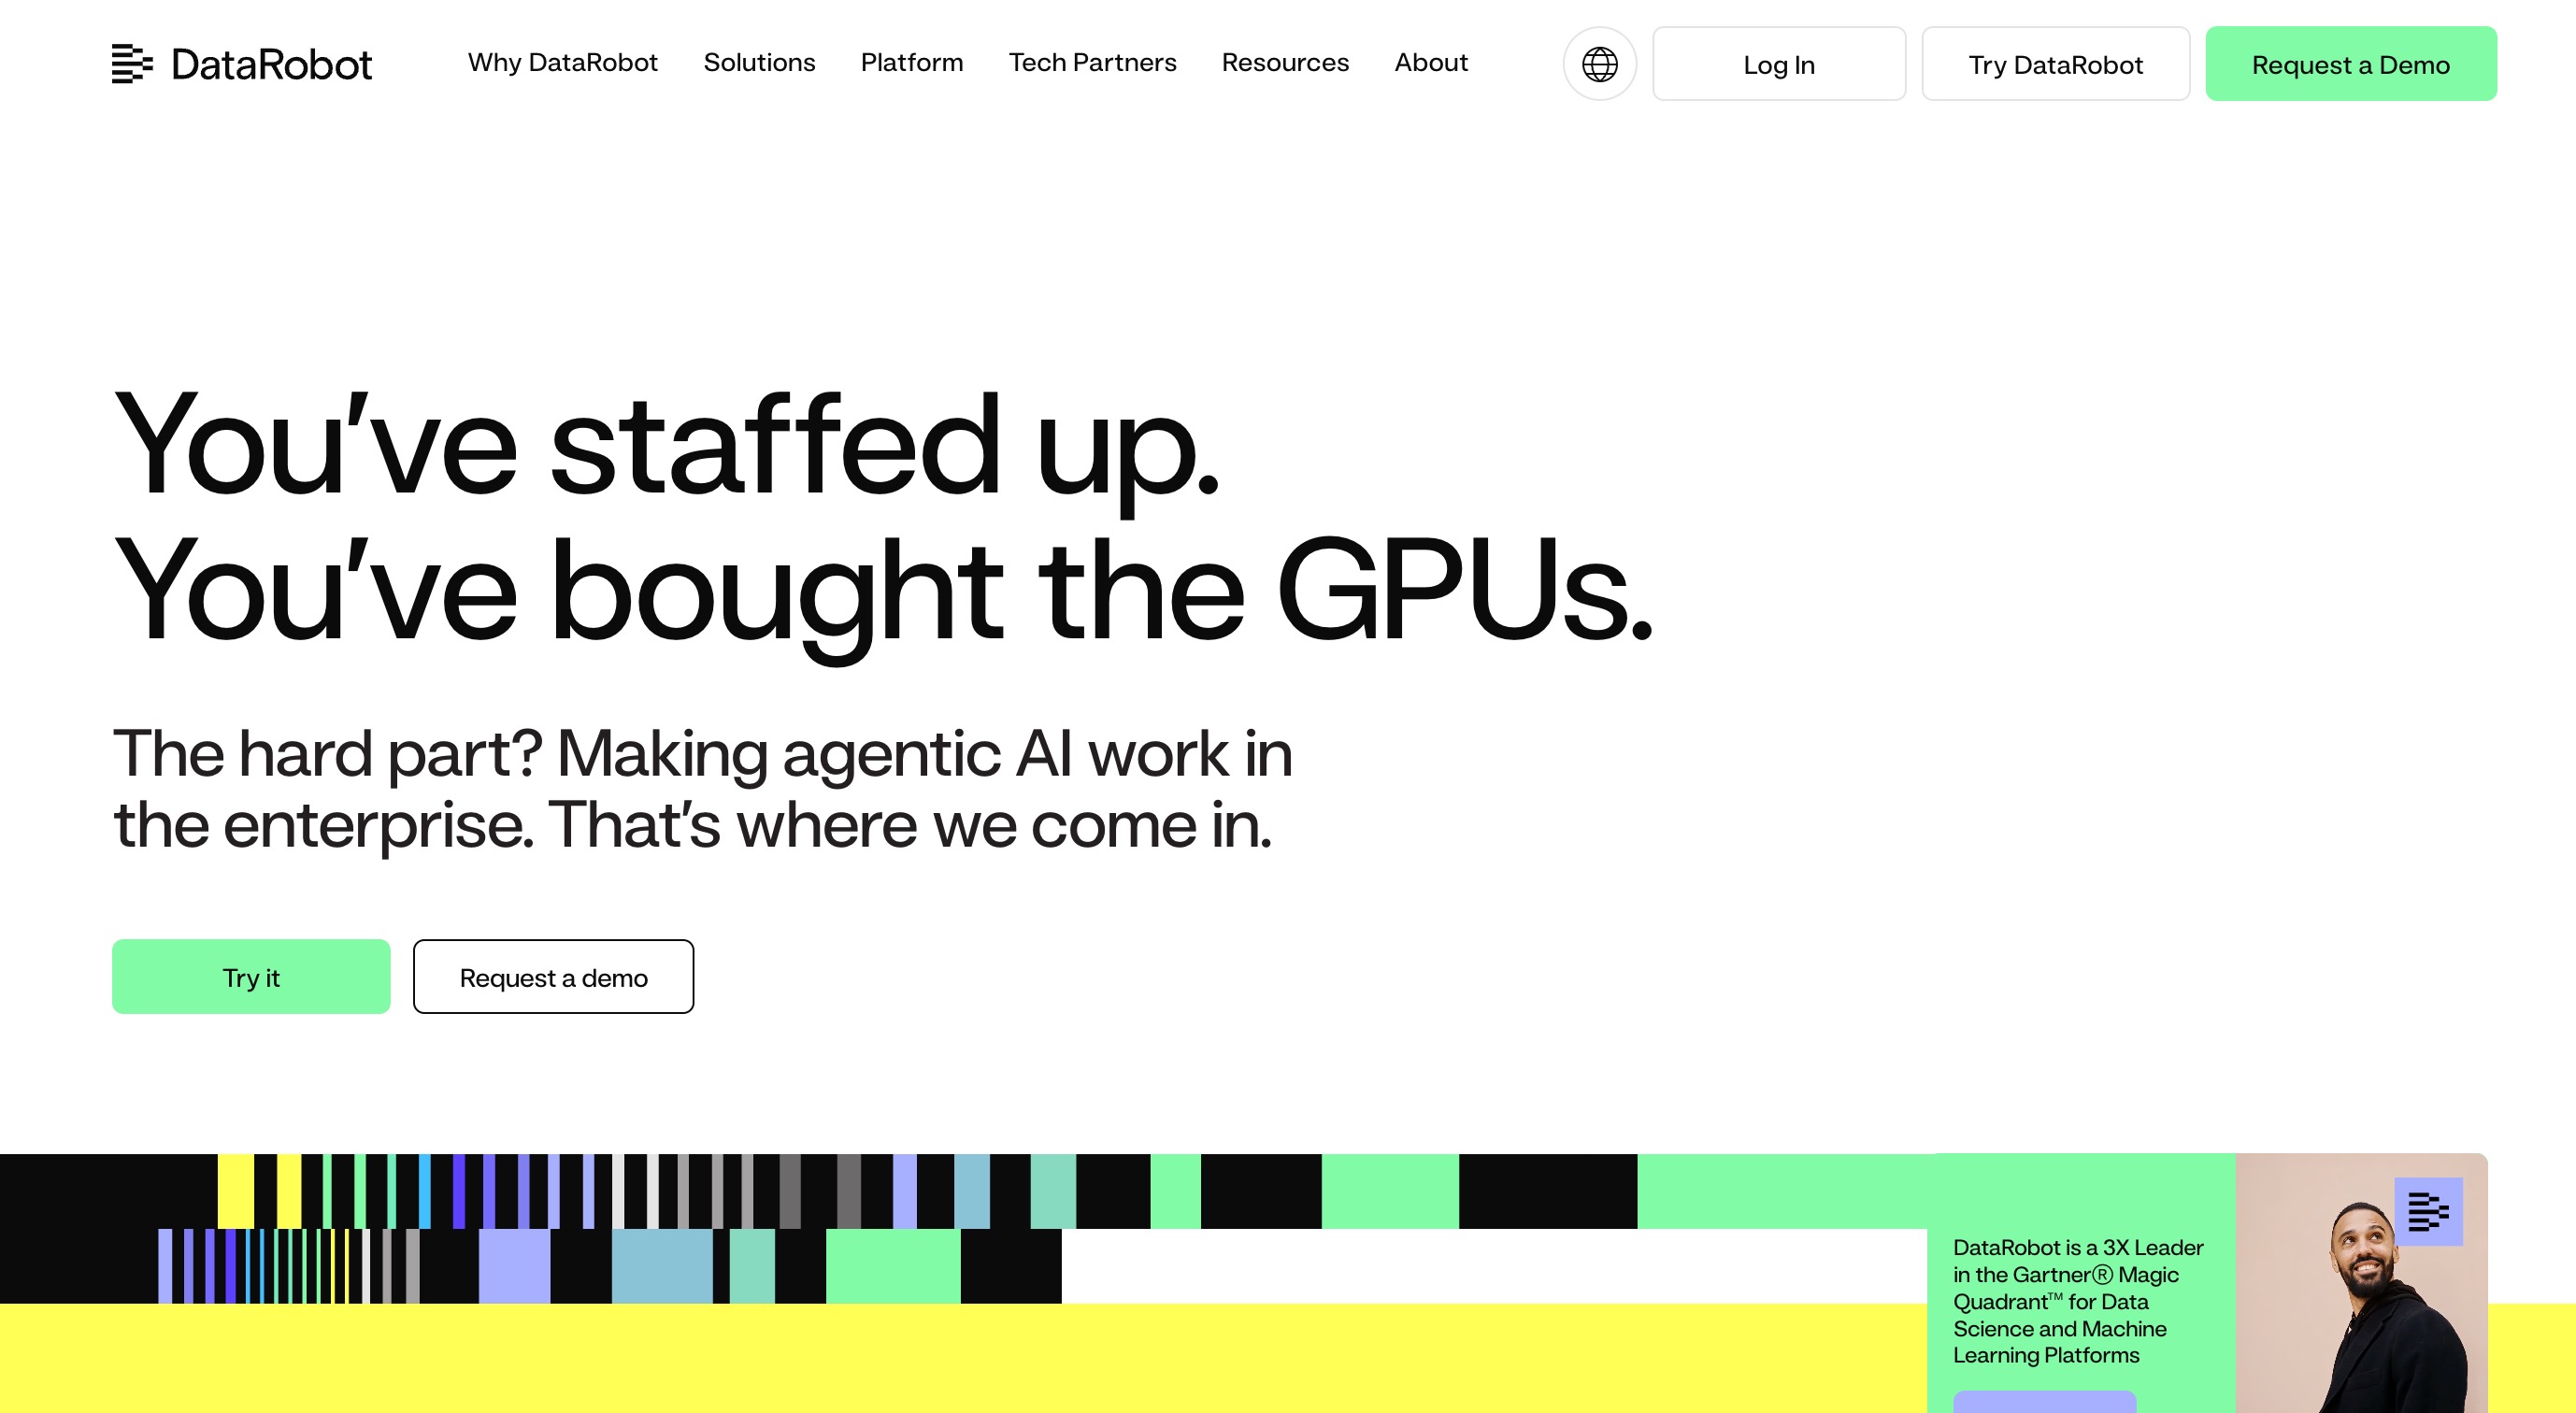
DataRobot is a heavy-hitting enterprise AI platform designed to automate the machine learning lifecycle. It excels in time-series forecasting by allowing organizations to build and deploy highly accurate predictive models rapidly. It is heavily utilized by large enterprises with massive, complex datasets.
Key Features
Automated Machine Learning (AutoML) for time-series.
Built-in backtesting and model validation.
Advanced anomaly detection across multiple variables.
Pros
Incredibly powerful and scalable for massive enterprise datasets.
Provides deep transparency into how models generate predictions.
Cons
Extremely expensive for small to medium-sized businesses.
Requires a fundamental understanding of data science to maximize its potential.
Pricing
Custom enterprise pricing (typically starting in the tens of thousands of dollars annually).
3. H2O.ai
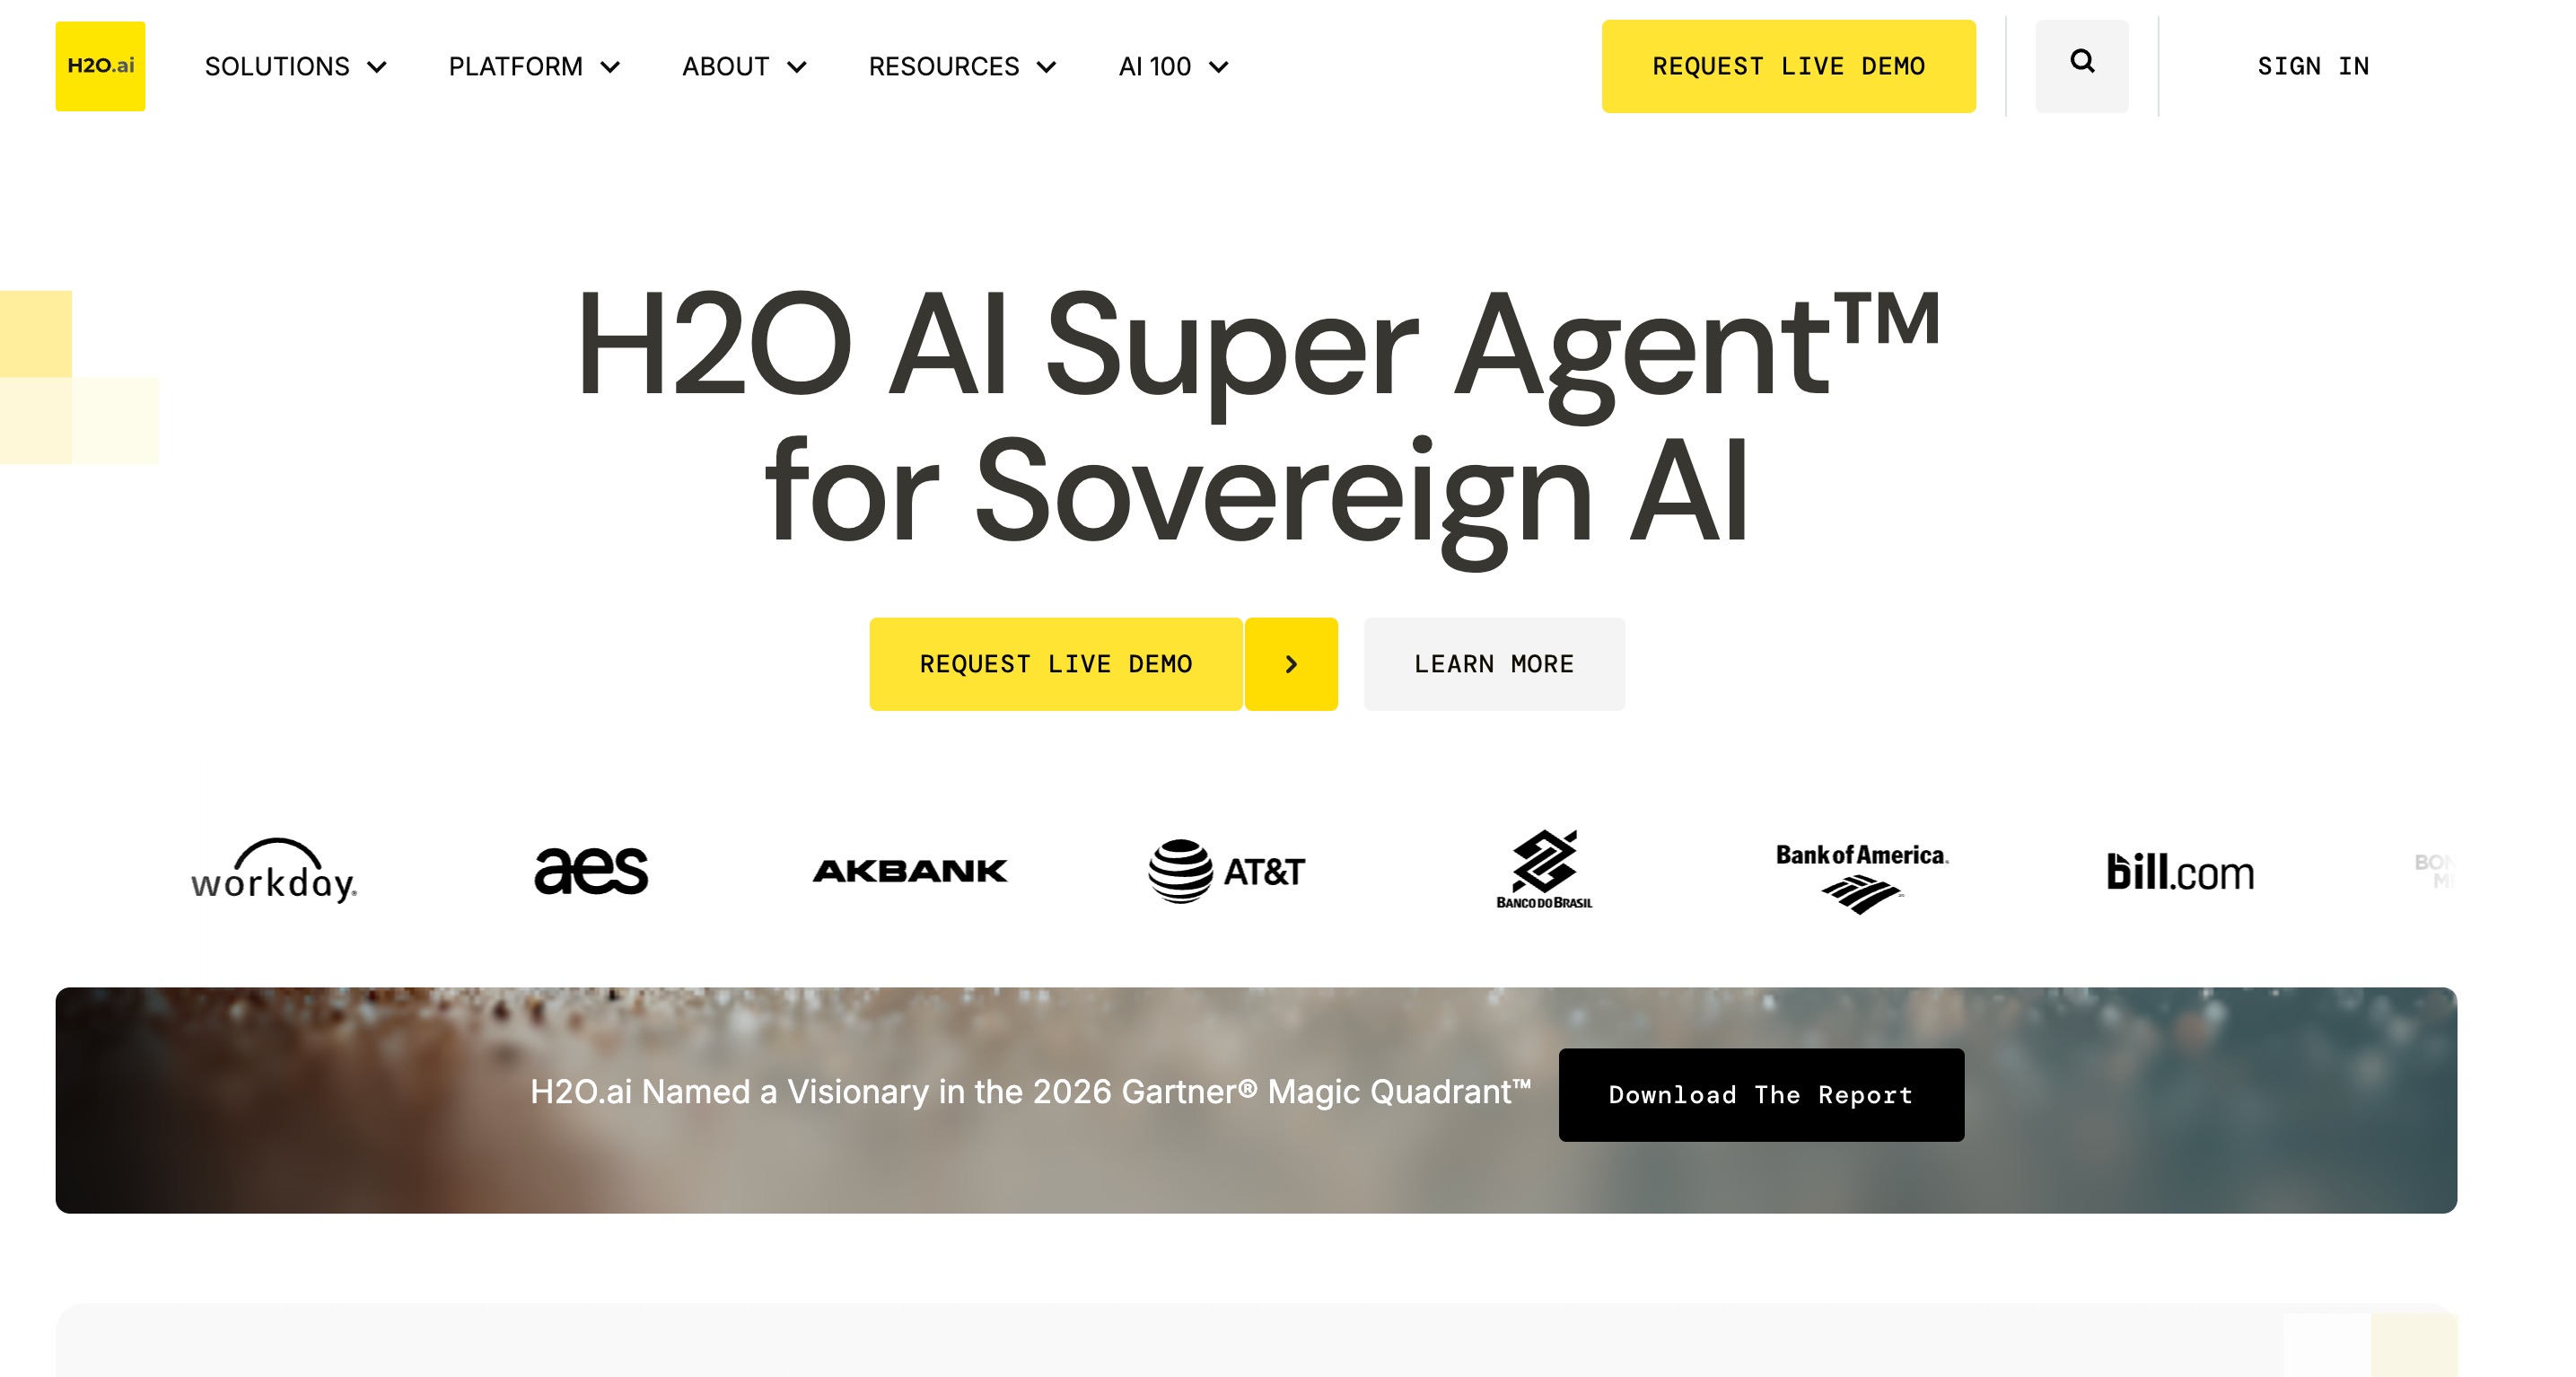
H2O.ai offers both open-source machine learning frameworks and its flagship commercial product, H2O Driverless AI. It is highly regarded for its time-series recipes, which automatically engineer features like lags and rolling windows to create highly accurate forecasts.
Key Features
Automated feature engineering specifically for time-series.
Support for multiple algorithms (ARIMA, Prophet, Deep Learning).
High-performance distributed computing.
Pros
Produces state-of-the-art predictive accuracy.
Strong community support and open-source foundation.
Cons
The interface can be intimidating for non-technical users.
Setup and deployment often require dedicated IT resources.
Pricing
Free open-source version; Custom pricing for enterprise Driverless AI.
4. Alteryx
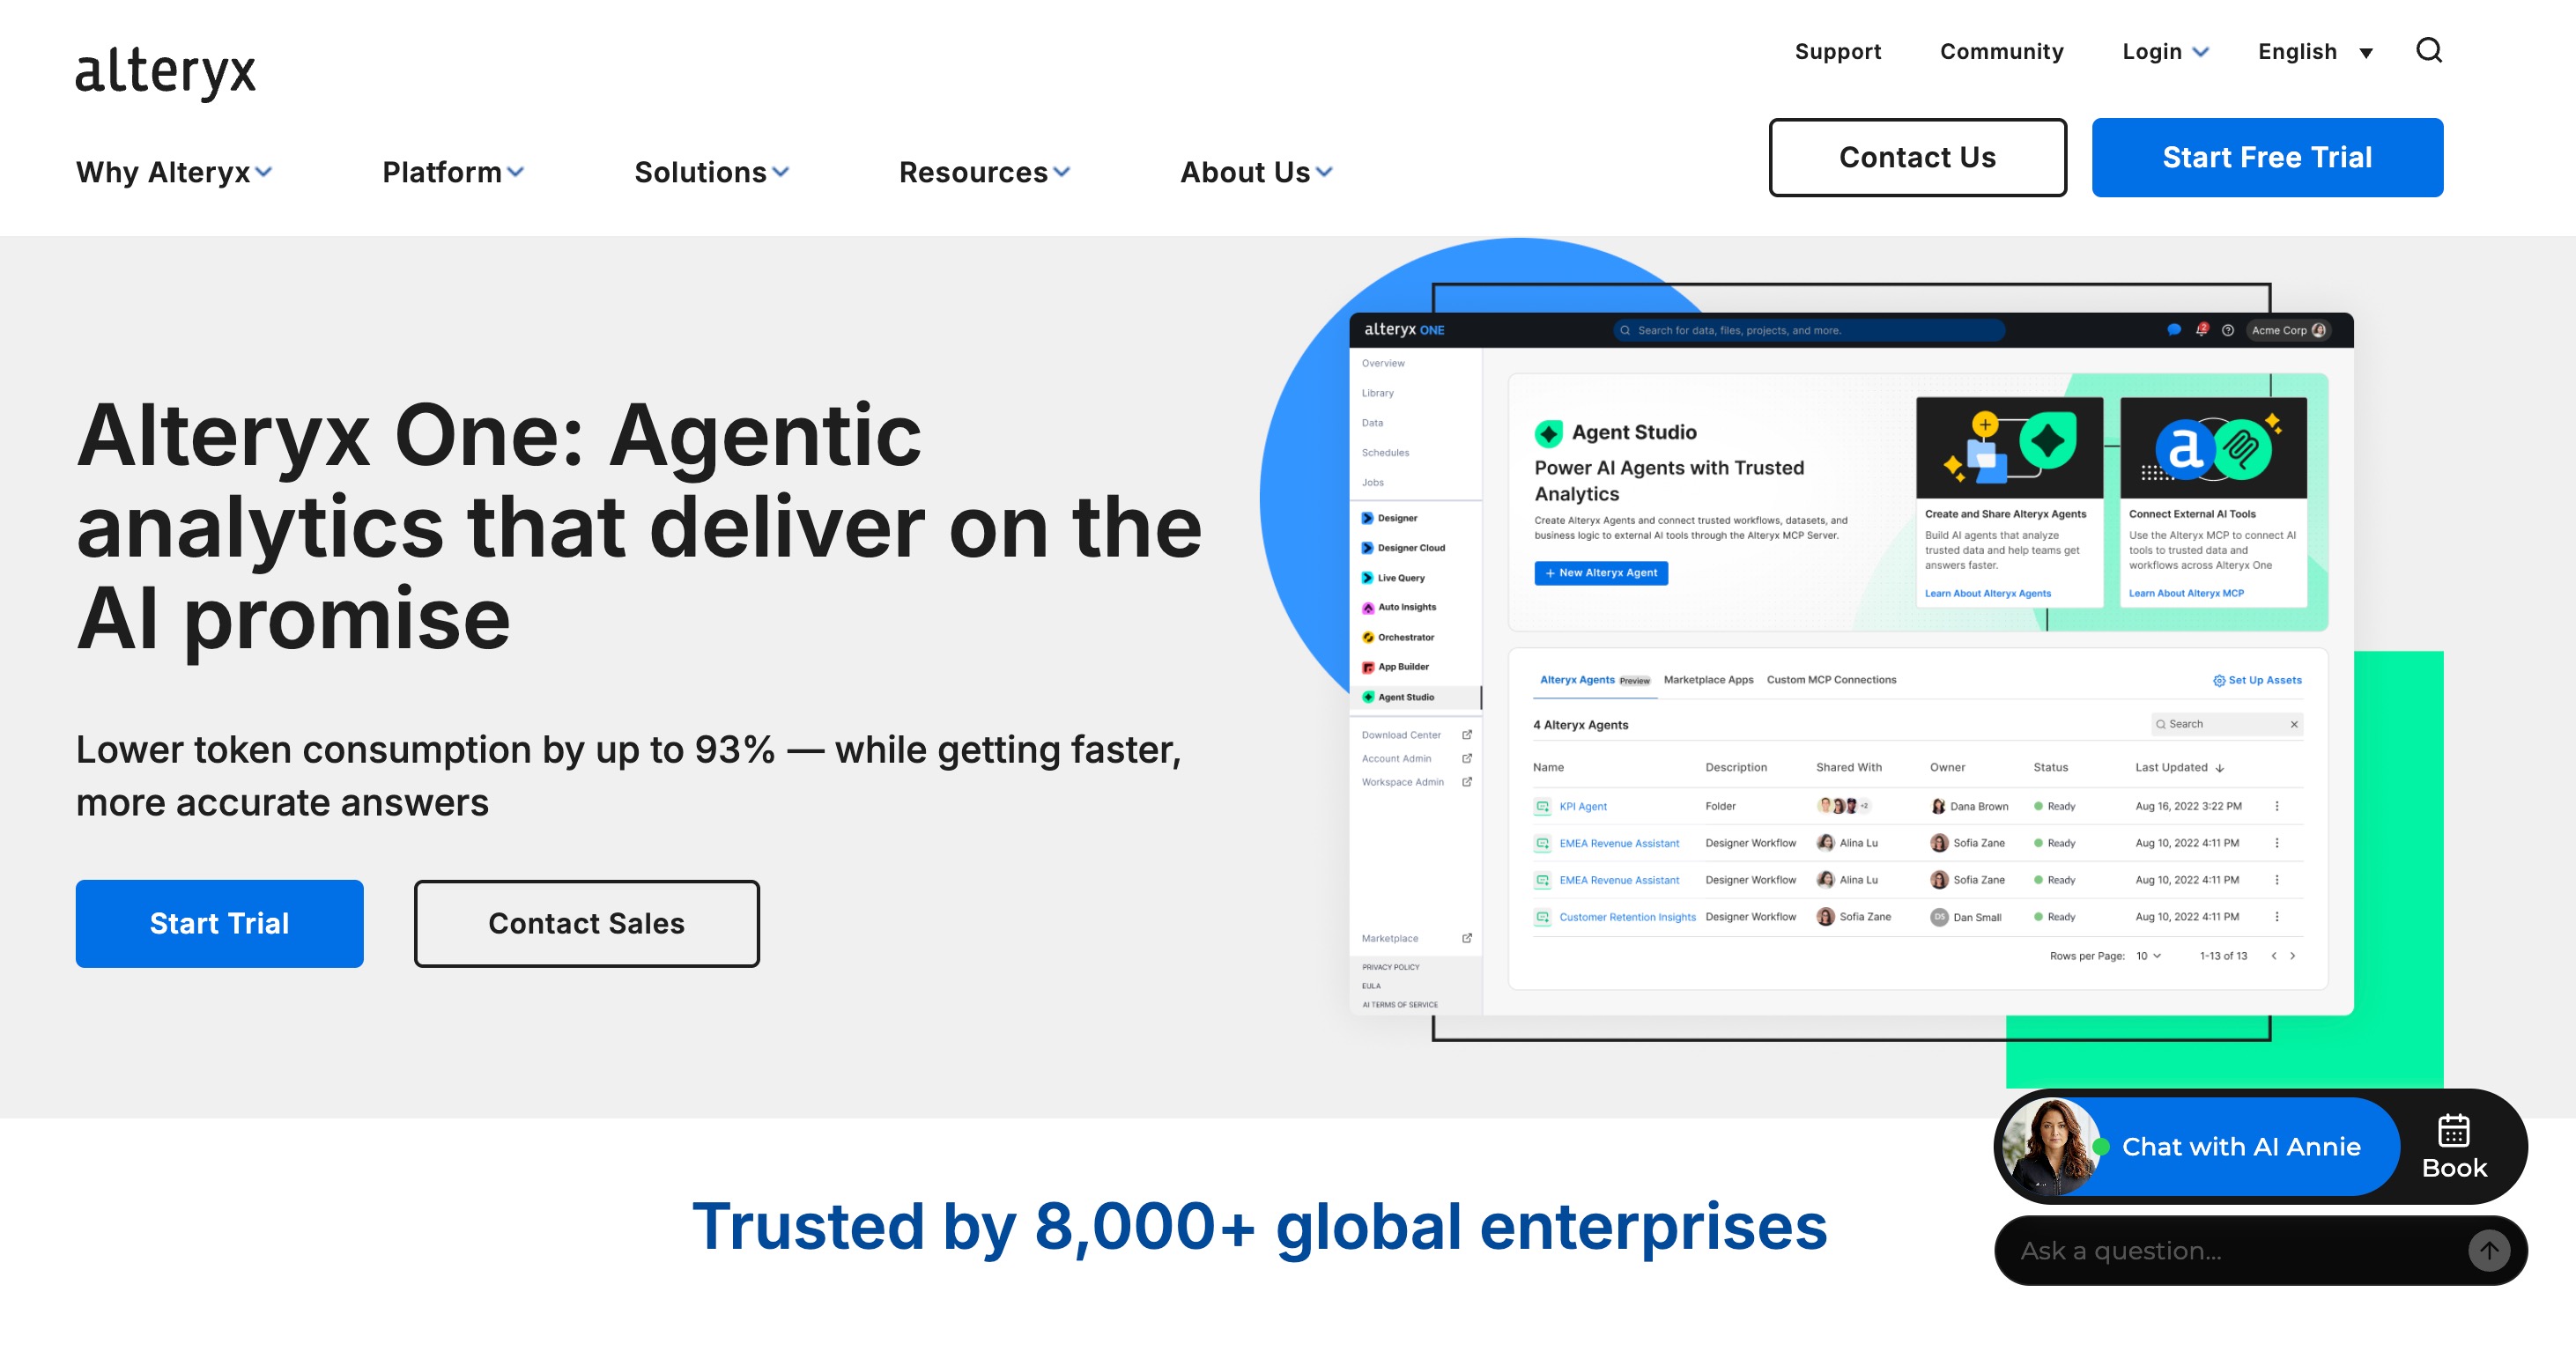
Alteryx is an analytics automation platform famous for its intuitive drag-and-drop interface. It allows data analysts to blend messy data and apply predictive time-series models without needing to write code, bridging the gap between data prep and AI.
Key Features
Visual, low-code/no-code canvas.
Pre-built time-series forecasting tools (ARIMA, ETS).
Extensive data blending and cleansing capabilities.
Pros
Exceptional at handling messy, disparate data sources.
Highly intuitive visual workflow builder.
Cons
Very high cost per user.
Primarily a Windows desktop application, which can limit cloud collaboration.
Pricing
Custom pricing.
5. Julius AI
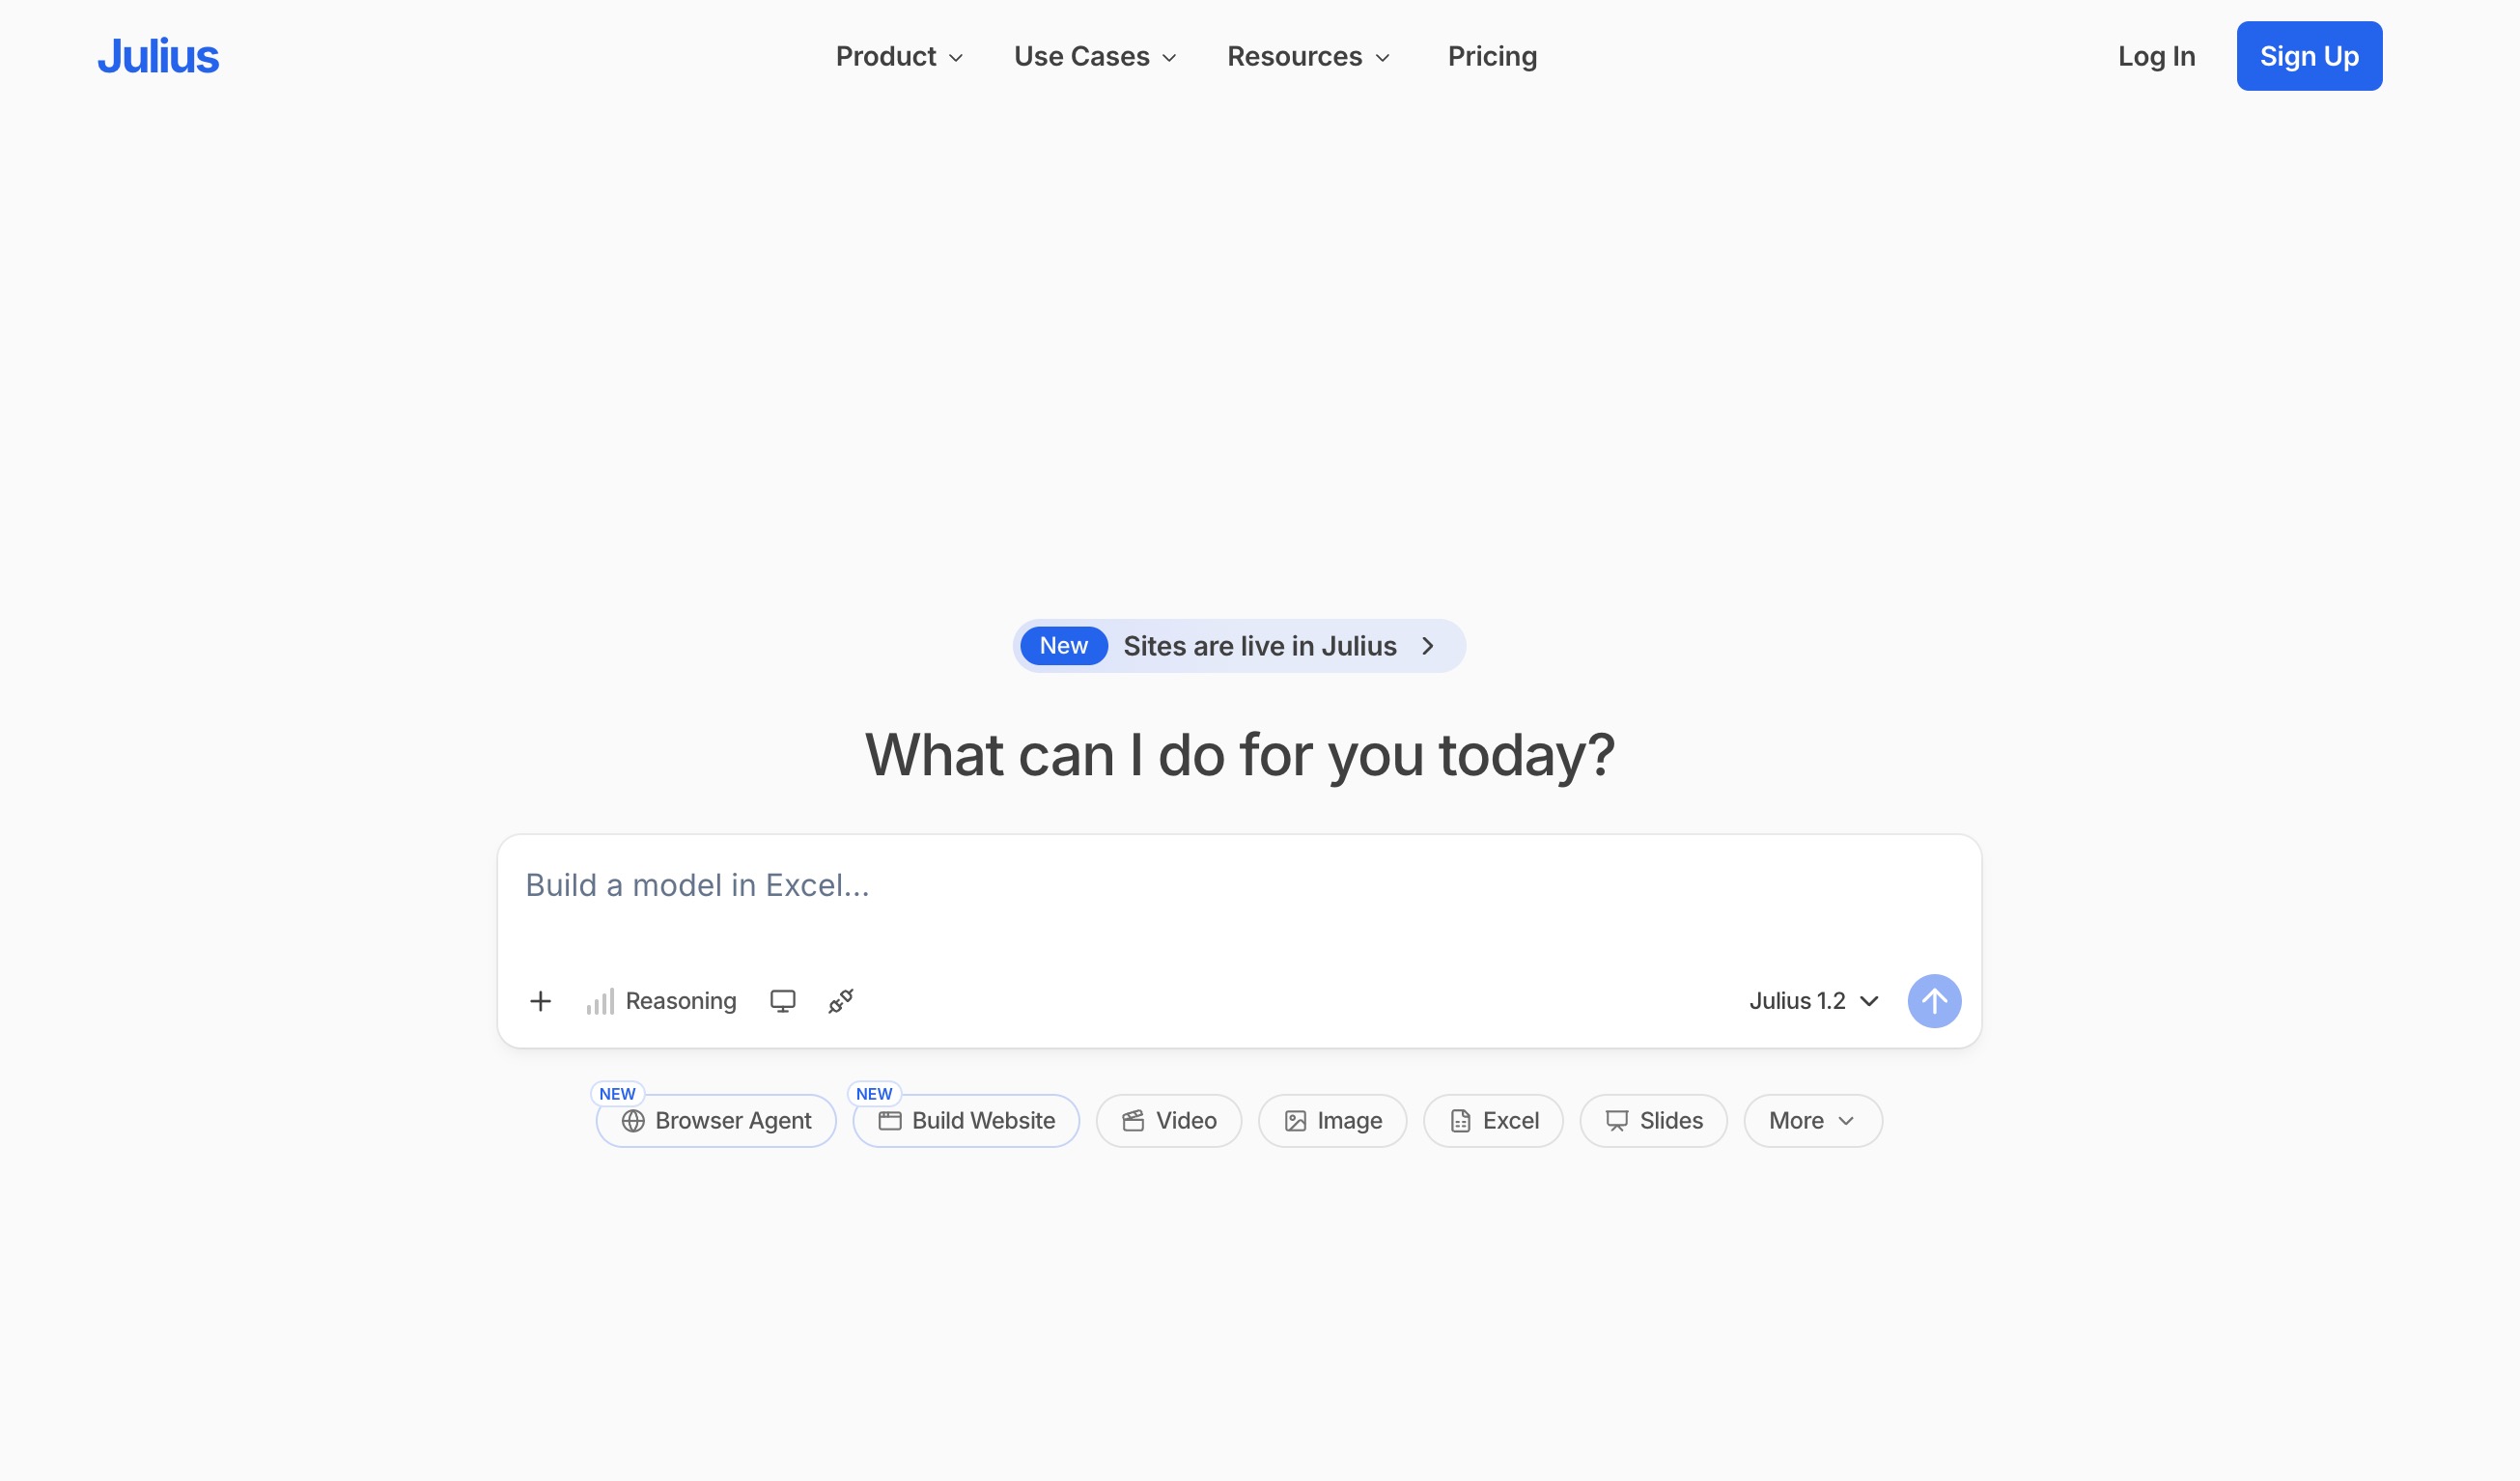
Julius AI is a conversational AI data analyst that allows users to chat with their datasets. By uploading spreadsheets, users can prompt Julius to run time-series regressions, highlight trends, and output clean graphs entirely through a chat interface.
Key Features
Chat-based data interaction.
Automatic Python code generation under the hood.
Instant chart and graph creation.
Pros
Very low barrier to entry; highly user-friendly.
Fast generation of ad-hoc statistical models.
Cons
Lacks the deep, persistent memory structures found in platforms like Powerdrill Bloom.
Not designed for automated, scheduled enterprise pipelines.
Pricing
Starts around $20/month.
6. Obviously AI
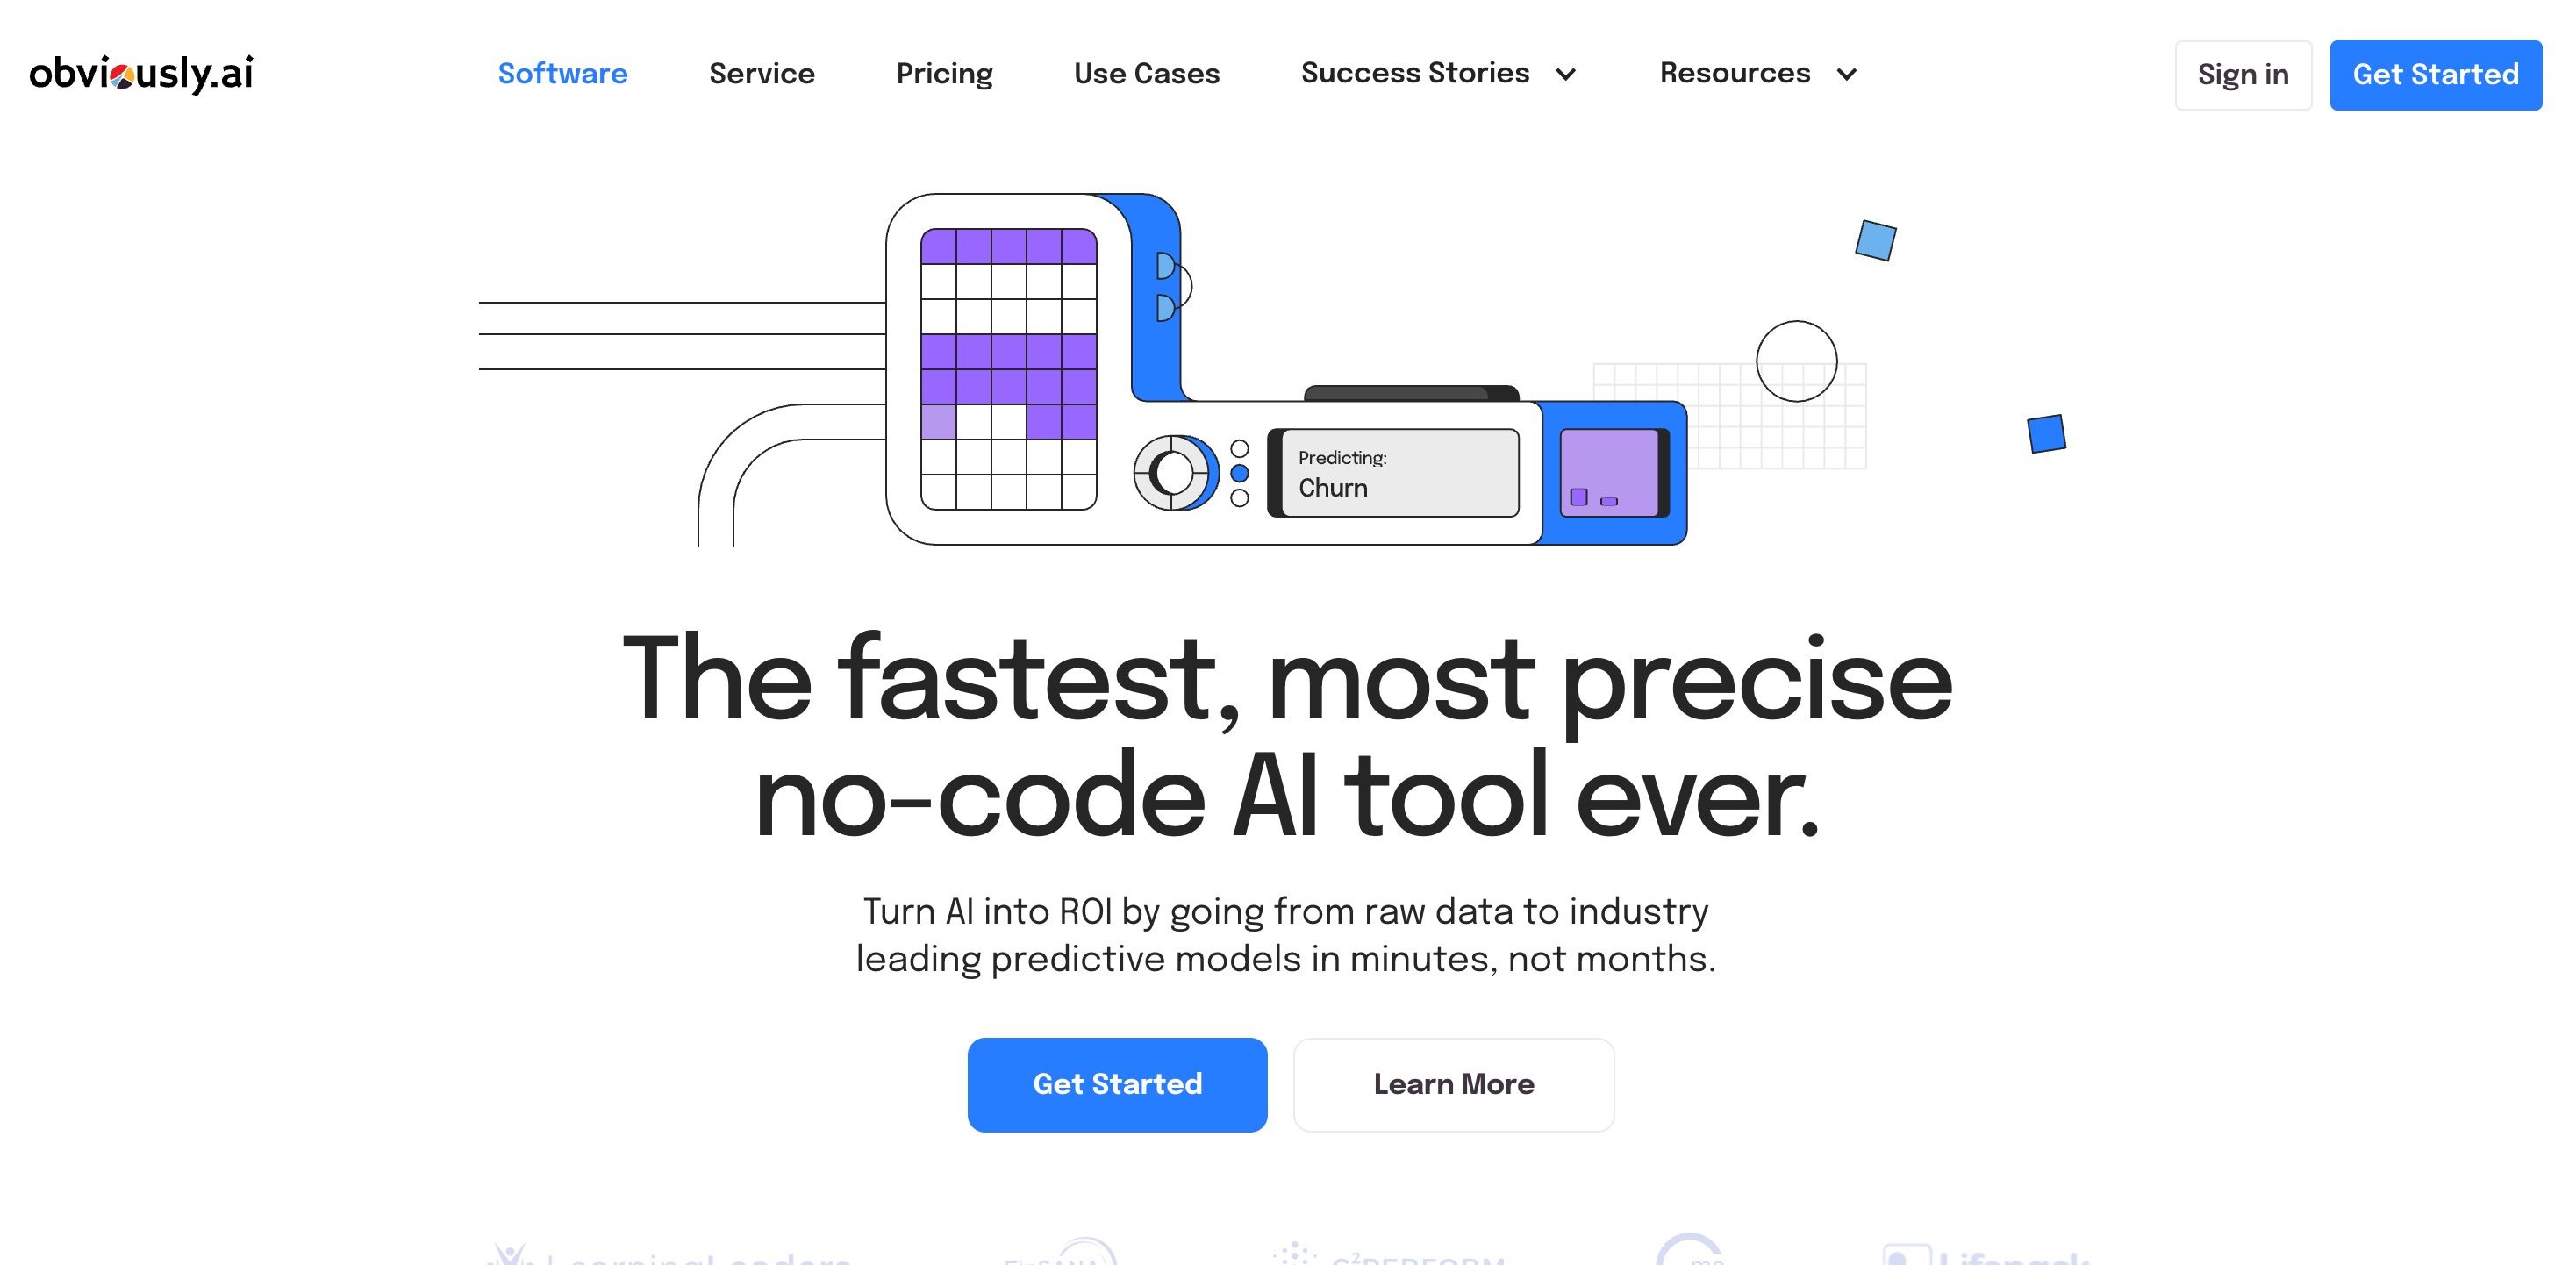
Obviously AI focuses on providing no-code machine learning. It specializes in allowing business users to predict outcomes, including time-series events like revenue or inventory demands, with just a few clicks based on historical tabular data.
Key Features
One-click time-series forecasting.
What-if scenario simulations.
Direct integrations with databases and CRM tools.
Pros
Incredibly fast time-to-value for business users.
Clean, modern, and simple user interface.
Cons
Limited ability to fine-tune algorithms manually.
Struggles with highly unstructured or exceptionally messy raw data.
Pricing
Custom pricing based on data rows and feature requirements.
7. Zerve
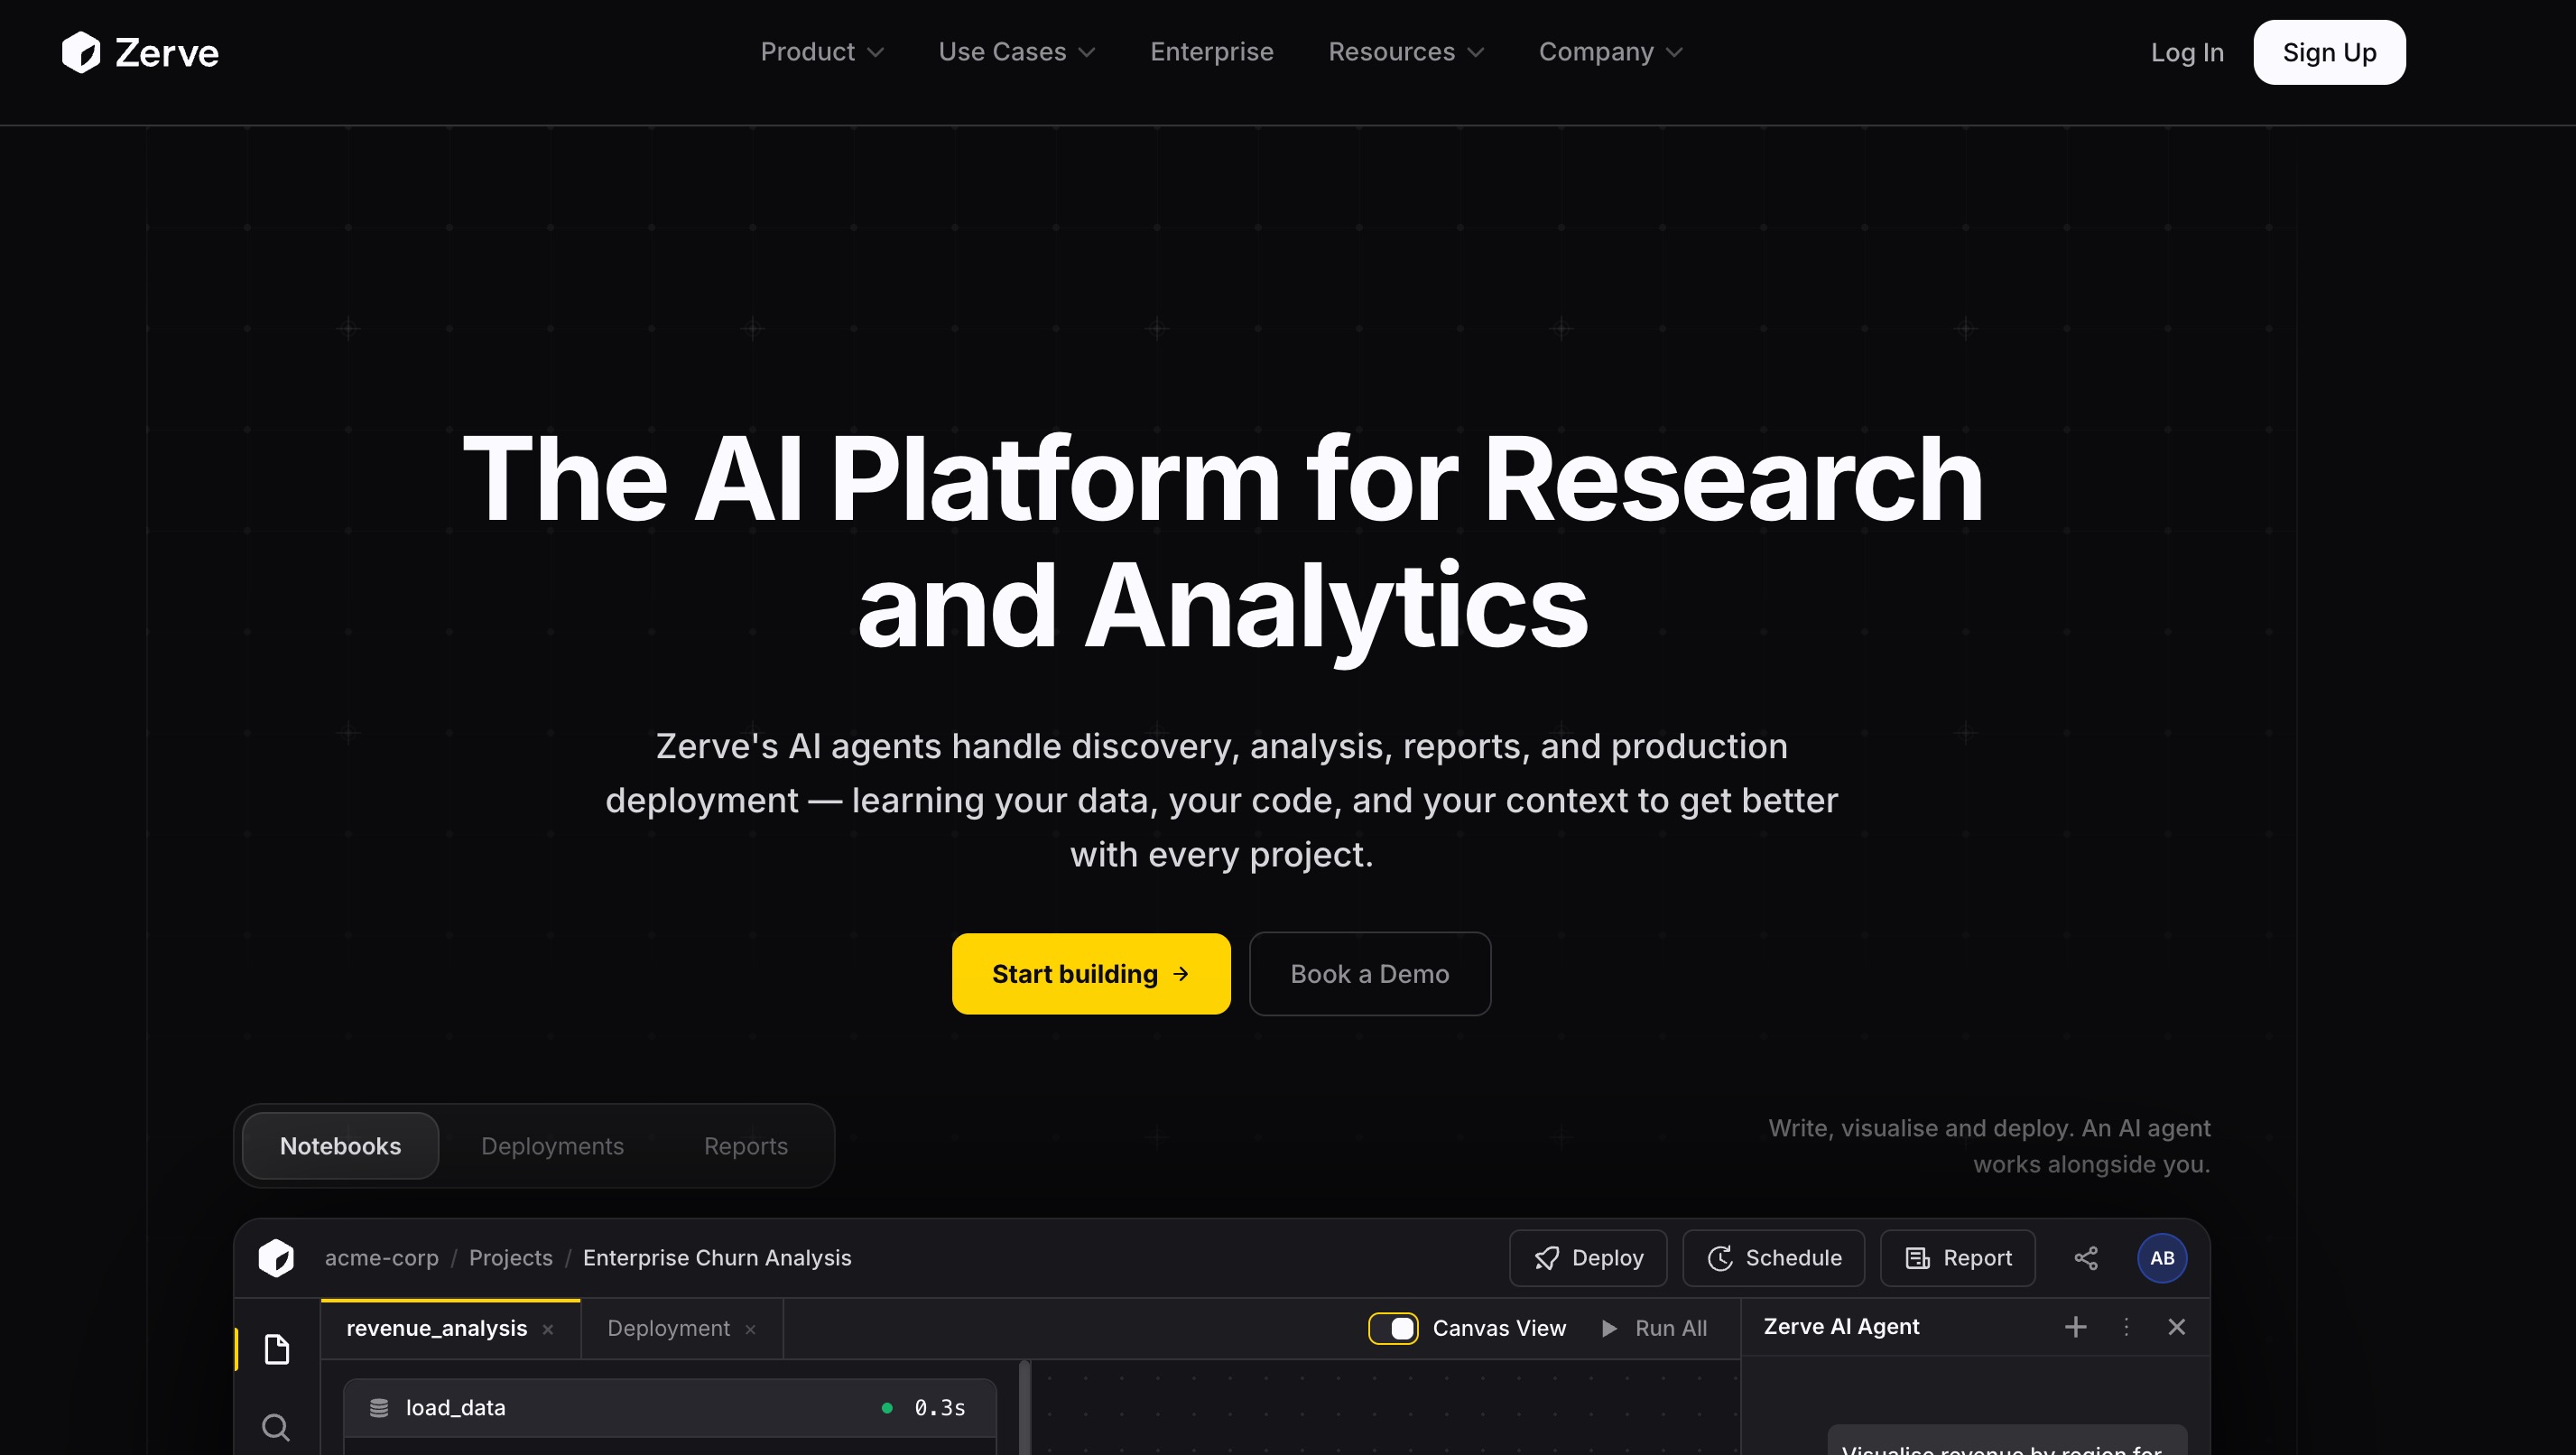
Zerve is a data science development environment designed for technical teams. While not a standalone forecasting "tool" in the traditional sense, its AI-assisted, code-first canvas is phenomenal for data scientists collaborating on complex time-series neural networks and ML models.
Key Features
Code-first environment (Python, SQL, R).
Visual canvas for code blocks and outputs.
AI coding assistant integrated into the workflow.
Pros
Unmatched flexibility and interoperability for technical teams.
Excellent collaboration features for data science squads.
Cons
Requires strong programming skills.
Not suitable for business stakeholders or marketing teams.
Pricing
Free tier available; Pro starts at $18.75/user/month.
8. Grafana
Grafana is the undisputed industry standard for operational dashboarding and observability. When it comes to time-series analysis for IT infrastructure, server loads, and real-time IoT sensor data, Grafana’s open-source visualization capabilities are unparalleled.
Key Features
Real-time time-series data visualization.
Seamless integration with time-series databases (Prometheus, InfluxDB).
Advanced alerting based on metric thresholds.
Pros
Exceptional for real-time monitoring and DevOps.
Massive library of community-built plugins.
Cons
Focused heavily on visualization and alerting, lacking native deep-predictive AI modeling.
Can be complex to configure initially.
Pricing
Free Open-Source; Grafana Cloud starts at $19/month.
9. Tableau
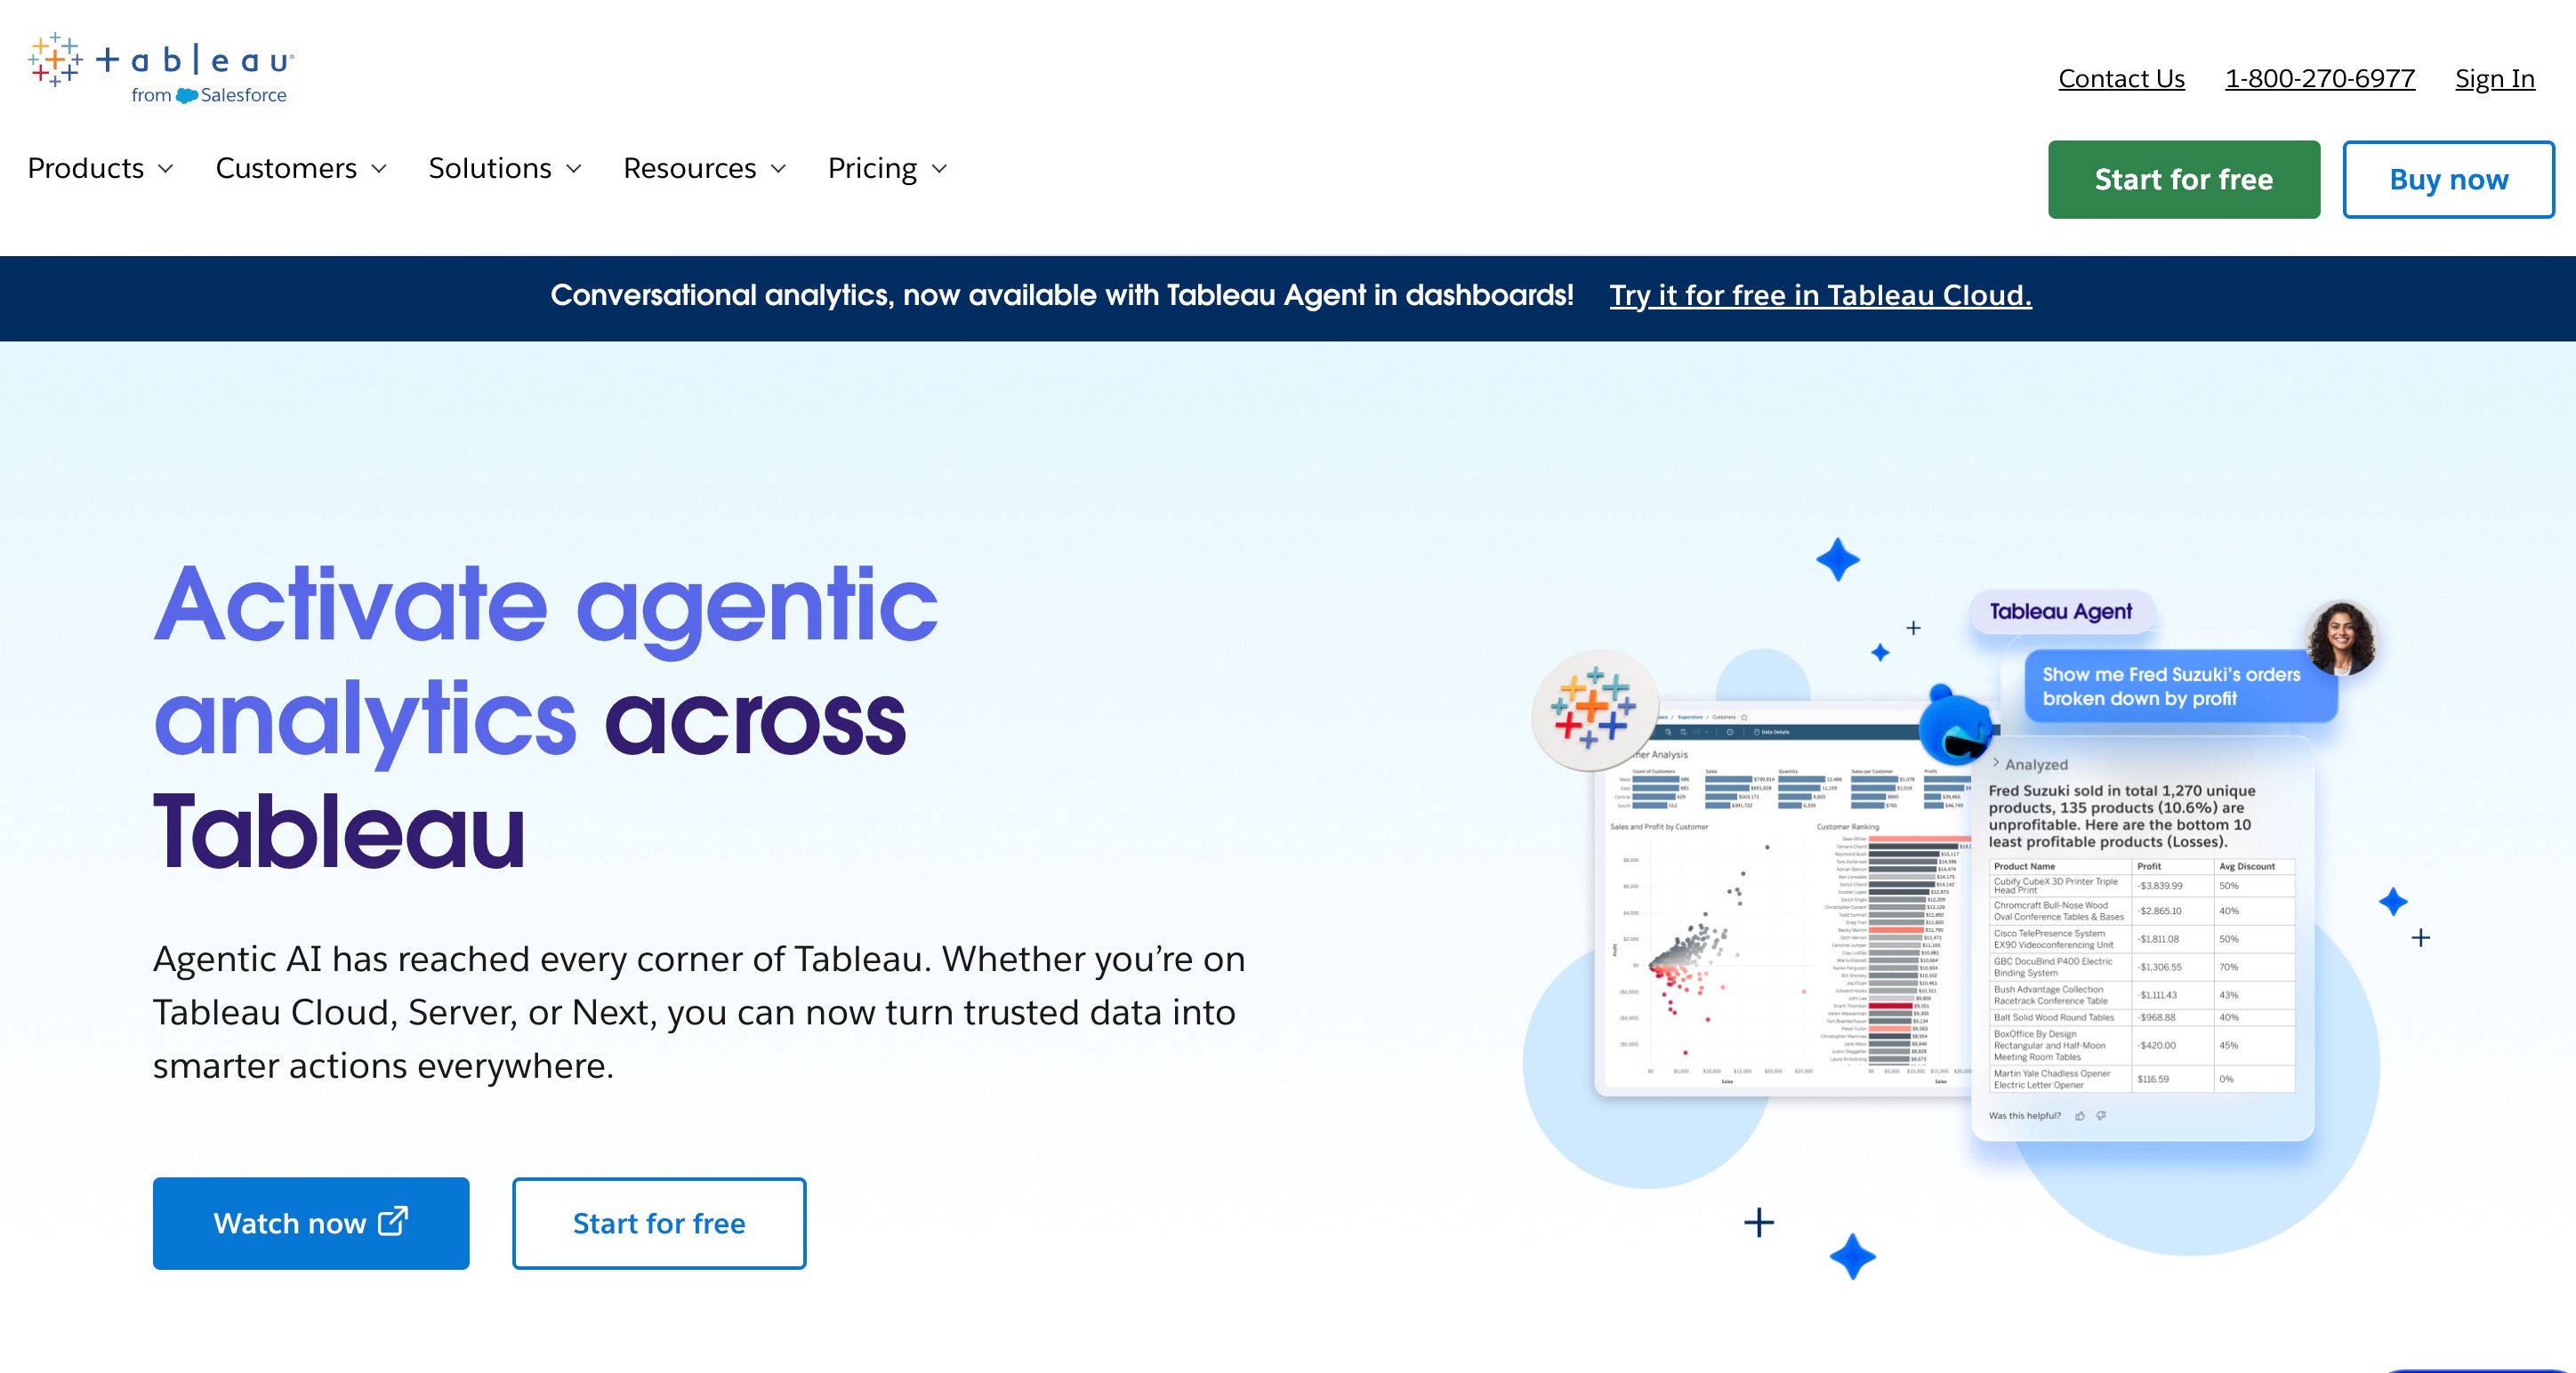
Tableau, a Salesforce company, is a titan in the Business Intelligence space. It includes built-in AI and statistical tools for time-series forecasting, allowing analysts to drag a time dimension into a view and instantly generate forward-looking trend lines.
Key Features
Built-in exponential smoothing for forecasting.
Interactive, highly customizable dashboards.
Integration with Salesforce Einstein AI.
Pros
Produces some of the most beautiful visualizations in the industry.
Deep integration into the enterprise BI stack.
Cons
Native forecasting algorithms are relatively basic compared to dedicated AI ML platforms.
Steep learning curve to master advanced dashboarding.
Pricing
Tableau plan starts at $15/user/month.
10. Amazon Forecast
Amazon Forecast is a fully managed AWS service that uses the same machine learning technology that powers Amazon.com. It is designed to process massive amounts of time-series data to forecast business outcomes with high accuracy.
Key Features
Fully managed AutoML for time-series.
Incorporates external variables (e.g., weather, holidays) automatically.
Highly scalable cloud infrastructure.
Pros
Deep integration with the AWS ecosystem (S3, Redshift).
Highly accurate for retail and supply chain forecasting.
Cons
Requires familiarity with AWS architecture.
The pay-as-you-go model can lead to unpredictable costs if not monitored.
Pricing
Pay-as-you-go based on data storage, training hours, and forecast endpoints.
11. Nixtla
Nixtla is revolutionizing the space by providing foundation models for time-series analysis, notably TimeGPT. Just as LLMs understand language, TimeGPT is pre-trained on billions of data points to understand time-series patterns natively without requiring bespoke training for every dataset.
Key Features
Pre-trained TimeGPT foundation model.
API-first approach for developers.
Zero-shot inference for instant forecasting.
Pros
State-of-the-art accuracy with minimal model training required.
Highly innovative approach to temporal data.
Cons
Requires programming knowledge (Python/API usage) to implement.
Lacks a native graphical user interface for non-technical users.
Pricing
Usage-based API pricing.
How to Choose the Right AI Tool for Time-Series Analysis
Selecting the perfect platform requires balancing your team's technical capabilities with your organizational goals. Here is how to navigate the selection process:
Evaluate Your Team’s Technical Expertise: If your team consists of hardcore Python developers, a foundation model API like Nixtla or a collaborative coding environment like Zerve will be highly effective. If your users are primarily business analysts or managers, you must prioritize platforms with natural language interfaces and visual workflows.
Determine Your Primary Use Case: Are you monitoring real-time server health? Grafana is the undeniable champion. Are you building massive, enterprise-wide machine learning pipelines? DataRobot or H2O.ai will suit your needs. However, if your goal is generating business insights, reports, and forecasts from CSVs or Excel files, an all-in-one workspace is ideal.
Assess Budget and Scalability: Enterprise tools like Alteryx and DataRobot come with massive price tags and long implementation cycles. Ensure the tool you choose matches your budget while still offering the scalability to grow as your data needs expand.
Prioritize End-to-End Workflow Capabilities: Many tools stop at simply outputting a number. You should look for a tool that objectively handles the whole process. While other platforms offer excellent niche features, Powerdrill Bloom stands out by acting as an end-to-end partner. Instead of bouncing between a data cleaning tool, a forecasting algorithm, and a presentation creator, Powerdrill Bloom allows you to upload raw data, query it in plain English, and have the AI generate the insights, charts, and final reports all within one persistent workspace enhanced by its MemoryLake technology.
Final Verdict
Our final verdict points directly to Powerdrill Bloom. It breaks the mold of traditional analytical tools by offering a holistic, AI-powered workspace. Because Powerdrill Bloom actively participates in the entire workflow—from data ingestion and trend identification to report generation and task execution—it eliminates the friction usually associated with time-series modeling. With its persistent Workspaces and MemoryLake ensuring your business context is never lost, Powerdrill Bloom is the ultimate tool for turning complex temporal data into immediate, presentation-ready insights.
Frequently Asked Questions
1. What is time-series analysis?
It analyzes data points collected over time to identify trends, seasonality, and forecast future patterns accurately.
2. Can AI improve time-series forecasting?
Yes, AI handles complex, non-linear relationships and massive datasets much better than traditional statistical forecasting methods.
3. Do I need coding skills for AI analysis?
Not necessarily. Tools like Powerdrill Bloom use natural language processing, allowing you to analyze data without coding.
4. What data formats work for time-series?
Most tools accept CSV, Excel, or SQL databases containing a timestamp column and corresponding metric values.
5. Why choose Powerdrill Bloom for time-series?
It offers an end-to-end workspace, persistent memory, and natural language queries, turning raw data into actionable insights instantly.