Data Fact: S&P 500-to-Bitcoin Ratio Breaks Above 200-Week Average for First Time
In the ever-evolving landscape of global finance, certain milestones serve as structural alarm bells, signaling profound shifts in market psychology, institutional capital flows, and macroeconomic regimes. As of August 6, 2026, the financial world has witnessed one such unprecedented event: the ratio of the S&P 500 to Bitcoin (SPX/BTC) has risen above its trailing 200-week moving average (MA) for the first time in the metric’s history.
For nearly fifteen years, Bitcoin has been the undisputed champion of relative performance. Through multiple boom-and-bust cycles, the overarching narrative remained consistent: over any multi-year horizon, Bitcoin would reliably outpace traditional equities, compressing the SPX/BTC ratio to lower and lower lows. However, the current crossover represents a massive divergence in the trajectories of traditional equities and digital assets. With the S&P 500 continuously forging new all-time highs fueled by artificial intelligence capital expenditures and resilient earnings, and Bitcoin correcting sharply from its late-2025 peaks, this historic crossover forces investors to ask a critical question: Are we witnessing a temporary mean-reversion, or a permanent regime shift in asset class dominance?
To understand the magnitude of this event, we must dissect the individual components driving this ratio, the historical context of the 200-week moving average, and the dual frameworks through which quantitative analysts are interpreting this signal.
Understanding the Signal: The SPX/BTC Ratio
The SPX/BTC ratio is a straightforward yet highly revealing metric. It measures how many Bitcoins are required to purchase one hypothetical "share" of the S&P 500 index. A falling ratio indicates that Bitcoin is outperforming the S&P 500, while a rising ratio signifies that traditional equities are gaining ground against the premier cryptocurrency.
The 200-week moving average is widely regarded by market technicians as the ultimate arbiter of long-term trend direction. Because it smooths out approximately 3.8 years of price action, it effectively filters out short-term noise, seasonal volatility, and localized market euphoria or panic. A crossover above or below this line is rarely a fleeting anomaly; it is traditionally viewed as a multi-year structural signal.
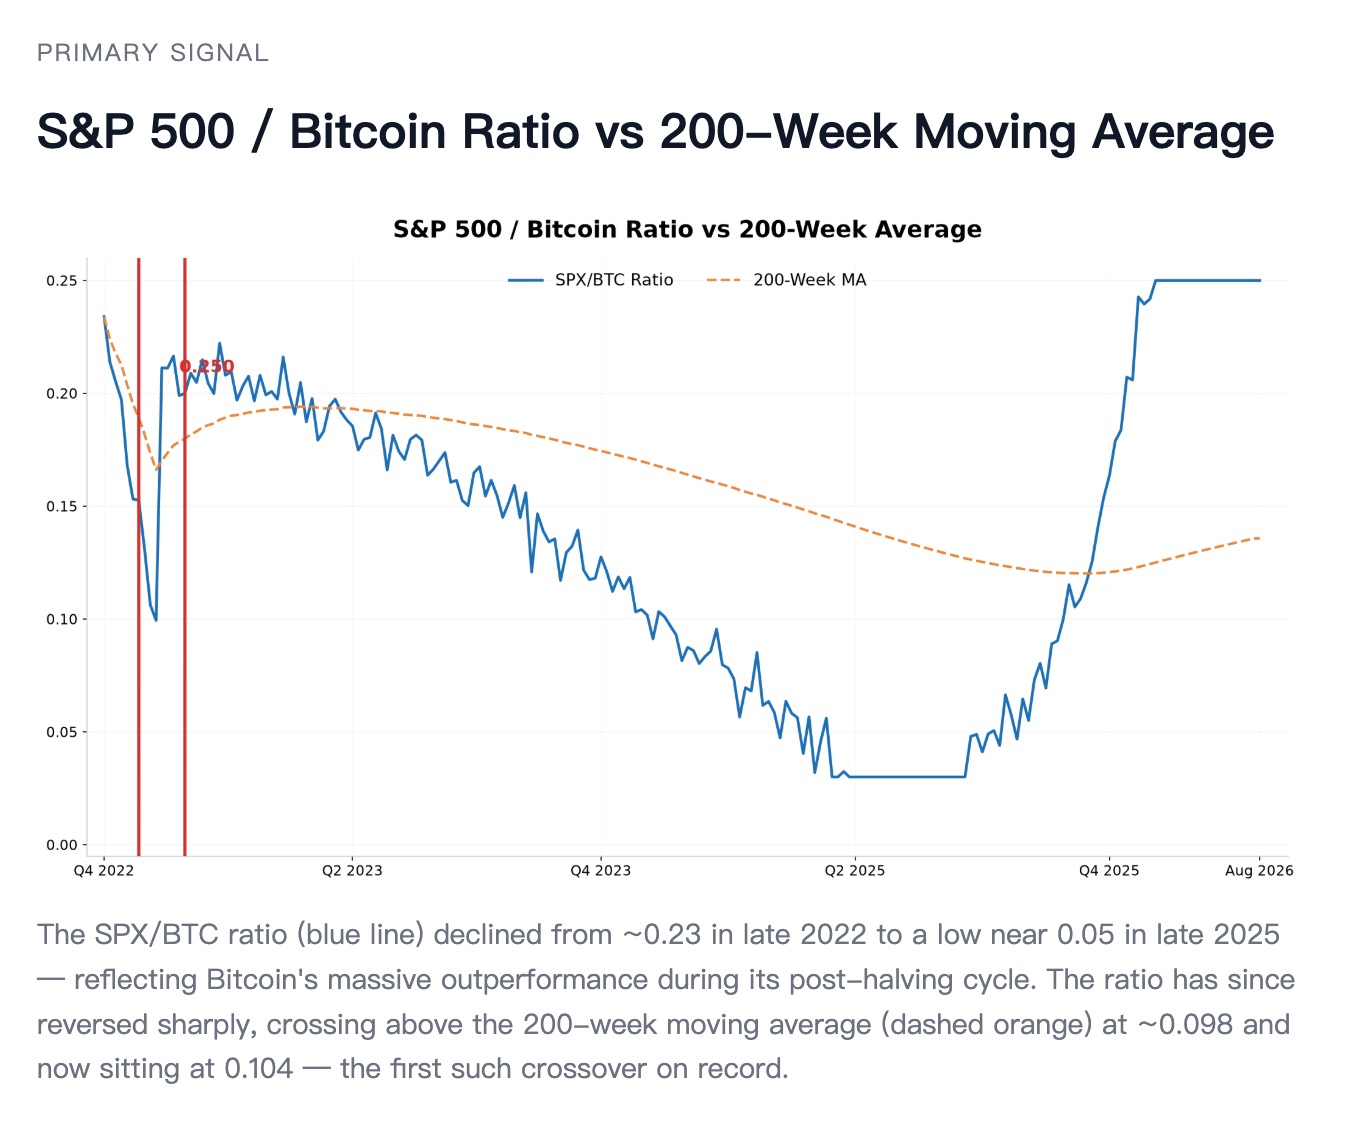
As illustrated in the chart above, the historical trajectory of the SPX/BTC ratio (the blue line) has been defined by a relentless downward slope. In late 2022, during the depths of the cryptocurrency bear market and aggressive central bank tightening, the ratio hovered around 0.23. As Bitcoin embarked on its massive post-halving and spot-ETF-driven bull cycle, the ratio collapsed, bottoming out near an astonishing 0.05 in late 2025. This meant that the purchasing power of Bitcoin relative to the broader stock market had more than quadrupled in just three years.
However, the narrative has violently reversed. Following the late-2025 crypto peak, the ratio surged upward, sharply crossing the 200-week moving average (the dashed orange line) at approximately 0.098. Today, the ratio sits at 0.104. This marks the very first time on record that the S&P 500 has clawed back enough relative momentum to break above this multi-year smoothing threshold.
The Equities Context: The S&P 500's Relentless Ascent
To fully grasp why this crossover is happening now, one must first look at the denominator of our equation—or rather, the traditional finance side of the scale. The S&P 500 has been on an absolute tear, defying pessimistic economic forecasts and leaving bearish analysts scrambling to adjust their models.
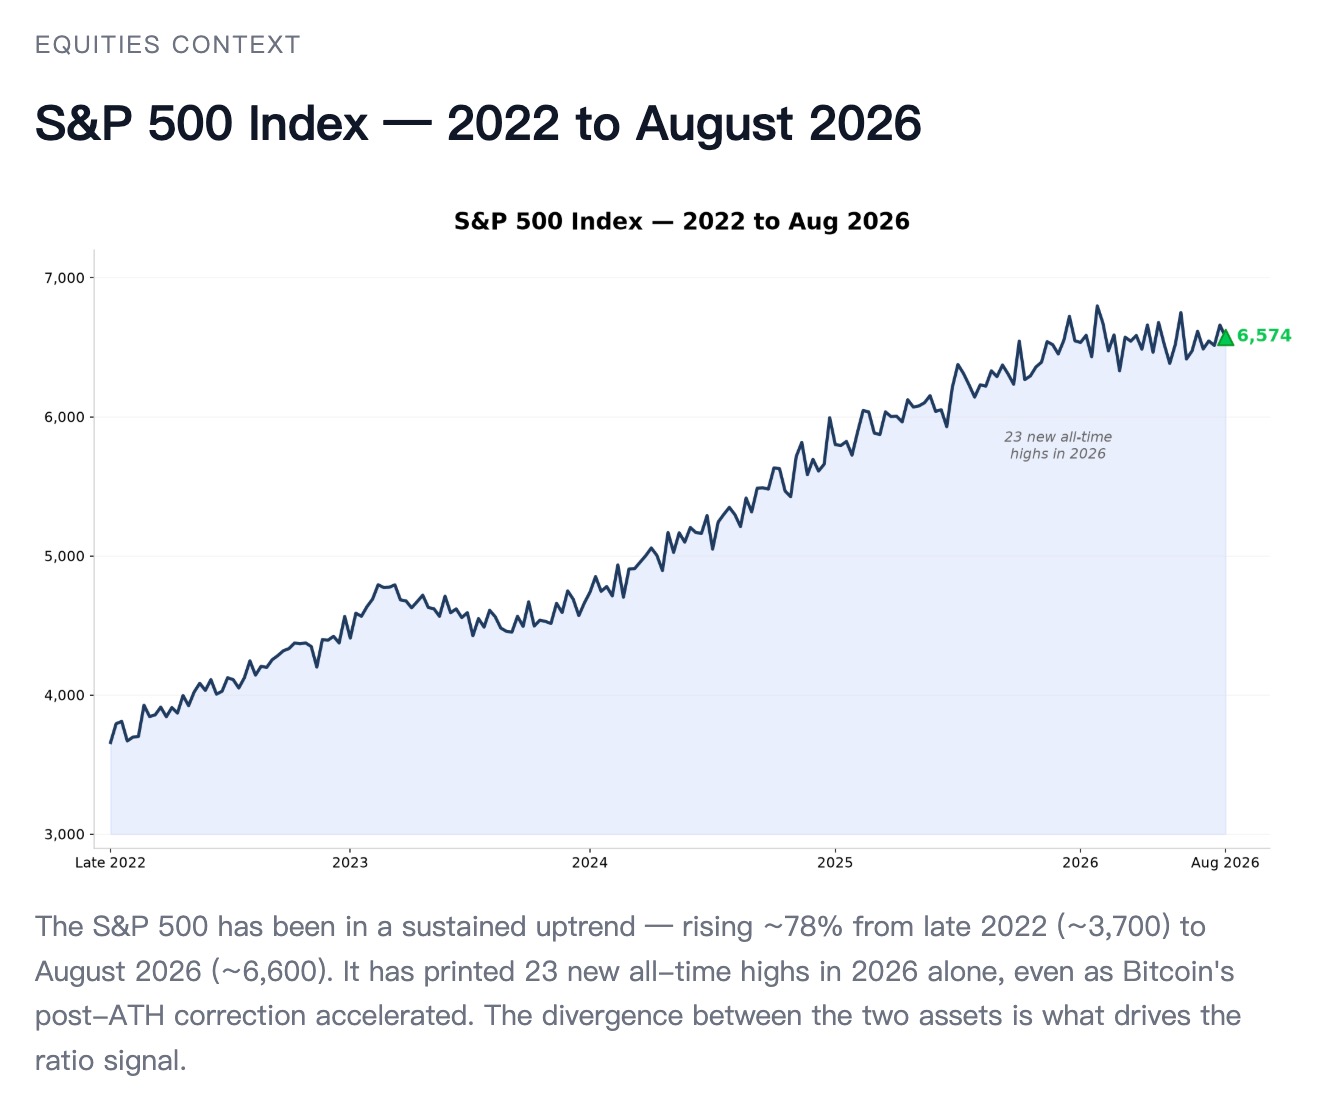
Since establishing a cyclical bottom near the 3,700 level in late 2022, the S&P 500 has staged a breathtaking ~78% rally, arriving at approximately 6,600 by August 2026. What makes this ascent truly remarkable is not just the magnitude of the gains, but the consistency of the momentum. In 2026 alone, the index has printed an astounding 23 new all-time highs.
This sustained uptrend is driven by a confluence of powerful macroeconomic and fundamental factors. The primary engine has been the explosion of artificial intelligence. Unlike the speculative tech bubbles of the past, the AI revolution of the mid-2020s has been accompanied by tangible, record-shattering earnings growth from mega-cap technology firms. Trillions of dollars in capital expenditure have flowed into data centers, semiconductor manufacturing, and software infrastructure, cementing the dominance of traditional equity markets.
Furthermore, the macroeconomic backdrop has provided a perfect tailwind. With inflation stabilizing and central banks globally engaging in synchronized, methodical rate cuts, institutional capital has found a comfortable, high-yield home in the stock market. The allure of AI-driven equities, combined with robust dividend yields and share buybacks, has created a formidable competitor for investment capital that previously might have flowed out on the risk curve into digital assets.
Bitcoin's Trajectory: A Textbook Post-Cycle Hangover
While the S&P 500 has been breaking records, Bitcoin has been experiencing a grueling, albeit technically standard, mid-cycle correction. The divergence between these two assets is the primary driver of the historic ratio signal we are observing today.
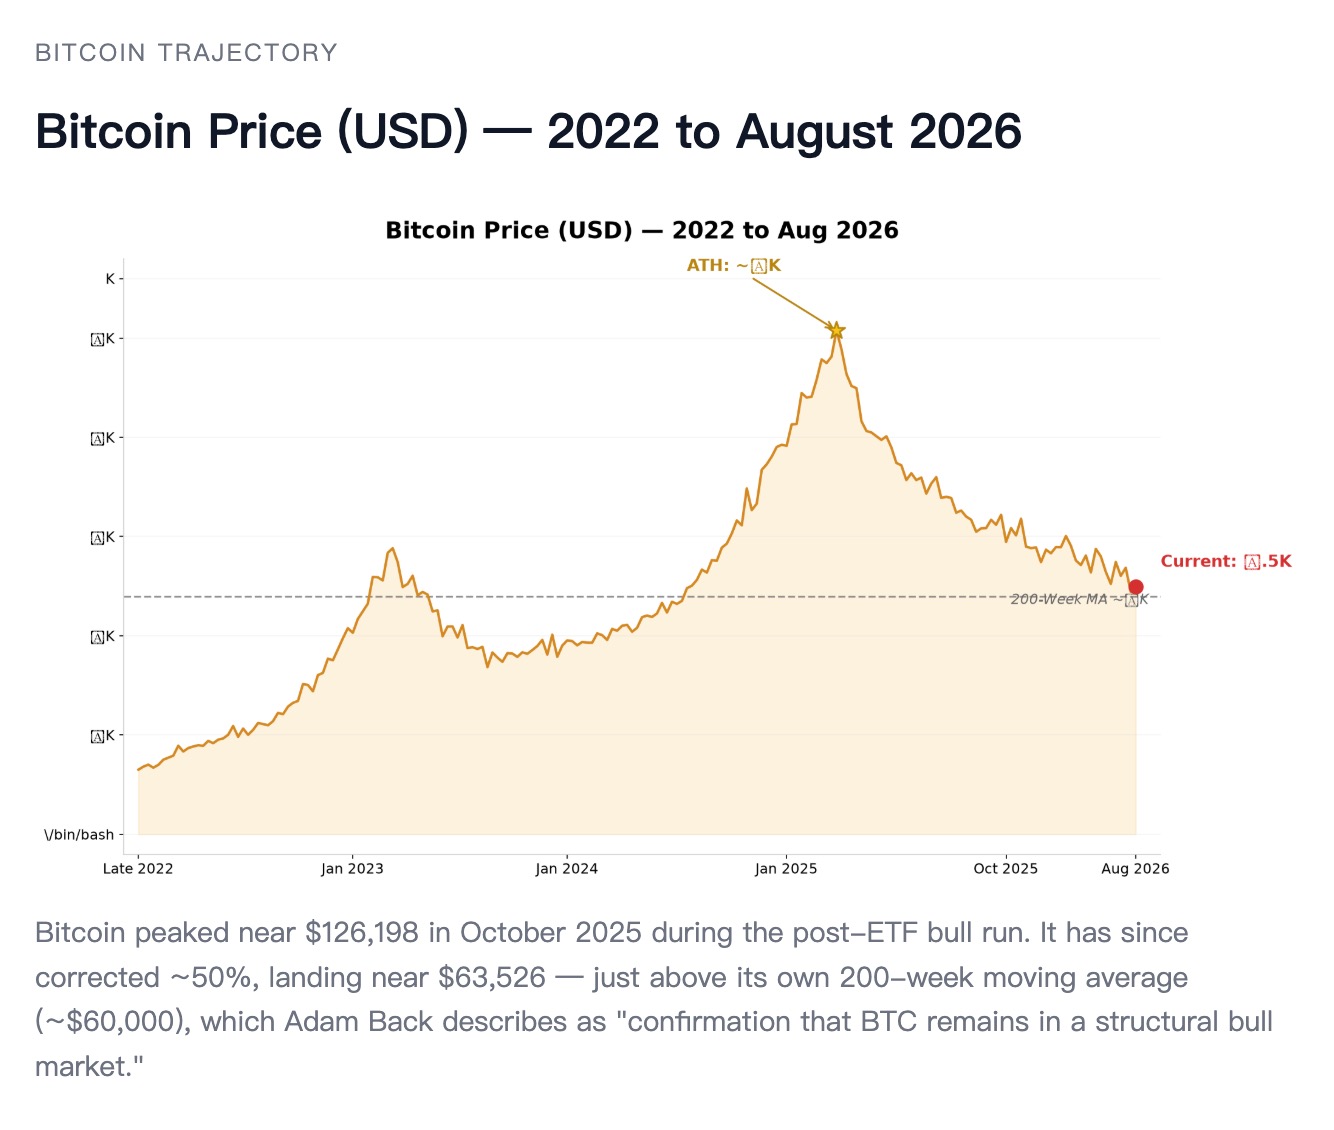
The timeline of Bitcoin's recent price action is a textbook study of market cycles. Following the historic approvals of spot Bitcoin ETFs in early 2024 and the subsequent network halving, institutional frenzy pushed Bitcoin to an eye-watering all-time high of $126,198 in October 2025. However, as is characteristic of the asset's cyclical nature, the post-halving euphoria eventually exhausted itself.
Since that peak, Bitcoin has undergone a brutal −44.8% correction, currently trading near $63,526. While a drawdown of this magnitude might incite panic in traditional equity markets, veterans of the cryptocurrency space recognize this as standard post-bull-run behavior. What is critically important for technical analysts is exactly where Bitcoin is currently finding support.
At current levels, Bitcoin is sitting just above its own 200-week moving average, which is currently hovering around the $60,000 mark. This level serves as a massive psychological and technical line in the sand. Renowned cryptographer and industry pioneer Adam Back recently described this precise level as "confirmation that BTC remains in a structural bull market." As long as Bitcoin holds this long-term moving average, the overarching macro bull thesis remains intact, framing the current −44.8% drawdown as a necessary consolidation phase rather than a terminal collapse.
Signal Interpretation: Two Competing Schools of Thought
With the SPX/BTC ratio now sitting at 0.104 and definitively above its 200-week average, institutional analysts and retail investors alike are heavily debating what happens next. When a historically unprecedented technical event occurs, there is no direct historical roadmap to follow. Instead, market strategists have divided themselves into two primary camps: the Mean-Reversion view and the Trend-Continuation view.
The Mean-Reversion View: The Stretched Rubber Band
The first school of thought views the current ratio crossover through the lens of mean-reversion. In financial markets, long-term moving averages often act like a gravitational pull or a "fair value" anchor. When an asset (or a ratio) strays too far or crosses over a historical extreme, it is likened to stretching a rubber band. Eventually, the tension becomes too great, and the price action aggressively snaps back to historical norms.
Proponents of this view argue that the current SPX/BTC ratio of 0.104 represents a severe over-extension. Historically, whenever the relative performance of traditional equities has spiked against Bitcoin—even if it didn't cross the 200-week MA—the divergence was ultimately resolved by a massive wave of Bitcoin outperformance. According to this thesis, the current data suggests that the cryptocurrency market is vastly oversold on a multi-year relative basis.
From a fundamental standpoint, mean-reversion advocates point out that traditional equities are currently priced to perfection. The S&P 500 at 6,600 assumes flawless execution of AI monetization and a perfectly smooth economic landing. Any slight miss in corporate earnings, a reignition of inflation, or geopolitical turbulence could trigger a swift correction in equities. Simultaneously, Bitcoin—sitting on the ultimate support of its own $60,000 200-week MA—is perfectly positioned to absorb fleeing capital, acting once again as a non-sovereign safe haven and a high-beta liquidity sponge. In short, the mean-reversion camp views the current ratio crossover not as a permanent defeat for Bitcoin, but as the ultimate generational buying opportunity for the digital asset before the ratio plummets once more.
The Trend-Continuation View: A Structural Regime Shift
Contrasting sharply with the mean-reversion thesis is the Trend-Continuation view, which interprets the 200-week crossover as a definitive confirmation of a brand-new macroeconomic regime. Market history is rife with examples of assets permanently losing their relative outperformance as markets mature and technological paradigms shift.
According to this view, the era of Bitcoin effortlessly vastly outperforming traditional finance has come to a close. The logic is grounded in capital flows and changing narratives. Since late 2025, institutional flows have aggressively rotated away from the crypto-centric narratives and into the tangible, cash-flow-generating juggernauts of the AI-driven equity market. The "digital gold" and post-halving scarcity narratives that previously propelled Bitcoin to $126,198 are arguably losing their steam in a world where artificial intelligence is fundamentally reshaping global productivity.
Furthermore, Bitcoin's maturation into a trillion-dollar asset class intrinsically limits its volatility and its ability to generate the 1,000% returns seen in earlier cycles. As Bitcoin becomes more integrated into traditional portfolios via ETFs, its correlation with standard liquidity metrics increases. The Trend-Continuation camp argues that as long as corporate earnings growth remains robust and the Federal Reserve continues to accommodate the economy with rate cuts, the S&P 500 will retain its dominance. This crossover, therefore, is not a rubber band waiting to snap back, but rather a crossing of the Rubicon. It signals that traditional markets, empowered by next-generation technology and solid balance sheets, have reclaimed the throne as the premier vehicle for wealth generation in the late 2020s.
The Broader Implications for Portfolio Construction
Whether one subscribes to the Mean-Reversion or the Trend-Continuation theory, the data points generated by this historic crossover demand an immediate reevaluation of modern portfolio construction. For years, the standard "60/40" portfolio (60% equities, 40% bonds) was pronounced dead, with advisors recommending a "60/30/10" model that carved out a substantial allocation for Bitcoin and digital assets to drive alpha.
However, with the SPX/BTC ratio above its 200-week MA for the first time, asset managers are forced to question the "automatic alpha" assumption of crypto allocations. If the S&P 500 can outperform Bitcoin over a multi-year smoothed basis, the opportunity cost of holding volatile digital assets through 50% drawdowns becomes much harder to justify for fiduciary risk managers.
Conversely, for contrarian investors, the data presents a mouth-watering asymmetric bet. If the multi-year floor of Bitcoin's $60,000 moving average holds, while the S&P 500 is technically overbought, shifting capital from traditional index funds into Bitcoin at this precise crossover moment could yield massive relative returns over the next 24 months.
Conclusion: Navigating the Data-Driven Future
The financial landscape of August 2026 is defined by unprecedented divergences. The S&P 500 has soared 78% since late 2022, securing 23 new all-time highs this year to reach ~6,600. Simultaneously, Bitcoin has weathered a severe −44.8% correction from its ETF-fueled $126,198 peak, currently resting on the precipice of its own structural $60,000 bull-market floor. The synthesis of these two massive price actions has resulted in the SPX/BTC ratio breaking above its 200-week moving average at 0.104—a structural shift in relative momentum never before witnessed in the history of decentralized finance.
Understanding these macro shifts requires more than just reading the news; it requires interacting with the data, analyzing historical precedents, and visualizing the correlations that drive global liquidity. Navigating this complex, fast-moving financial environment can no longer be done relying on outdated spreadsheets or delayed reporting.
To stay ahead of the curve, you need tools that bring institutional-grade analytics directly to your fingertips. This entire report, the ratio computations, and the contextual data visualizations were made possible using Powerdrill Bloom. Whether you are looking to track the next crossover event, analyze real-time multi-asset correlations, or generate comprehensive market intelligence reports in seconds, Powerdrill Bloom is the ultimate platform for modern investors. Don't let the next paradigm shift catch you off guard, start using Powerdrill Bloom today to unlock the full potential of your financial data analysis.
Frequently Asked Questions
What is the SPX/BTC ratio?
It measures how many Bitcoins are needed to buy one unit of the S&P 500, showing their relative performance.
Why is the 200-week moving average important?
It smooths out nearly four years of data, acting as a highly reliable indicator for long-term structural market trends.
What caused the S&P 500 to rally so aggressively?
The rally is heavily driven by artificial intelligence investments, robust corporate earnings growth, and ongoing macroeconomic interest rate cuts.
Why is Bitcoin currently dropping in price?
Bitcoin is experiencing a standard post-halving cyclical correction following its massive surge to an all-time high in late 2025.
How was the data in this report analyzed?
All insights, data synthesis, and technical metrics were processed and beautifully structured using the powerful analytics of Powerdrill Bloom.