Powerdrill Bloom vs. Sourcetable: Features, Pricing, and Best Use Cases (2026)
Both of these take a spreadsheet and act as an analyst on it. The split is the working surface. Sourcetable keeps you in a spreadsheet grid with Python and SQL underneath. Powerdrill Bloom moves you onto a visual canvas that becomes a chart, a report or a deck.
That difference decides which one suits your week more than any feature list does. This comparison uses only facts published on both official pages, checked on August 14, 2026.
What's the difference between Powerdrill Bloom and Sourcetable?
Sourcetable describes itself as "The spreadsheet for AI analysis and data science," and frames the product as "Your data analyst. Always with you."
Powerdrill Bloom is a general action AI agent whose flagship strength is data. You upload a file, explore it on a canvas, and convert what you kept into a deliverable.
The input side overlaps almost completely. Both accept Excel, CSV, TSV and PDF data.
The divergence starts at the surface you work on. A grid assumes you want cells, formulas and code within reach. A canvas assumes you want to look, decide and then produce something.
There is a third difference that shows up later. Sourcetable's depth is technical, reaching into Python and SQL. Powerdrill Bloom's depth is in output, reaching into slides and reports.
Meet Powerdrill Bloom
Powerdrill Bloom is organised around a visual exploration canvas. After an upload it proposes three exploration paths, then fills the canvas with cards holding charts, insights and follow-up questions.
Core analysis formats are Excel, CSV, TSV and PDF. Workspaces extend that: a file uploaded once is understood across formats and remembered in later sessions inside that workspace.
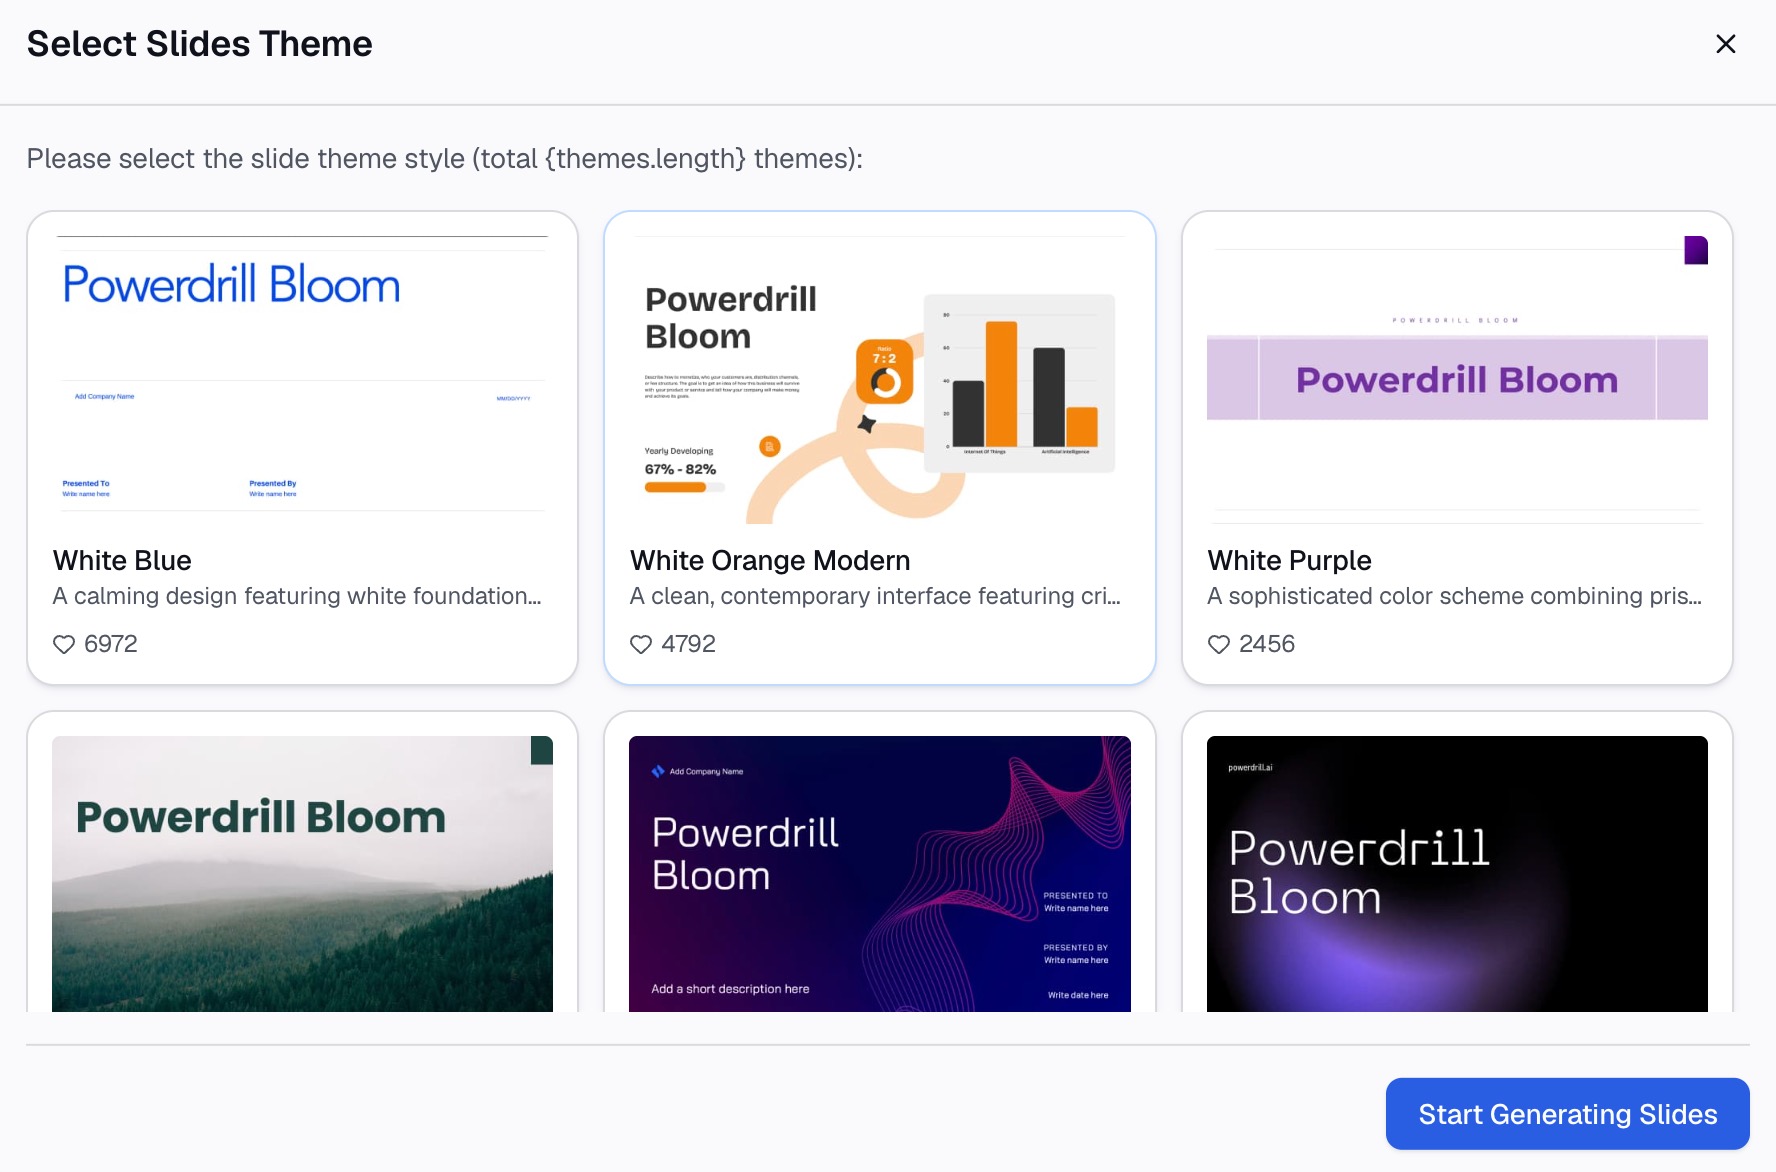
Output is where it concentrates. Any part of the canvas converts to slides in one step, in Professional, Business or Fancy styles, exporting to PowerPoint or Notion. Skills such as ppt-master, officecli-pptx, Research-last30days and dcf-model cover repeatable workflows, and custom skills can be added.
It also ships an MCP server, so a compatible client can browse datasets and start jobs. Compliance covers GDPR, ISO 27001, ISO 20000 and SOC 2 Type 2, and the interface supports 17 languages.
Pricing is published per seat. Free includes 1,000 daily credits, and Pro is listed at $13.27 per month billed annually. Plus, Premium and Team Pro sit alongside it on the pricing page.
Meet Sourcetable
Sourcetable positions itself as an AI spreadsheet, an AI data analyst and an Excel AI in one product. Its own summary is blunt: "The last spreadsheet you'll ever need."
The input list is broad. It accepts .xls, .xlsx, .csv, .tsv, PDF, JSON and plain text data, with file capacity stated up to 10GB.
Connectivity goes past files. Sourcetable lists databases including MySQL, PostgreSQL and MongoDB, plus applications such as Stripe, Notion, GA4, Facebook Ads and Robinhood.
The technical stack is stated openly. Sourcetable supports Python and SQL alongside NumPy, Pandas, SciPy, Scikit-learn, StatsModels, Matplotlib, Plotly and Seaborn.
On stated outputs, it covers advanced analysis, generated spreadsheets, charts and graphs, Excel template generation, data cleaning and automated reports. Its logo wall includes McKinsey & Company, Target, Amazon, Tencent, JPMorgan, Capgemini, EY, Oliver Wyman and Mastercard.
Pricing has three subscription tiers plus credit packs. Regular is free with 50 credits included per month. Pro is $29 per user per month with 2,000 credits, adding Deep Research, premium models, the Python toolkit and a SQL editor. Max is $100 per user per month with 6,000 credits, adding advanced agent capabilities and unlimited AI messages subject to guardrails. One-time credit packages run from $10 to $200 and do not expire.
A logo wall tells you which market a vendor sells into. It is positioning rather than evidence about your own data.
At a glance
| Powerdrill Bloom | Sourcetable | |
|---|---|---|
| 🎯 Best for | Exploring a dataset, then shipping a chart, report or deck | Spreadsheet-native analysis with Python and SQL within reach |
| 💰 Pricing (as of Aug 2026) | Free plan; Pro $13.27/month billed annually | Free plan; Pro $29/user/month, Max $100/user/month |
| ⚡ Key strength | Canvas with one-step slide output to PowerPoint or Notion | Files up to 10GB, database connectors, full Python data stack |
| ❄️ Main weakness | Core analysis formats limited to Excel, CSV, TSV and PDF | No annual pricing published; free tier is 50 credits a month |
| 👥 Team size | Solo through team, with Team Pro seats | Priced per user, with no published team ceiling |
Both weakness rows come from the official pages. One publishes its supported formats; the other publishes its tiers without an annual option.
One caveat on the price row. The Powerdrill Bloom figure is an annual-billing price, and the Sourcetable figures are monthly, so the two columns are not a like-for-like comparison.
Both meter credits, which makes the volume comparison closer than usual. A credit is still vendor-defined, so it is not a shared unit of work.
Feature-by-feature
Inputs and connectivity
This is the clearest Sourcetable advantage. Named databases, a 10GB file ceiling and application connectors mean a live source can feed the work without an export step.
Powerdrill Bloom lists Excel, CSV, TSV and PDF as core analysis formats, and publishes data connector and database pages of its own. It does not publish a file size limit, so test that with your largest file.
A practical check settles this fast. Name the three systems your data actually comes from, then look for each by name in both vendors' documentation.
If the answer is Stripe and a Postgres instance, that points one way. If the answer is "whatever finance emails me," file handling matters more than connectors.
The working surface
A grid and a canvas are not cosmetic variations. They assume different things about what you already know.
Sourcetable's surface is a spreadsheet, so cells, smart formulas and pivots are the vocabulary. That is an advantage when you know the calculation you want and want to see it laid out.
Powerdrill Bloom's canvas proposes exploration paths and follow-up questions instead. That fits the more common situation, where you do not yet know what the data supports. Our auto insights page covers that entry point.
Neither is better in the abstract. The question is whether your uncertainty is about the method or about the data.
Technical depth
Sourcetable is unusually explicit here, naming Python, SQL and a full scientific stack. For anyone who can write pandas or a query, that ceiling is high.
Note the tier, though. The Python toolkit, the SQL editor, Deep Research and premium models sit on Pro rather than on the free plan.
Powerdrill Bloom goes the other direction. Interaction is natural language, with skills and an MCP server as the extension points rather than code.
The trade is real and it cuts both ways. Code gives you exactness and a learning curve. Natural language gives you speed and a ceiling you feel eventually.
Output and deliverables
Sourcetable states charts and graphs, generated spreadsheets, Excel template generation and automated reports. The centre of gravity stays inside the spreadsheet.
Powerdrill Bloom converts the canvas to slides in one step and exports to PowerPoint or Notion, with three presentation styles. Our Excel to PPT page covers that path.
Decide this on the artifact you are judged by. A cleaner workbook and a deck you defend in a meeting are different jobs.
Recurring work
Powerdrill Bloom publishes scheduled task counts by plan, with one on Free and twenty on Pro. That is a stated ceiling rather than an open one.
Sourcetable names automated reports among its capabilities without publishing a schedule count. Verify the cadence you need against current documentation.
Team and governance
Powerdrill Bloom publishes Team Pro seats at $13.27 per seat per month billed annually, with shared team credits. It also publishes GDPR, ISO 27001, ISO 20000 and SOC 2 Type 2 certifications, and the interface supports 17 languages.
Sourcetable prices per user without publishing a team ceiling. Its logo wall names large firms, which suggests enterprise use, but a logo is not a governance document.
For a procurement review, published certifications are usually the first item requested. Check both vendors' current documentation rather than a marketing page.
Cost structure
Both meter credits, so heavy iterative questioning is the variable that moves your bill in either product.
The free tiers differ in shape. Sourcetable includes 50 credits per month. Powerdrill Bloom includes 1,000 credits that refresh daily.
Sourcetable's non-expiring credit packs are worth noting for irregular use. If you analyse twice a quarter, a pack can beat a subscription.
How to make your choice
Choose Powerdrill Bloom if the deliverable is a document
Pick it when the work ends in slides, a written summary or a chart someone will question. The canvas keeps the analysis attached to the output, so the trail back to a number survives.
It also suits exploratory work where the questions are unsettled. Asking in natural language and following the answer is the intended motion.
Choose Sourcetable if you want the grid and the code
Pick it when you think in cells, or when you want pandas and SQL available on the same data. The 10GB ceiling and database connectors reinforce that.
It also fits teams whose analysts already write Python. Handing those people a grid with a real stack underneath removes a translation step.
If both fit, decide which one holds the truth
Two tools means two versions of a number unless one is clearly the source. Settle that before both are in daily use.
Running both is workable, and one usually becomes the habit. Choose the one matching your most frequent deliverable, and keep the other for exceptions.
Getting started with Powerdrill Bloom
Step 1: Upload your data
Upload the Excel, CSV or PDF file you want to work from. Powerdrill Bloom profiles the columns on arrival, so missing values and type mismatches surface before any chart is drawn.

Step 2: Ask for what you need in natural language
Describe the result rather than the steps. Ask which segment moved last quarter, then ask for the chart that shows it most clearly.
Step 3: Export the chart, report, or deck
Take out a single chart, a written summary, or the whole canvas as slides. If the work repeats monthly, save it as a scheduled task and try Powerdrill Bloom on next month's export.
My verdict
If your data is large, lives in databases, or needs Python on it, Sourcetable is the more direct fit. It publishes the widest input surface of any product in this category and does not hide the code layer.
If your output is a document that has to survive questioning, Powerdrill Bloom is the shorter path. Exploration and presentation happen on one surface, so slides inherit charts you already justified.
Cost depends on rhythm rather than on the sticker. Powerdrill Bloom publishes a lower entry seat price on annual billing, and Sourcetable publishes non-expiring packs that suit bursty use.
One caution applies to both. A tool that produces a finished-looking artifact from one upload makes it easy to stop checking the input. Our note on cleaning data before analysis covers the step neither product removes.
Frequently asked questions
Is Powerdrill Bloom or Sourcetable better for large files?
Sourcetable publishes a file capacity of up to 10GB and lists database connectors, so it states the larger ceiling. Powerdrill Bloom does not publish a file size limit, which makes your own largest file the test.
Does Sourcetable have a free plan?
Yes. Its Regular tier is free and includes 50 credits per month. Powerdrill Bloom also publishes a free plan, with 1,000 credits that refresh daily.
Which one supports Python and SQL?
Sourcetable names Python, SQL and libraries including Pandas, Scikit-learn and Plotly, with the toolkit and SQL editor on its Pro tier. Powerdrill Bloom is driven by natural language, with skills and an MCP server as extension points.
How do the two price models compare?
Both meter credits. Sourcetable lists Pro at $29 per user per month and Max at $100, plus non-expiring credit packs from $10 to $200. Powerdrill Bloom lists Pro at $13.27 per month billed annually.
Can both produce a PowerPoint file?
Powerdrill Bloom converts an explored canvas into slides in one step and exports to PowerPoint or Notion. Sourcetable's published outputs centre on spreadsheets, charts and automated reports rather than presentations.