Powerdrill Bloom vs. Bricks: Features, Pricing, and Best Use Cases (2026)
These two overlap more than most pairs in this category. Both accept a spreadsheet and return something finished. The difference is what "finished" means. Bricks aims at an interactive dashboard. Powerdrill Bloom aims at an explored canvas that becomes a chart, a report or a deck.
That distinction decides which one fits your week. A dashboard is something people return to. A deck is something you present once and defend.
This comparison uses only facts published on both official pages, checked on August 13, 2026.
What's the difference between Powerdrill Bloom and Bricks?
Bricks describes itself as "Your AI Data Analyst to Create Dashboards and Reports." Its site promises to go "From CSV & Excel file to dashboard in seconds."
Powerdrill Bloom is a general action AI agent whose flagship strength is data. You upload a file, explore it on a visual canvas, and turn what you kept into a chart, a report or slides.
The input side is nearly identical, which is unusual. Both take CSV and Excel, and both handle PDF data.
The output side is where they separate. One optimises for a living dashboard with filters and refresh. The other optimises for a narrative artefact you take into a meeting.
There is a third difference that shows up later. A dashboard implies ownership and upkeep, because someone has to keep it correct. A deck is finished when the meeting ends.
Meet Powerdrill Bloom
Powerdrill Bloom is organised around a visual exploration canvas. After an upload it proposes three exploration paths, then fills the canvas with cards holding charts, insights and follow-up questions.
Core analysis formats are Excel, CSV, TSV and PDF. Workspaces extend that: a file uploaded once is understood across formats and remembered in every later session inside that workspace.
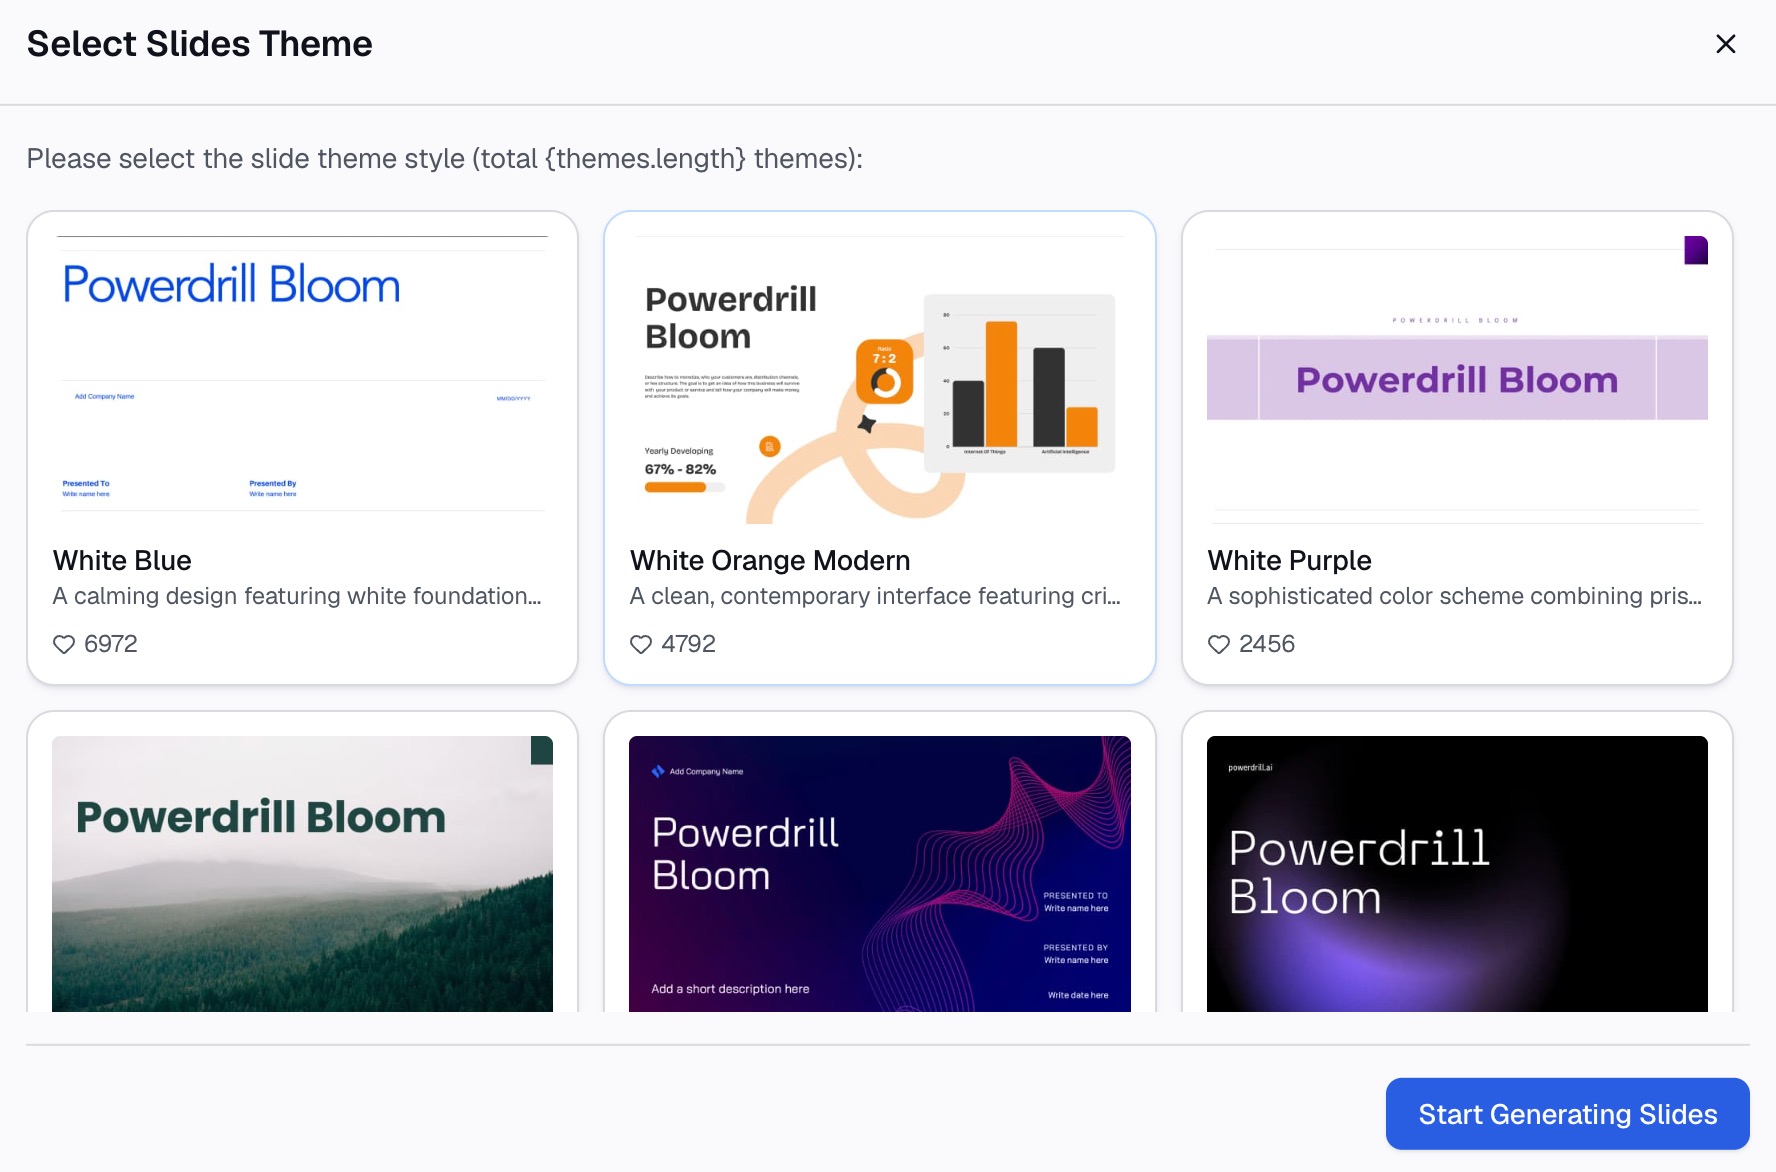
Output is the concentration point. Any part of the canvas converts to slides in one step, in Professional, Business or Fancy styles, exporting to PowerPoint or Notion. Skills such as ppt-master, officecli-pptx, Research-last30days and dcf-model cover repeatable workflows, and custom skills can be added.
It also ships an MCP server, so a compatible client can browse datasets and start jobs. Compliance covers GDPR, ISO 27001, ISO 20000 and SOC 2 Type 2, and the interface supports 17 languages.
Pricing is published per seat. Free includes 1,000 daily credits, and Pro is listed at $13.27 per month billed annually. Plus, Premium and Team Pro sit above it on the pricing page.
Meet Bricks
Bricks positions itself as an AI data analyst that creates dashboards and reports from CSV, Excel or PDF data. Its emphasis is speed from file to dashboard.
The connectivity story is broad. Alongside CSV, Excel and Google Sheets, it lists databases including PostgreSQL, MySQL, MariaDB and SQL Server. It also lists more than 40 third-party connectors, covering Salesforce, HubSpot, Stripe and QuickBooks.
The named capabilities centre on dashboard behaviour. They include AI dashboard generation, interactive filtering across visualisations, and one-click data refresh that preserves layouts. Reusable templates, themes and drag-and-drop customisation round out the list.
On adoption, the site states that more than 100,000 professionals use it, and displays logos including NVIDIA, ByteDance, Adobe, Accenture and MIT.
Pricing has four tiers. Free is $0 with 20 AI messages per month. Premium is $25 per user per month, or $17.5 per user per month billed annually. It includes 200 AI messages per month and export to PDF, PPTX, XLSX and HTML. Pro is $100 per user per month, or $70 annually. It adds unlimited AI messages, up to 10 team members, advanced connectors, and Tableau and Power BI export. Embeddable dashboards and full PDF imports are also included. Enterprise is quoted on request.
The adoption claim is worth reading as positioning rather than proof. A stated user count and a logo wall tell you which market a vendor targets, not how the product performs on your data.
At a glance
| Powerdrill Bloom | Bricks | |
|---|---|---|
| 🎯 Best for | Exploring a dataset, then shipping a chart, report or deck | Standing up an interactive dashboard fast |
| 💰 Pricing (as of Aug 2026) | Free plan; Pro $13.27/month billed annually | Free plan; Premium $17.5/user/month annually, Pro $70 |
| ⚡ Key strength | Visual canvas with one-step slide output to PowerPoint or Notion | 40+ connectors and database sources, refresh that preserves layout |
| ❄️ Main weakness | Core analysis formats limited to Excel, CSV, TSV and PDF | AI messages capped at 20 on Free and 200 on Premium |
| 👥 Team size | Solo through team, with Team Pro seats | Solo on Premium; up to 10 members on Pro |
Both weakness rows come from the official pages. One publishes its supported formats; the other publishes its message allowances by tier.
One more caveat on the table. Bricks meters AI messages and Powerdrill Bloom meters credits, so the two free tiers are not directly comparable in volume.
One pricing note worth flagging. The two products meter different things, so a per-seat comparison is directional rather than exact.
Feature-by-feature
Inputs and connectivity
This is the clearest Bricks advantage. Named databases and a stated count of more than 40 connectors mean a live source can feed the work without an export step.
Powerdrill Bloom lists Excel, CSV, TSV and PDF as core analysis formats, and publishes data connector and database pages of its own. It does not publish a connector count, so treat breadth as the thing to verify for your specific system.
A practical test settles this quickly. List the three systems your data actually comes from, then check each vendor's connector documentation for those three by name.
If your data lives in Salesforce or Stripe and you want it queried in place, that requirement points one way.
Exploration versus generation
The two philosophies differ here, and it is not a small difference.
Bricks emphasises generation speed: file in, dashboard out, then customise. That is the right shape when you already know which metrics belong on the screen.
Powerdrill Bloom emphasises exploration first. Three suggested paths and follow-up questions exist because most people do not know what the data supports until they look. Our guide to auto insights covers that entry point.
Both motions have a failure mode. Generating a dashboard before you know which metrics matter produces a screen nobody opens. Exploring without a deadline produces a canvas that never becomes a deliverable.
Neither is better in the abstract. Knowing which situation you are in decides it.
Output and deliverables
Bricks publishes export to PDF, PPTX, XLSX and HTML on Premium, and adds Tableau and Power BI export plus embeddable dashboards on Pro.
Powerdrill Bloom converts the canvas to slides in one step and exports to PowerPoint or Notion, with three presentation styles. Our Excel to PPT page covers that path.
Read the tier carefully if embedding matters. Embeddable dashboards and BI exports sit on the higher Bricks tier rather than the entry paid one.
Recurring work
Bricks names reusable templates and one-click refresh that preserves layouts. For a dashboard rebuilt monthly from a new export, that is exactly the right feature.
Powerdrill Bloom publishes scheduled task counts by plan, with one on Free and twenty on Pro. That covers a set of standing reports and is a stated ceiling rather than an open one.
Cost structure
Bricks meters AI messages: 20 monthly on Free, 200 on Premium, unlimited on Pro. Powerdrill Bloom meters credits, with 1,000 daily on Free and additional monthly credits on paid tiers.
The practical consequence is about work style. Heavy iterative questioning burns messages quickly. A message cap is therefore felt sooner by an exploratory user than by someone who builds one dashboard and refreshes it.
Estimate your own usage before comparing tiers. Count the questions you asked during your last analysis, then multiply by the number of analyses you run in a month.
Neither model is wrong. Match the meter to how you actually work.
Team and governance
Bricks lists up to 10 team members on Pro and directs larger teams to Enterprise. Powerdrill Bloom offers Team Pro seats and publishes GDPR, ISO 27001, ISO 20000 and SOC 2 Type 2 certifications.
Team ceilings also matter more than they look. A stated limit of 10 members means a growing team hits an Enterprise conversation rather than adding a seat.
For a procurement review, published certifications are usually the first item requested. Check both vendors' current documentation rather than relying on a marketing page.
How to make your choice
Choose Powerdrill Bloom if the deliverable is a document
Pick it when the work ends in slides, a written summary or a chart someone will question in a meeting. The canvas keeps the analysis attached to the output, so the trail back to a number survives.
It also fits exploratory work where the questions are not settled. Asking in natural language and following the answer is the intended motion.
Choose Bricks if the deliverable is a dashboard
Pick it when several people will return to the same screen, filters matter, and the data refreshes on a schedule. Layout-preserving refresh and reusable templates are built for that.
The connector breadth reinforces it. A dashboard fed from Salesforce or a Postgres instance is a different requirement from a monthly CSV.
If you need both, decide which one is the habit
Two tools also means two versions of the truth unless one is clearly the source. Decide which one holds the canonical numbers before both are in use.
Running two tools is viable and usually one becomes the daily surface. Pick the one that matches your most frequent deliverable, and use the other for the exception.
Getting started with Powerdrill Bloom
Step 1: Upload your data
Upload the Excel or CSV file you want to work from. Powerdrill Bloom profiles the columns on arrival, so missing values and type mismatches surface before any chart is drawn.
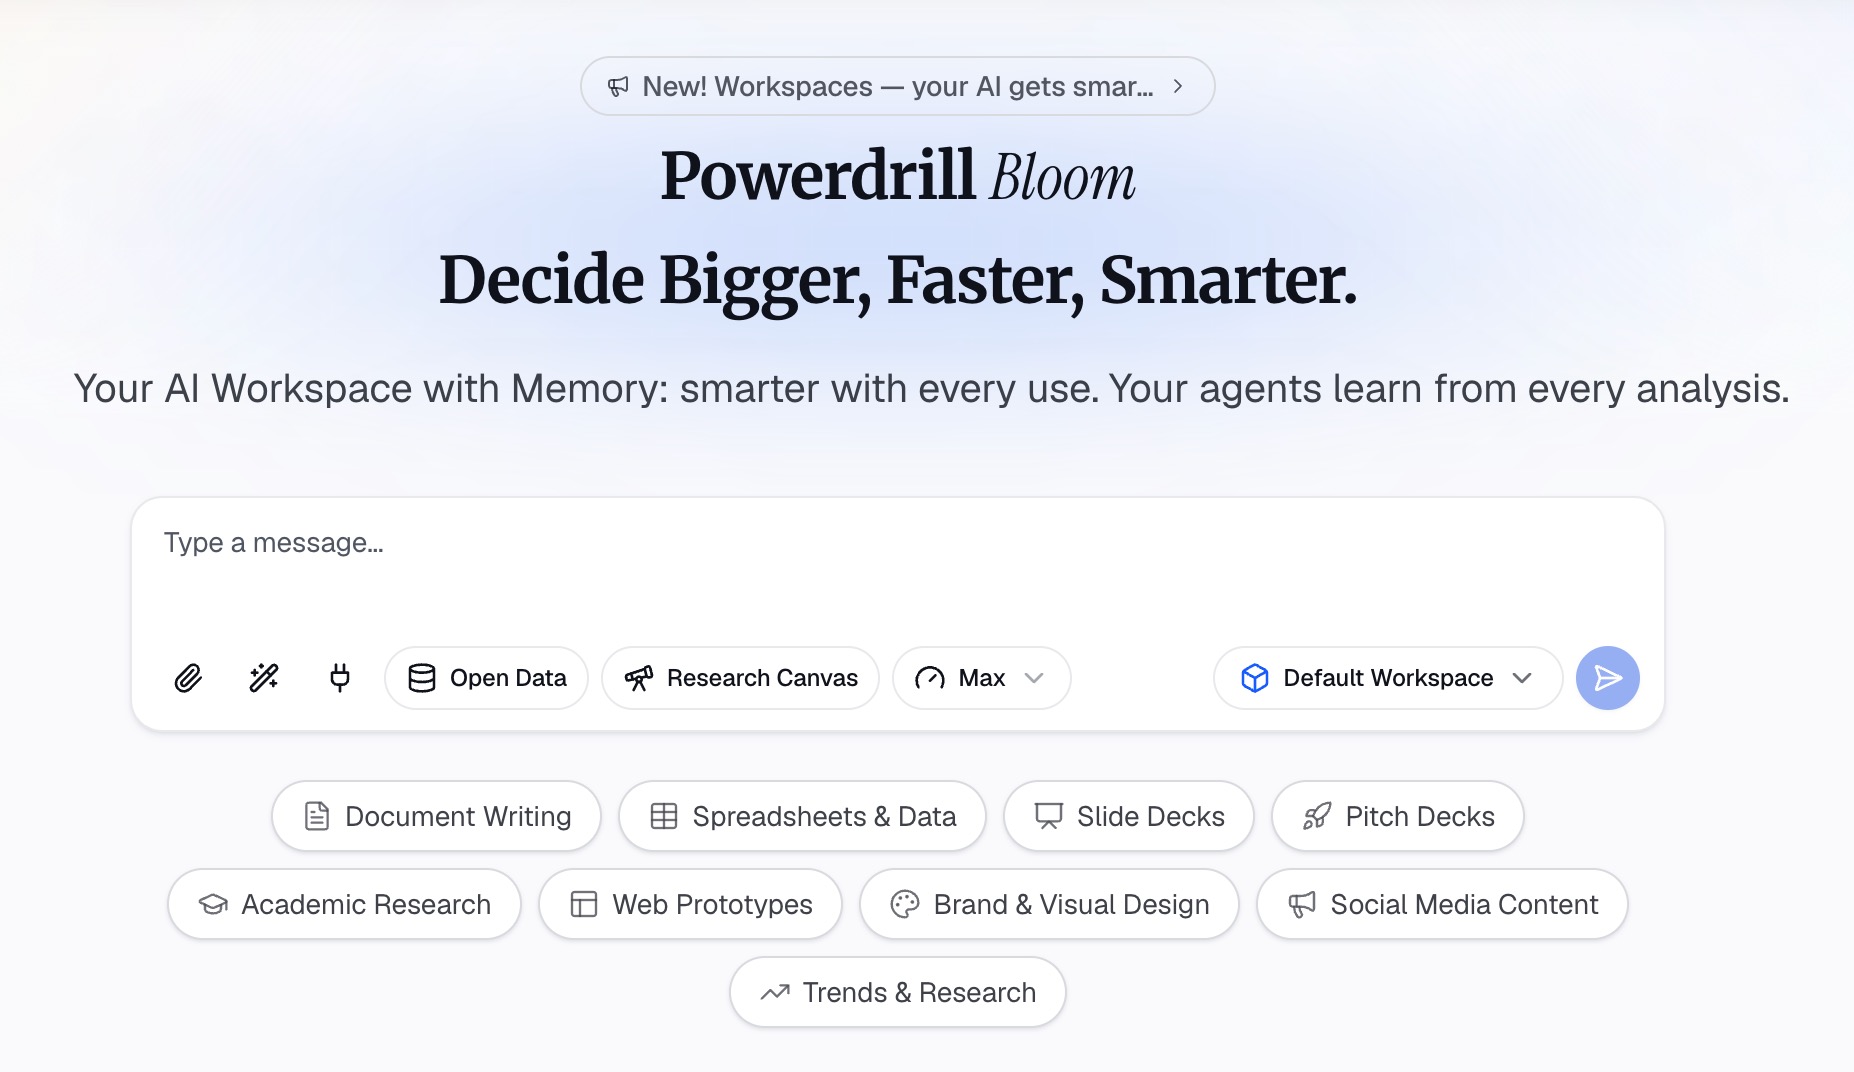
Step 2: Ask for what you need in natural language
Describe the result rather than the steps. Ask which segment moved last quarter, then ask for the chart that shows it most clearly.
Step 3: Export the chart, report, or deck
Take out a single chart, a written summary, or the whole canvas as slides. If the work repeats monthly, save it as a scheduled task and try Powerdrill Bloom on next month's export.
My verdict
If your output is a dashboard that lives on, Bricks is the more direct fit. Its whole surface is built around that artefact, and the connector list plus layout-preserving refresh support it properly.
If your output is a document that has to survive questioning, Powerdrill Bloom is the shorter path. Exploration and presentation happen on one surface, so slides inherit the charts you already justified.
Cost is the other split. Powerdrill Bloom publishes a lower entry seat price, and Bricks publishes higher tiers with unlimited messages and BI export. Which of the two is cheaper depends entirely on how many questions you end up asking.
The honest caution applies to both. Any tool that produces a finished-looking artefact from one upload makes it easy to stop checking the input. A polished dashboard built on a mislabelled column is more dangerous than a rough one. Our note on what a data dashboard is covers that distinction.
Frequently asked questions
Is Powerdrill Bloom or Bricks better for dashboards?
Bricks is built around dashboards, with interactive filtering, layout-preserving refresh and reusable templates. Powerdrill Bloom is stronger when the end product is a chart, a report or a deck rather than a screen people revisit.
Does Bricks have a free plan?
Yes, at $0 with 20 AI messages per month. Powerdrill Bloom also publishes a free plan, with 1,000 daily credits.
Which one connects to databases and business tools?
Bricks names PostgreSQL, MySQL, MariaDB and SQL Server, plus more than 40 connectors including Salesforce, HubSpot, Stripe and QuickBooks. Powerdrill Bloom publishes its own connector and database pages without a stated count.
How do the two price models differ?
Bricks meters AI messages by tier, with 20 on Free, 200 on Premium and unlimited on Pro. Powerdrill Bloom meters credits, with 1,000 daily on Free plus monthly credits on paid plans.
Can both produce a PowerPoint file?
Yes. Bricks lists PPTX among its Premium exports. Powerdrill Bloom converts an explored canvas into slides in one step and exports to PowerPoint or Notion.