Data Fact: Netflix’s 10 Most-Watched American TV Series of the Last Decade: Viewership and IMDb Ratings
Netflix has changed how audiences discover and consume American TV. Instead of waiting for a weekly episode, viewers can watch an entire season in one sitting. Some shows become short-term hits. Others turn into long-running streaming phenomena.
But which American TV series have actually attracted the most viewing on Netflix over the last decade?
To answer that question, we analyzed Netflix engagement data, IMDb ratings, and supporting industry data through July 2026. The ranking focuses on American English-language series and aggregates reported viewing hours across tracked seasons. Non-English global hits such as Squid Game, Money Heist, and Lupin are excluded from the ranking.
This kind of analysis is also where tools such as Powerdrill Bloom can save time. Instead of manually cleaning spreadsheets, calculating rankings, and building charts, Powerdrill Bloom can turn raw data into visual insights and presentation-ready reports.
A Decade of Netflix Viewing Data
Netflix began publicly releasing engagement data in 2021. Its semi-annual What We Watched reports have since become one of the most useful sources for understanding streaming behavior.
In 2023, Netflix also standardized a 91-day post-release measurement window. This makes newer seasons easier to compare. Older titles are harder to measure because Netflix did not publish the same level of engagement data at the time.
For this analysis, the ranking uses the supplied franchise-level totals. The data combines Netflix engagement reports with supporting sources such as Nielsen, IMDb, and FlixPatrol.
The result is a list dominated by familiar names.
Stranger Things takes the top spot with more than 3.2 billion reported hours. Wednesday follows with about 2.65 billion hours. Bridgerton ranks third with 1.73 billion hours.
The list also shows that popularity is not limited to one genre. Science fiction, romance, thrillers, true crime, fantasy, and teen dramas all make the top 10.
Key finding: Stranger Things leads the ranking with 3.229 billion hours viewed. It also shares the highest IMDb score in the group, at 8.6. However, the full ranking shows that high ratings alone do not guarantee the most viewing.
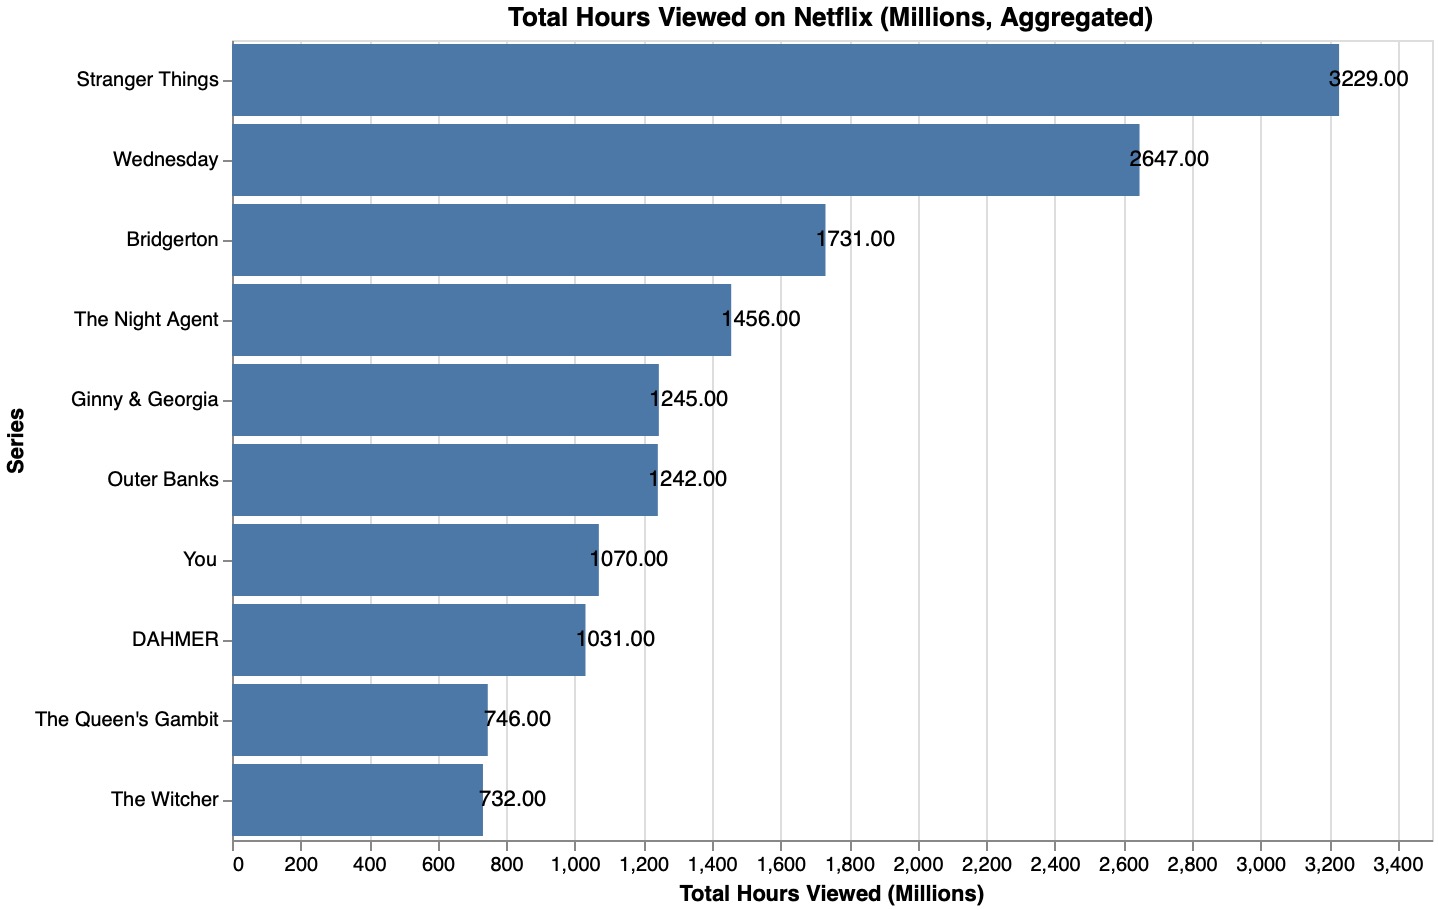
The first chart makes the gap between the leaders easy to see.
Stranger Things and Wednesday form a clear top tier. Both are far ahead of the other series in total reported hours. Bridgerton is the only other title above 1.7 billion hours.
Below that, several shows cluster between roughly 1.0 and 1.5 billion hours. These include The Night Agent, Ginny & Georgia, Outer Banks, You, and DAHMER.
At the bottom of the ranking are The Queen's Gambit and The Witcher. Their totals are lower, but both still generated hundreds of millions of viewing hours.
This is an important distinction. A show does not need multiple seasons to become a major Netflix hit. DAHMER and The Queen's Gambit are both limited series, yet they still rank among Netflix's most-watched American productions.
The Top 10 — Full Breakdown
The table below provides the complete ranking based on the supplied dataset. It includes genre, tracked seasons, total reported hours, IMDb rating, and premiere year.
| Rank | Series | Genre | Seasons Tracked | Total Hours (M) | IMDb | Premiere |
|---|---|---|---|---|---|---|
| 1 | Stranger Things | Sci-Fi / Horror | 3 (S3, S4, S5) | 3,229 | 8.6 | 2016 |
| 2 | Wednesday | Mystery / Comedy | 2 (S1, S2) | 2,647 | 8.1 | 2022 |
| 3 | Bridgerton | Period Romance | 3 (S1, S2, S3) | 1,731 | 7.3 | 2020 |
| 4 | The Night Agent | Thriller | 2 (S1, S2) | 1,456 | 7.4 | 2023 |
| 5 | Ginny & Georgia | Dramedy | 2 (S2, S3) | 1,245 | 7.2 | 2021 |
| 6 | Outer Banks | Adventure / Teen | 2 (S3, S4) | 1,242 | 7.5 | 2020 |
| 7 | You | Thriller / Romance | 2 (S4, S5) | 1,070 | 7.6 | 2018 |
| 8 | DAHMER: Monster | True Crime | 1 (Limited) | 1,031 | 8.0 | 2022 |
| 9 | The Queen's Gambit | Period Drama | 1 (Limited) | 746 | 8.6 | 2020 |
| 10 | The Witcher | Fantasy / Action | 3 (S1, S2, S3) | 732 | 7.8 | 2019 |
The ranking reveals several interesting patterns.
First, franchise longevity is not the only driver of total viewing. Wednesday has only two tracked seasons but ranks second. Its first season alone generated 1.7188 billion reported hours in the season-level dataset.
Second, newer shows can climb quickly. The Night Agent premiered in 2023, yet it already ranks fourth. Its first two tracked seasons generated 1.456 billion reported hours in the ranking data.
Third, critical reception and audience scale can diverge. Bridgerton ranks third in viewing but has an IMDb score of 7.3. Meanwhile, The Queen's Gambit has an IMDb score of 8.6 but ranks ninth by aggregate hours.
That contrast becomes even clearer when we look at IMDb ratings separately.
Individual Season Performance
Franchise-level rankings show the big picture. Season-level data shows where the viewing actually came from.
The following table lists the individual seasons and limited series included in the supplied dataset. “Views” refers to Netflix's completed-viewing-equivalent metric when reported.
| Series | Season | Hours Viewed (M) | Views (M) | Release |
|---|---|---|---|---|
| Stranger Things | Season 4 | 1,838.0 | 140.7 | May 2022 |
| Stranger Things | Season 5 | 1,391.3 | 133.8 | Nov 2025 |
| Wednesday | Season 1 | 1,718.8 | 252.1 | Nov 2022 |
| Wednesday | Season 2 | 928.5 | 119.3 | Aug 2025 |
| Bridgerton | Season 1 | 929.3 | 113.3 | Dec 2020 |
| Bridgerton | Season 3 | 846.5 | 106.0 | May 2024 |
| Bridgerton | Season 2 | 627.0 | 93.8 | Mar 2022 |
| The Night Agent | Season 1 | 812.0 | 98.2 | Mar 2023 |
| The Night Agent | Season 2 | 644.0 | — | Jan 2025 |
| Ginny & Georgia | Season 2 | 665.0 | — | Jan 2023 |
| Ginny & Georgia | Season 3 | 580.0 | — | Jun 2025 |
| Outer Banks | Season 3 | 552.0 | — | Feb 2023 |
| Outer Banks | Season 4 | 415.0 | — | Oct 2024 |
| Stranger Things | Season 3 | 582.0 | 94.8 | Jul 2019 |
| You | Season 4 | 440.0 | — | Jan 2023 |
| You | Season 5 | 630.0 | — | Mar 2025 |
| The Witcher | Season 2 | 484.0 | — | Dec 2021 |
| The Witcher | Season 1 | 119.0 | — | Dec 2019 |
| The Witcher | Season 3 | 129.0 | — | Jun 2023 |
| DAHMER | Limited Series | 1,031.1 | 115.6 | Sep 2022 |
| The Queen's Gambit | Limited Series | 746.4 | 112.8 | Oct 2020 |
One of the biggest stories is Stranger Things Season 4. It recorded 1.838 billion hours in the supplied season-level data. That makes it the strongest individual season shown in the table.
Wednesday Season 1 is another standout. It recorded 1.7188 billion hours and 252.1 million completed viewing equivalents.
The viewing pattern also shows why season-level analysis matters. A franchise may have a high total because of several successful seasons. Another may achieve a huge total from one breakout release.
There is also an important data limitation. Netflix's reporting methodology changed over time. Older seasons may have additional viewing that was never reported under the standardized 91-day system. The supplied dataset therefore should not be treated as a complete lifetime viewing count for every series.
IMDb Ratings: Which Shows Score Highest?
Popularity is only one side of the story.
IMDb ratings provide another way to compare these shows. They reflect user-submitted scores on a 1–10 scale. The ratings can change as more users submit votes.
Among the 10 most-watched series, Stranger Things and The Queen's Gambit share the highest IMDb score at 8.6.
Wednesday follows at 8.1. DAHMER scores 8.0, while The Witcher comes in at 7.8.
At the lower end, Ginny & Georgia has a 7.2 rating. Bridgerton has a 7.3 rating.
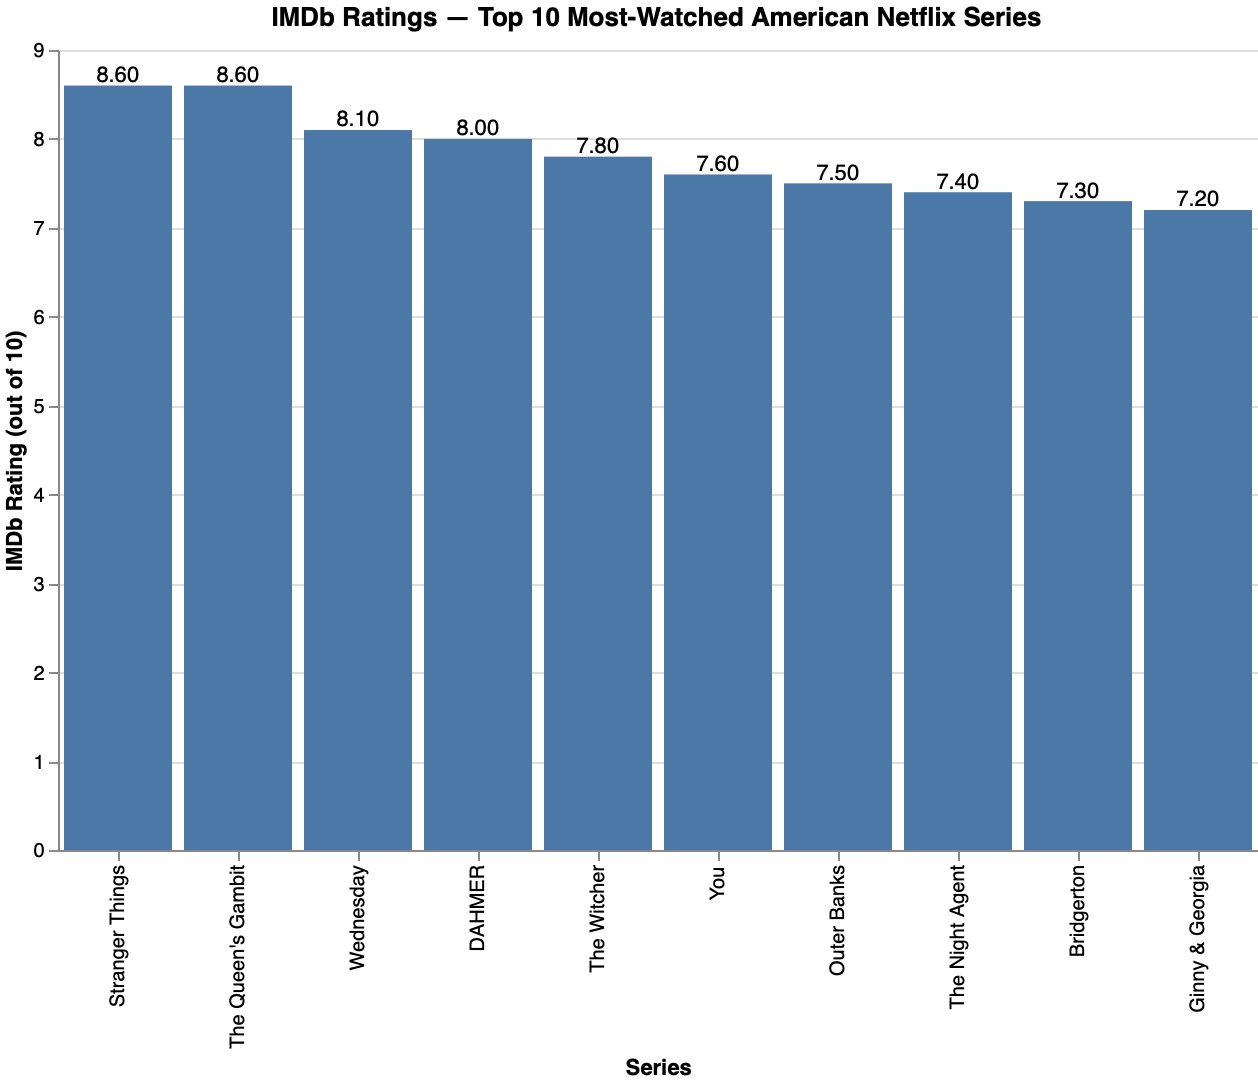
The chart creates an interesting contrast with the viewership ranking.
The most-watched show is also one of the highest-rated. But that is not true across the entire list.
The Queen's Gambit is the clearest example. It has the same 8.6 IMDb score as Stranger Things, yet its reported viewing total is less than one-quarter of Stranger Things.
This suggests that quality, as measured by IMDb users, is only one factor behind streaming success.
Genre matters. Release timing matters. Franchise recognition matters. And Netflix's recommendation system may also play a role.
Viewership vs. IMDb Rating: Does Quality Drive Watching?
This is perhaps the most interesting question in the dataset.
If higher-rated shows were always watched more, we would expect the shows with the highest IMDb scores to dominate the viewing rankings.
The data does not show that.
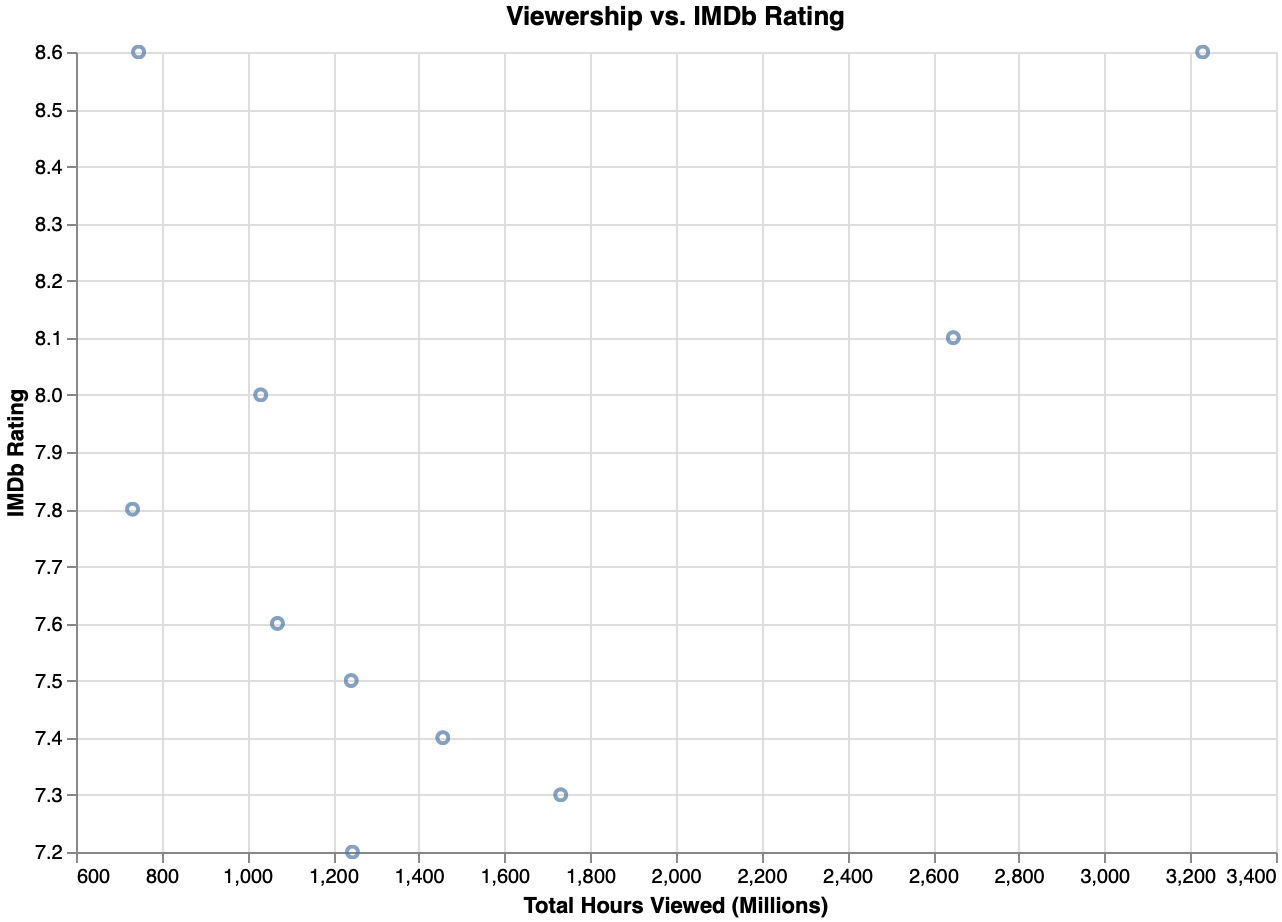
The scatter plot shows a loose relationship rather than a clear straight line.
Stranger Things sits near the top-right of the chart. It combines huge viewing numbers with an 8.6 IMDb rating. Wednesday also occupies the upper-right area, with 2.647 billion hours and an 8.1 rating.
But other examples tell a different story.
The Night Agent has an IMDb score of 7.4 but more than 1.4 billion reported hours. Ginny & Georgia scores 7.2 but still exceeds 1.2 billion hours.
Meanwhile, The Queen's Gambit has one of the highest ratings in the group but a much smaller total audience.
So does quality drive watching?
Not by itself.
The data suggests that viewer demand is influenced by several factors. A highly rated show can become a major hit. But a highly bingeable thriller or teen drama can also generate enormous viewing even with a more modest IMDb score.
This is especially important for Netflix. The platform is built around discovery and binge consumption. A show's ability to keep viewers watching may matter as much as its critical reputation.
What Changed in 2026?
The 2026 data adds another layer to the story.
Stranger Things remained a streaming powerhouse even in its final season. Nielsen reported 23.26 billion minutes viewed in the first half of 2026. That made it the most-streamed series across all platforms during the period in Nielsen's U.S. measurement.
Its final season also produced a single-week peak of 8.645 billion streaming minutes.
That is a remarkable result for a series that began in 2016.
Wednesday also remained highly relevant. Netflix's H2 2025 engagement report recorded 124 million views for Season 2 within its 91-day window. Season 1 also returned to the charts with 47 million additional views during the same period.
Bridgerton is another title to watch. Season 4 became Netflix's biggest English-language series of H1 2026, with 130.8 million views in the supplied data.
Its full 91-day data was not yet included in the all-time ranking. Once fully measured, it could significantly increase the franchise's aggregate total.
Several newer releases also attracted attention. Adolescence recorded 546.5 million hours and 142.6 million views. I Will Find You reached 558.6 million hours and 101.9 million views. His & Hers recorded 98.2 million views in the available data.
These titles may not yet challenge the established top 10. But they show how quickly Netflix's rankings can change.
What the Data Really Tells Us
There are three major takeaways from this analysis.
1. A small group of franchises dominates
Stranger Things and Wednesday are in a different league from most of the other titles in the ranking.
Their totals show the power of major Netflix franchises. A successful show can accumulate billions of viewing hours across a relatively small number of tracked seasons.
2. Ratings and popularity are different metrics
IMDb ratings measure how users evaluate a show. Netflix hours measure how much people watched within a defined reporting window.
These metrics answer different questions.
A show can be highly rated without becoming the biggest streaming hit. A show with a moderate rating can still attract a huge audience.
3. The measurement window matters
Netflix does not publish lifetime cumulative viewing hours for every title.
The current methodology focuses heavily on the first 91 days after release. Older seasons may also lack comparable official data.
That means this ranking is best understood as a data-based comparison of reported Netflix engagement, rather than a definitive lifetime leaderboard.
Methodology and Data Limitations
The primary source for the viewership figures is Netflix's semi-annual What We Watched engagement reporting. The standardized metric measures hours viewed globally during the first 91 days after a season's release.
Earlier reporting used different methodologies. Some older titles therefore have incomplete data.
The franchise totals in the main ranking follow the supplied dataset. The season-level table contains separately reported season figures. Because the underlying reporting periods and methodologies differ, the season rows should not automatically be added together to recreate every franchise total.
IMDb ratings are based on user-submitted scores and were recorded around July–August 2026. They can change over time.
The Nielsen figure for Stranger Things is different from Netflix's global engagement metric. Nielsen's number represents U.S. streaming minutes across platforms. It is therefore useful as a 2026 comparison point, but it should not be combined directly with Netflix's global hours.
The scope also matters. This analysis defines “American TV series” as English-language series primarily produced for the U.S. or global market. Major non-English Netflix hits are excluded.
Conclusion
The last decade of Netflix viewing shows that streaming success is not determined by one simple formula.
Stranger Things combines scale and strong audience ratings. Wednesday has achieved extraordinary viewing with only two tracked seasons. The Queen's Gambit demonstrates that a limited series can become a cultural hit without building a long-running franchise. And shows such as The Night Agent and Ginny & Georgia prove that a moderate IMDb score does not prevent massive streaming demand.
The bigger lesson is that raw viewing data becomes much more useful when it is connected with other metrics.
That is where Powerdrill Bloom can help. Instead of manually sorting Netflix-style datasets, calculating rankings, comparing ratings, and building charts, Powerdrill Bloom can turn raw data into an analysis workflow with visualizations and presentation-ready reports.
For data-heavy stories like this one, the goal is not simply to find the biggest number. It is to understand why the numbers look the way they do.
And in Netflix's case, the answer is clear: popularity, quality, genre, timing, bingeability, and franchise strength all play a role.
FAQs
What are the most-watched American Netflix series?
Stranger Things ranks first, followed by Wednesday, Bridgerton, The Night Agent, and Ginny & Georgia.
Which Netflix series has the highest IMDb rating?
Stranger Things and The Queen's Gambit share the highest IMDb rating among the top 10, both scoring 8.6.
Does a higher IMDb rating mean more Netflix views?
Not necessarily. The Queen's Gambit scores 8.6 but ranks ninth, showing popularity and ratings measure different things.
Which individual season generated the most viewing hours?
Stranger Things Season 4 leads with 1.838 billion reported hours, followed closely by Wednesday Season 1.
How reliable is this Netflix viewership ranking?
The ranking uses reported engagement data, but changing measurement methods mean it should not represent definitive lifetime viewing totals.