How to Write an Executive Summary From a Spreadsheet (2026 Guide)
To write an executive summary from a spreadsheet, lead with the conclusion in one sentence. Support it with three numbers, name the one thing that went wrong, then end with the decision you need. Everything else belongs in the appendix. The hard part is not writing it. The hard part is deciding what to leave out.
This guide covers the structure, the rules for choosing which numbers survive, how to write the opening line, and a before-and-after example.
What an executive summary is for
It exists so that someone who will not read the full report can still make the right call. That is the entire job.
This changes what belongs in it. A summary is not a shortened report, and it is not a list of everything you found. It is the subset of your findings that would change a decision if the reader knew them.
Two failure modes follow from getting that wrong. A summary that lists every metric forces the reader to do the prioritizing you were supposed to do. A summary with no numbers at all reads as opinion, and gets treated that way.
One practical consequence. Write for the reader who is skimming on a phone between meetings, because that reader is the actual audience.
The five-part structure that works
| Part | Length | What goes in it |
|---|---|---|
| The conclusion | One sentence | What happened, and what it means |
| The support | Three numbers | The evidence, each with its denominator |
| The exception | One or two sentences | The thing that went against the trend |
| The cause | One or two sentences | Your best explanation, marked as such |
| The ask | One sentence | The decision, resource, or approval you need |
That is roughly 150 to 200 words. If yours runs past a page, you have written a report and labeled it a summary.
The ask is the part people drop, and dropping it is expensive. A summary with no request gets filed rather than acted on.
The order matters as much as the content. Leading with method or background is the most common structural mistake. Executives read the first line and decide whether to keep going, so the conclusion cannot wait until the end.
Choosing which numbers make the cut
A spreadsheet with forty columns will happily give you forty findings. Three of them belong in the summary. These four rules decide which.
One number per claim
Each sentence gets one supporting figure. If a claim needs three numbers to stand up, the claim is too broad. Split it or drop it.
Always carry the denominator
"Conversion rose 12%" is unreadable on its own. Twelve percent of what base, over what period, on how many users? A percentage without its denominator invites the reader to assume the flattering interpretation.
Change beats level
Absolute values describe a state. Changes describe a direction, and direction is what a decision needs. "Revenue is $2.4M" is a fact. "Revenue is $2.4M, down 8% from last quarter" is a reason to act.
Cut anything without a decision attached
Run each candidate number through one question: if this were different, would anyone do anything differently? If not, it goes in the appendix. This single test removes most of what people put in summaries.
The rule is unpopular because it deletes work you already did. The analysis still exists in the body, and that is where it belongs.
Writing the first line
The opening sentence carries more weight than the rest of the document combined. Three patterns work.
The direct verdict. "Q3 revenue missed plan by 8%, driven almost entirely by churn in the mid-market segment." The reader knows the result and the cause before the second line.
The changed picture. "The channel that produced most of our growth last year is now our least efficient." Useful when the finding overturns an existing belief.
The decision framing. "We can hit the annual target if we shift the remaining budget to paid search, and not otherwise." Useful when a decision is genuinely pending.
Whichever pattern you pick, keep it under about 25 words. A first line that needs a comma-heavy clause has usually merged two findings.
What does not work is the throat-clearing opener. "This report analyzes Q3 performance across all channels" tells the reader nothing they did not already know from the title.
How to write it with Powerdrill Bloom
If the numbers still need calculating, the summary and the analysis can come out of the same pass.
Step 1: Upload your spreadsheet
Drop in the Excel, CSV, or TSV file holding the underlying data. Multiple files load together, so a current-period file and a prior-period file can be compared without a manual join. Column detection and cleanup run on upload.

Step 2: Ask for the summary in natural language
State the audience and the decision. For example: "write a one-page executive summary of Q3 for the board, lead with the conclusion, and flag the largest negative variance." The agent runs the comparison and drafts the structure. Ask it to shorten, or to argue the other side, and it rewrites rather than starting over.
Step 3: Export the chart, report, or deck
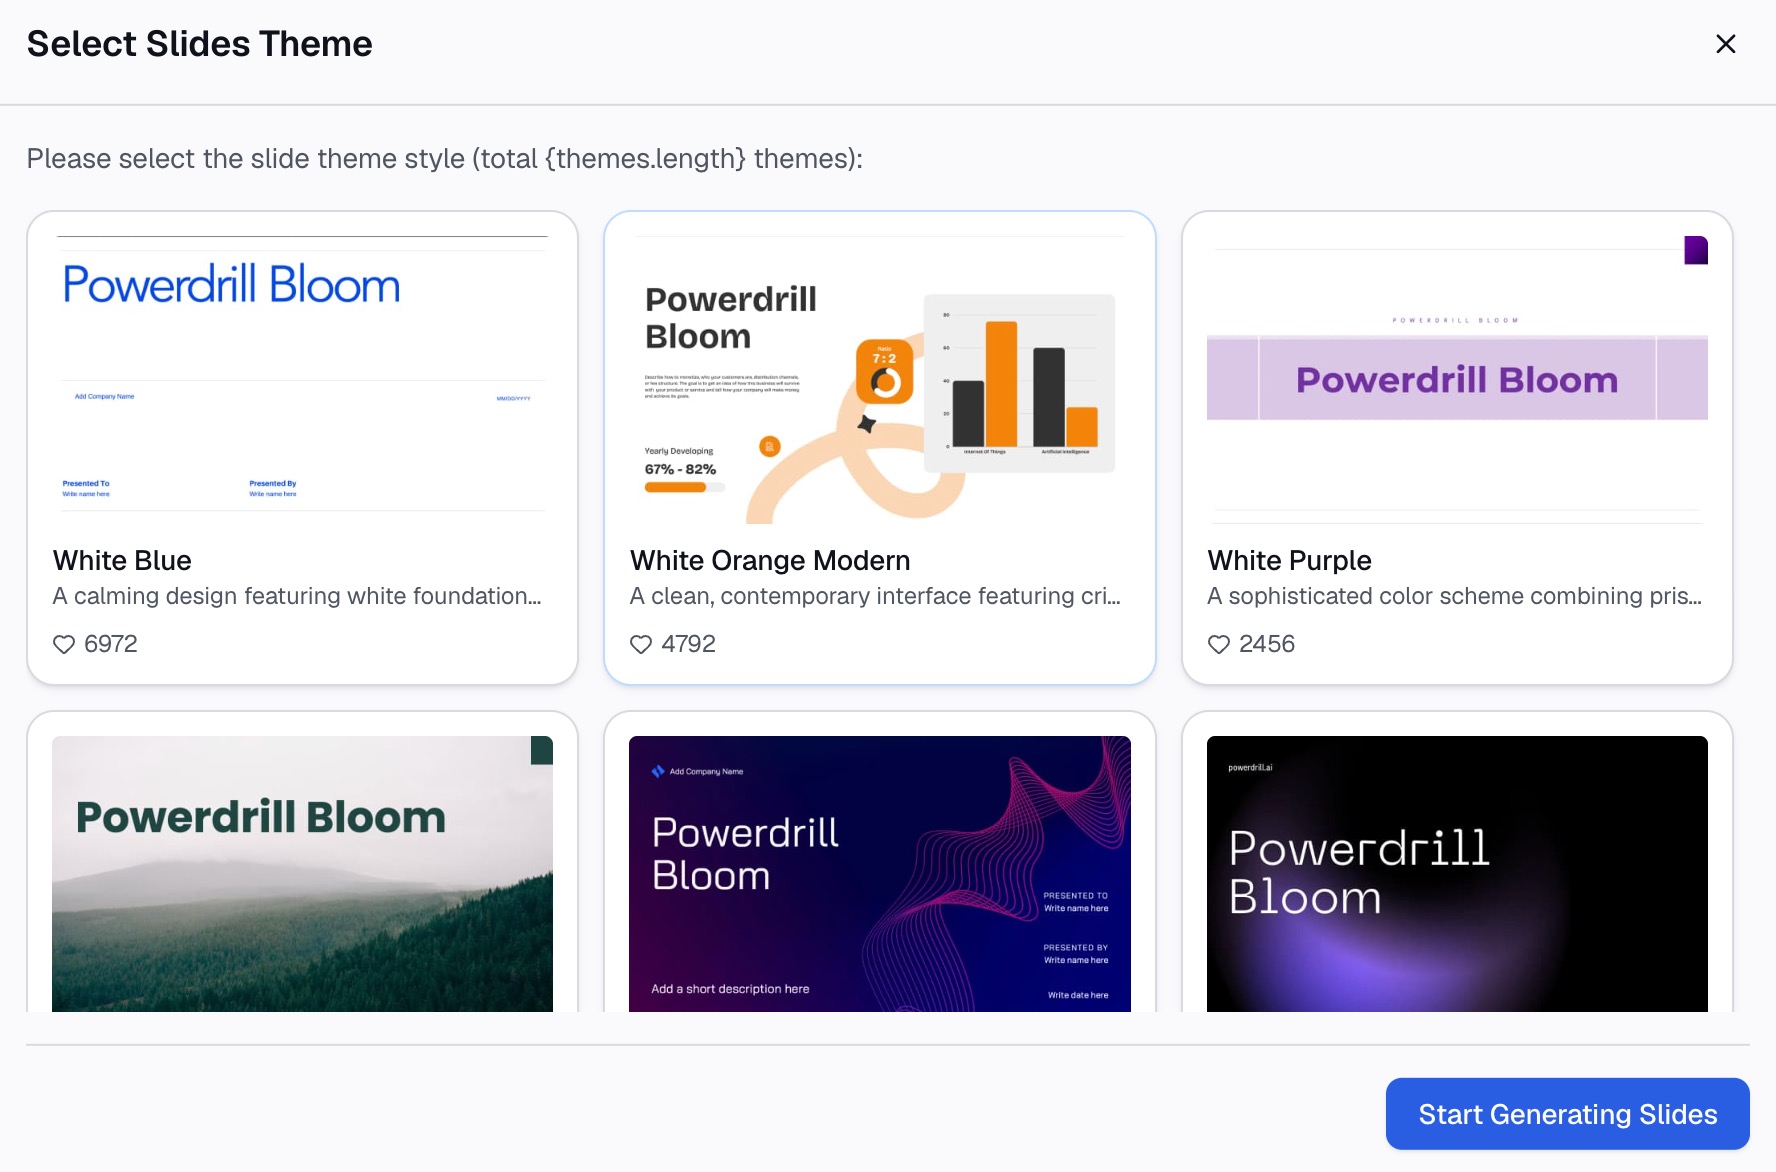
Take the summary out as a written report, pair it with the supporting charts, or convert the canvas into slides. Professional, Business, and Fancy styles export to PowerPoint or Notion. The AI report generator page covers the longer-form output that sits behind the summary.
A worked example
Before. "In Q3 we analyzed performance across all regions and channels. Revenue was $2.4M. EMEA grew. APAC declined. Paid search CAC increased. Retention was broadly stable, although some segments showed variation. Further analysis is recommended."
Six sentences, no conclusion, no denominators, and an ask that asks for nothing.
After. "Q3 revenue landed at $2.4M, 8% below plan, with the entire shortfall coming from APAC. APAC billings fell 22% against a 340-account base, while EMEA grew 11% on 210 accounts. Paid search CAC rose from $310 to $445, which explains roughly half the APAC gap. The rest appears to be a pricing change made in July, though we have not isolated it yet. We are asking to pause APAC paid search for six weeks and reallocate the budget to EMEA."
Same underlying data. The second version names the cause, carries every denominator, marks the uncertain part as uncertain, and ends with something to approve.
Notice what it leaves out. There is no method section, no mention of the tools used, and no list of the regions that behaved normally.
Common mistakes
Burying the conclusion. Background first, verdict last, is the default instinct and it is wrong for this format.
Hedging every sentence. "Appears to suggest a potential trend" reads as having no finding. State the finding, then mark exactly which part is uncertain.
Using the summary to show your work. Method, sample sizes, and caveats belong in the body. The summary earns trust through precise numbers, not through visible effort.
Rounding into meaninglessness. "Roughly a fifth" costs you the credibility that "22% of 340 accounts" buys.
Writing for the wrong reader. A summary aimed at your manager and one aimed at the board are different documents. Name the reader before the first line.
Writing it first. The summary is the last thing you write, because you cannot know what matters until the analysis is finished.
The short version
An executive summary is a filtering exercise wearing the costume of a writing exercise. Conclusion first, three numbers with their denominators, one exception, one cause, one ask. Anything that would not change a decision goes to the appendix.
If the analysis behind it still has to be done, doing both in one pass is faster. Try Powerdrill Bloom free — upload the spreadsheet, describe the audience, and export the summary with its supporting charts. See also how to generate a board-ready financial summary and how to write an analysis report using AI.
Frequently asked questions
How long should an executive summary be?
One page, and usually 150 to 200 words. If it runs longer, you are including findings that would not change a decision. Length is the symptom, and weak filtering is the cause.
What is the difference between an executive summary and an abstract?
An abstract describes what a document contains, so the reader can decide whether to read it. An executive summary delivers the conclusion and the recommended action, so the reader can decide without reading the rest.
Should an executive summary include charts?
One chart at most, and only if it carries the main finding better than a sentence. Charts in a summary compete with the text for attention. Put the supporting visuals in the body.
How do I choose which metrics to include?
Ask whether anyone would act differently if the number were different. If the answer is no, it belongs in the appendix. Aim for three supporting figures, each with its denominator and its comparison period.
Do I write the executive summary first or last?
Last. You cannot decide what matters until the analysis is complete. Drafting it first tends to lock in a conclusion before the data has had a chance to contradict it.