How to Turn Raw E-commerce Orders Into a Sales Trend Report (Essential Guide)
Running a successful e-commerce business requires more than just sourcing great products and launching catchy marketing campaigns; it requires a deep, uncompromising understanding of your data. Every single time a customer clicks the "Checkout" button, your store generates a wealth of raw data. This includes order IDs, timestamps, stock keeping unit (SKU) numbers, customer locations, discount codes used, and shipping costs. However, left in its raw state, this data is essentially just an endless, intimidating spreadsheet of numbers and text. It tells you what happened, but it does absolutely nothing to tell you why it happened or what will happen next.
Transforming this raw, unstructured data into a cohesive, actionable narrative is the key to scaling your business, optimizing your inventory, and maximizing your profit margins. You need a way to connect the dots between scattered transactions and overarching business growth. This is exactly where a sales trend report comes in. By converting endless rows of transaction logs into clean, visual insights, you empower yourself to make strategic decisions rather than relying on gut feelings. In this comprehensive guide, we will walk you through exactly how to bridge the gap between raw e-commerce orders and high-level strategic reporting using modern AI tools.
What Is a Sales Trend Report
A sales trend report is a comprehensive analytical document that evaluates your historical sales data over specific periods to identify patterns, trajectories, and actionable insights. Rather than just giving you a snapshot of a single day’s revenue, it paints a broader picture of your business's financial health.
To fully grasp its value, here are the core components that define a sales trend report:
Time-Based Revenue Tracking: At its core, a trend report tracks how much revenue your store generates over specific time intervals—whether that is daily, weekly, monthly, or quarterly. This allows you to see if your overarching revenue trajectory is climbing, stagnating, or declining.
Product Performance Metrics: A thorough report breaks down your sales by individual SKUs or product categories. It separates your winning products from your dead stock, showing you exactly which items are driving your profit margins and which ones are tying up your capital.
Visualized Data Patterns: Raw numbers are difficult for the human brain to process at scale. A true sales trend report utilizes dynamic visualizations—such as line graphs for revenue growth, bar charts for product comparisons, and pie charts for market share—making complex data instantly digestible.
Customer Purchasing Habits: Trend reports often highlight how average order value (AOV) fluctuates and how purchasing behaviors change over time. This helps you understand if customers are buying more items per transaction or if they are waiting for massive discount events to make their purchases.
Predictive Forecasting Baselines: By analyzing historical patterns, a sales trend report acts as the foundational baseline for predictive forecasting. Recognizing past trends allows business owners to anticipate future demand, helping to optimize supply chain logistics and marketing budgets.
How to Turn Raw E-commerce Orders Into a Sales Trend Report
Transitioning from raw CSV files to a beautifully formatted, insightful trend report used to require hours of manual data entry, complex spreadsheet formulas, and a deep understanding of pivot tables. Today, the process has been entirely revolutionized.
By leveraging advanced artificial intelligence, you can automate the heavy lifting and focus strictly on the insights. Below is the step-by-step process for turning your raw e-commerce orders into a professional sales trend report using Powerdrill Bloom, an intuitive AI-powered data analysis tool.
Step 1: Upload Your Raw E-commerce Orders to Powerdrill Bloom
The first step is gathering your raw data. Regardless of the e-commerce platform you use—whether it is Shopify, WooCommerce, Amazon Seller Central, BigCommerce, or Magento—you can easily navigate to your analytics or orders dashboard and export your historical order data. This export is typically provided in a CSV (Comma Separated Values) or Excel format. Ensure that your export includes crucial data points such as the order date, item name or SKU, quantity sold, item price, and total order value.

Once you have your file downloaded to your computer, it is time to bring it into the AI environment. Simply log into your Powerdrill Bloom account and initiate a new project. The platform features a highly intuitive, drag-and-drop interface. You just take your raw CSV or Excel file and drop it into the upload zone. Unlike traditional databases that require strict formatting and schema mapping, Powerdrill Bloom is designed to intelligently scan, read, and understand the context of your raw e-commerce columns automatically.
Step 2: Ask Bloom to Create a Sales Trend Report
Once your raw data is securely uploaded, the true magic of AI-driven analysis begins. In a traditional workflow, you would now have to start writing complex formulas (like VLOOKUPs or SUMIFs) and manually highlighting cells to generate charts. With Powerdrill Bloom, you simply use natural language. You interact with the platform exactly as you would with a human data analyst.
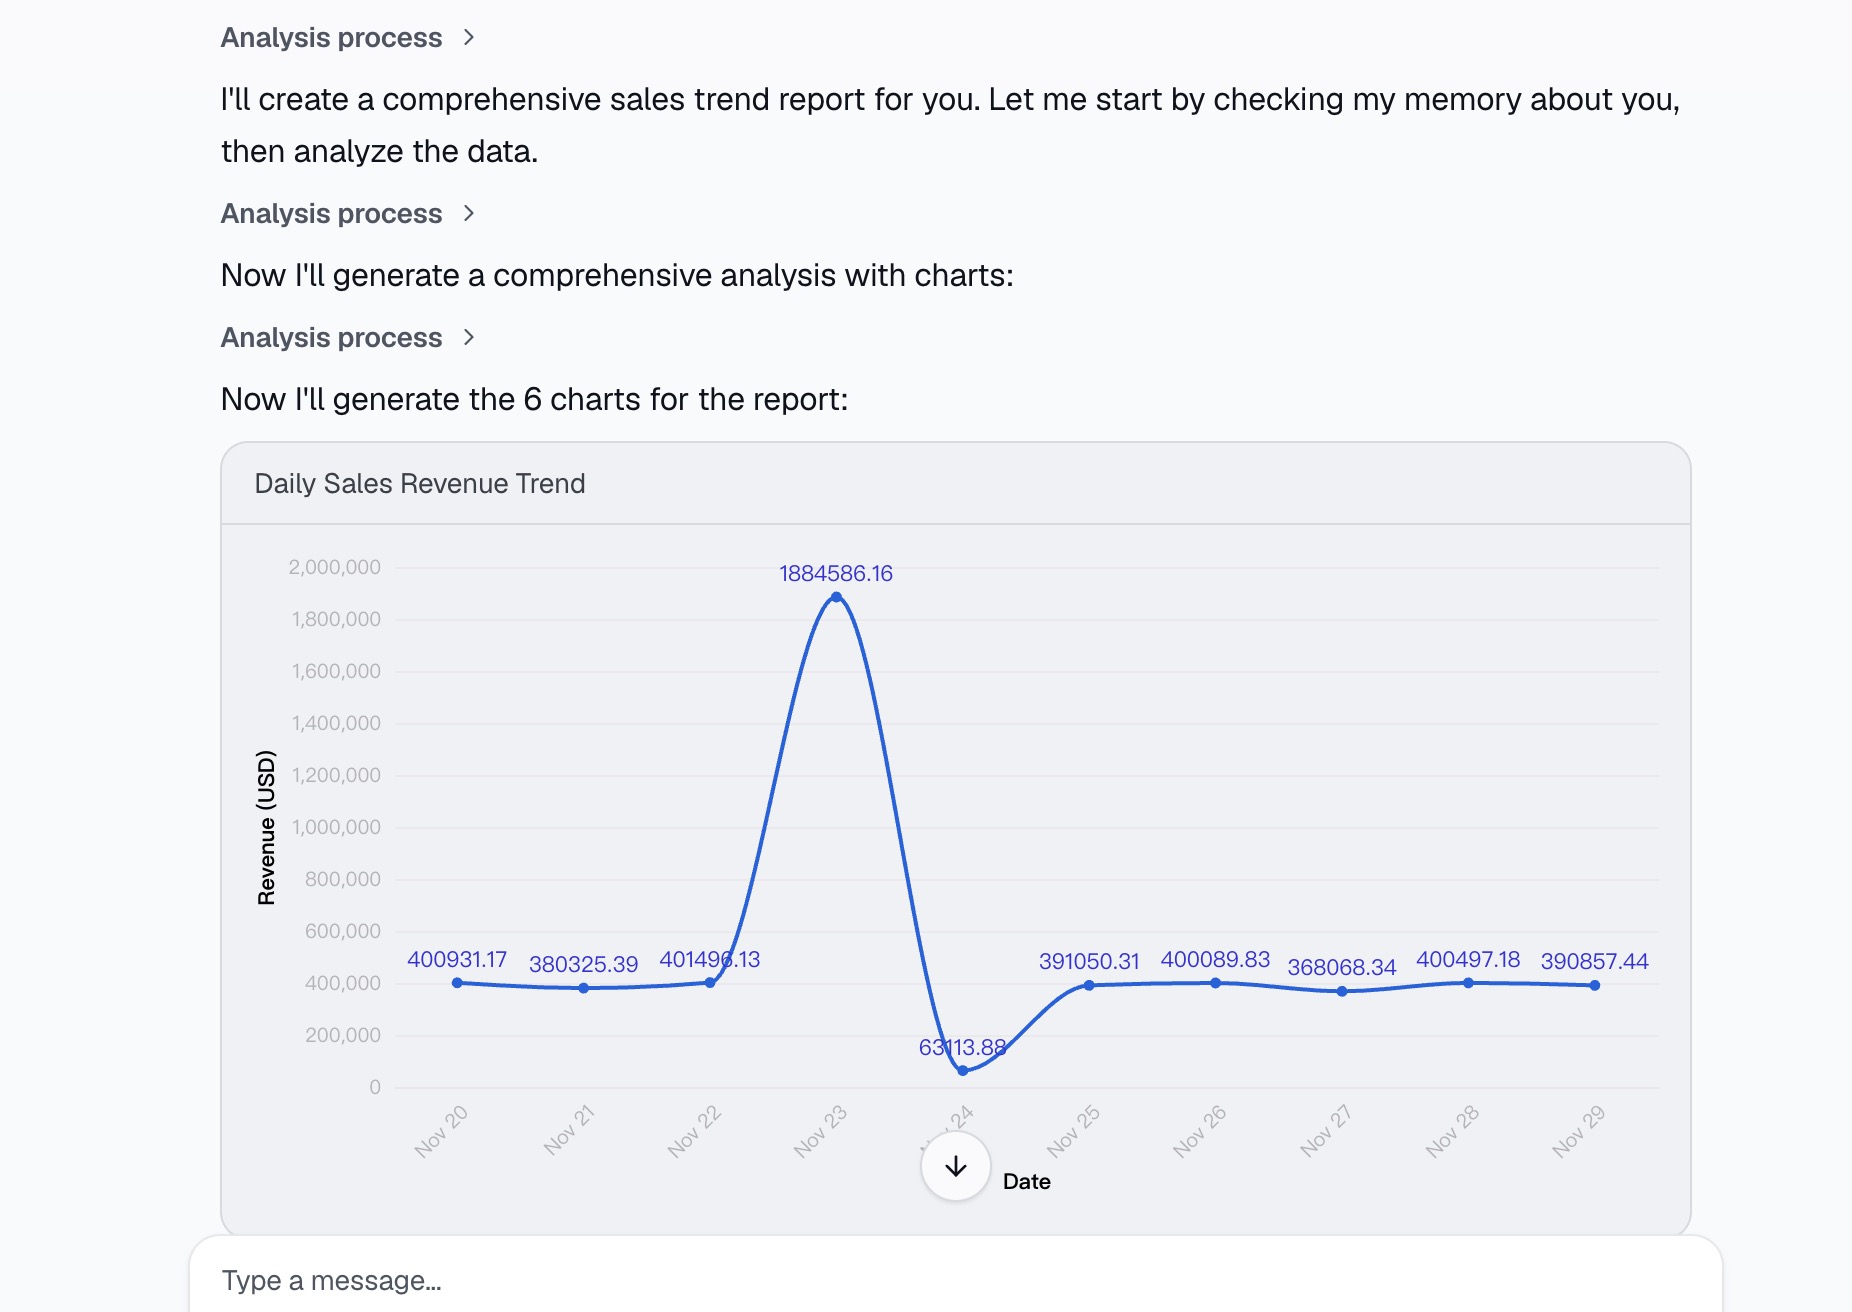
You can start by typing a broad prompt into the chat interface, such as: "Create a comprehensive sales trend report based on this data."
Because Powerdrill Bloom understands the context of your questions, it will instantly generate dynamic charts, statistical summaries, and contextual text explaining the trends it found. You are actively building your report through simple conversation.
Step 3: Download Your Sales Trend Report
After you have interacted with Bloom and it has generated all the necessary charts, graphs, and textual insights, the final step is extracting that information so you can put it to use. You likely need to share these findings with your marketing team to plan upcoming campaigns, or with your logistics manager to forecast inventory needs.
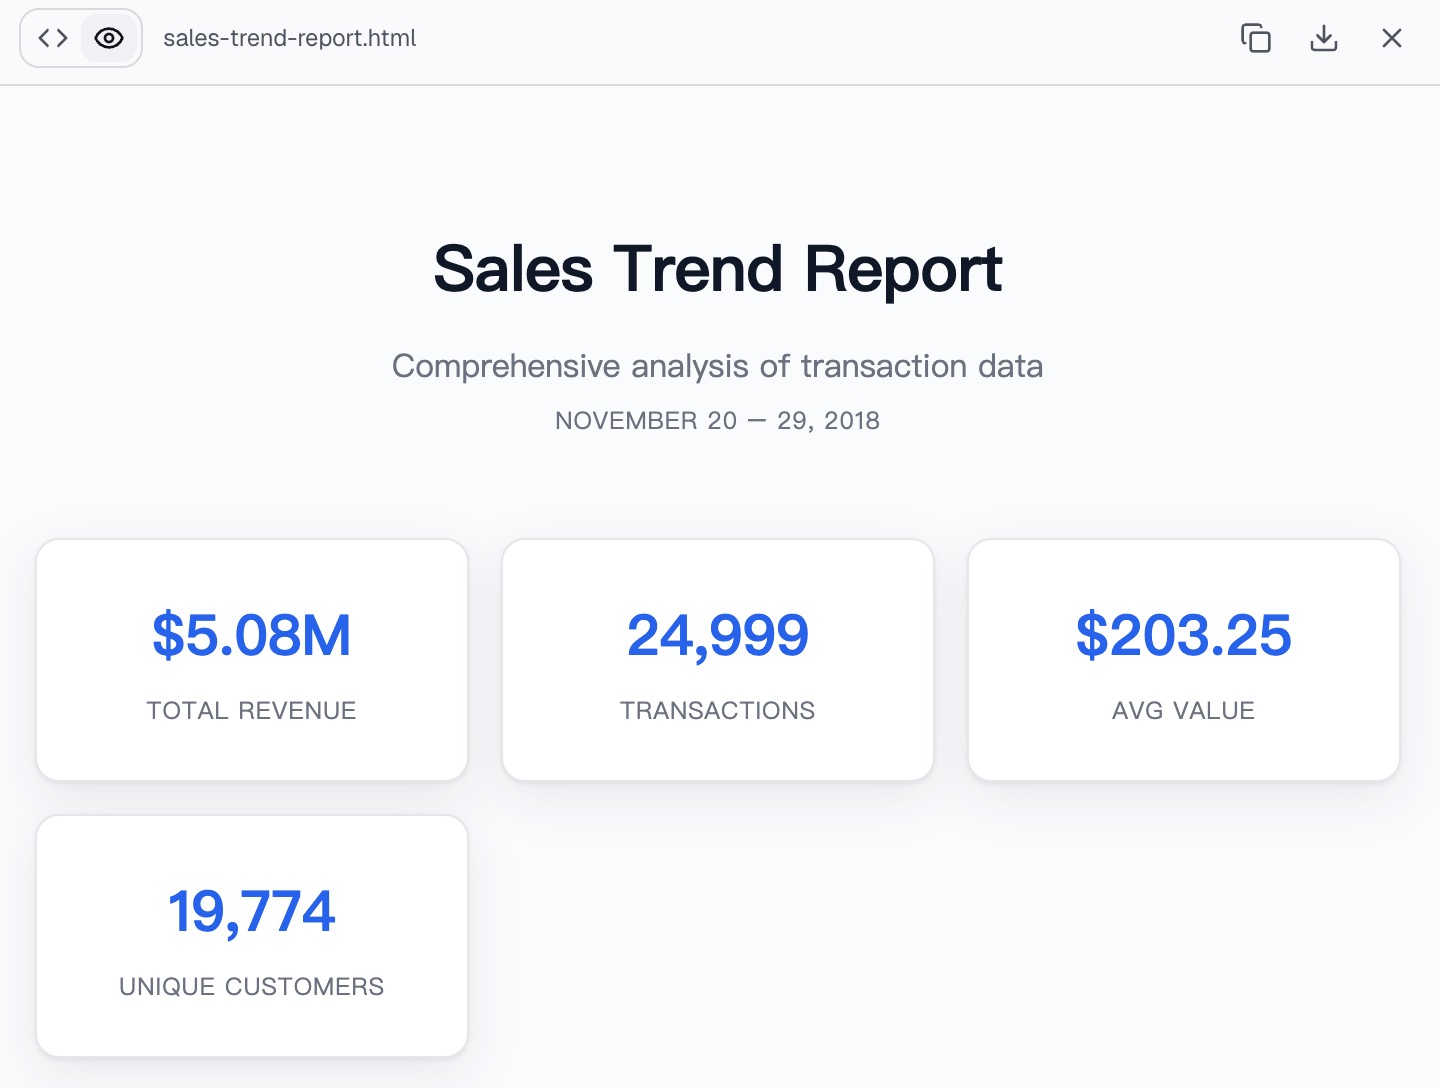
With Powerdrill Bloom, exporting your finished analysis is completely effortless. You do not need to manually compile screenshots, organize dashboards, or copy-paste data into a separate presentation. Instead, you can directly download your entire sales trend report with a single click. The report is exported as a clean, self-contained HTML file.
This format is incredibly convenient because it can be opened directly and instantly in any standard web browser (like Chrome, Safari, or Edge)—no special software, plugins, or formatting required. The HTML file neatly preserves all of your AI-generated insights, queries, and dynamic visualizations in one lightweight, easily shareable document. What used to take days of manual data wrangling is now completed, seamlessly formatted, and ready to view or share in a matter of minutes.
What Your Sales Trend Report Can Reveal
Once you have your sales trend report generated, you are no longer flying blind. The insights extracted from raw data can completely shift how you operate your e-commerce brand. By analyzing this document, you can uncover hidden opportunities and mitigate risks before they impact your bottom line.
Here is what your newly generated sales trend report can reveal:
Peak Seasonal Windows and Valleys: Your report will pinpoint exactly when your sales naturally spike and when they dip. This reveals your true peak seasons, allowing you to allocate your advertising budget aggressively when conversion rates are historically highest, and scale back during known slow periods.
Inventory Depletion Rates: By tracking how fast certain SKUs move over time, the report reveals which items are at risk of stocking out. This allows you to calculate accurate reorder points, ensuring you never miss a sale due to unavailable inventory.
Underperforming "Dead Weight" Products: Just as it highlights winners, the report exposes products that are consistently trending downward. This reveals which items are tying up your cash flow, signaling that it might be time to run a clearance sale and discontinue the SKU entirely.
The Impact of Price Changes: If you recently raised or lowered your prices, the trend report will reveal the direct impact of that decision on your overall sales volume. You can easily see if a 10% price increase led to a massive drop in order volume, or if your customers absorbed the cost without hesitation.
Geographical Hotspots: Trend reports can reveal unexpected spikes in demand from specific cities, states, or countries. If you notice a rising trend in a particular region, you can tailor your localized Facebook or Google ads to capitalize on that specific geographic momentum.
Why Use AI Instead of Building the Report Manually
For years, e-commerce managers relied on manual data entry and spreadsheet manipulation to build their monthly reports. While traditional spreadsheet software is powerful, it is also highly prone to human error and incredibly time-consuming. Leveraging AI for your data analysis provides a massive competitive advantage.
Here is why you should use AI to build your reports rather than doing it manually:
Massive Time Savings: Manual reporting requires hours of downloading, cleaning, filtering, and charting data. AI tools process thousands of rows of e-commerce data in seconds, giving you back hours of your week to focus on actual business strategy rather than administrative tasks.
Eradication of Human Error: One misplaced decimal point or a broken formula in a massive spreadsheet can completely skew your financial understanding. AI algorithms apply consistent, accurate mathematical processing, ensuring your trends and totals are completely reliable.
No Technical Expertise Required: You do not need to know SQL, Python, or complex VBA macros to get deep insights. Because AI tools utilize natural language processing, you simply ask questions in plain English, democratizing data analysis for business owners without technical backgrounds.
Instant Adaptability: If you build a manual report and your boss suddenly asks to see the data grouped by week instead of by month, you have to rebuild your pivot tables. With AI, you simply ask, "Can you show this weekly instead?" and the visualizations update instantly.
Automated Insights: Spreadsheets only show you what you explicitly ask them to calculate. AI tools go a step further by proactively highlighting anomalies—such as an unexpected drop in average order value—that you might not have known to look for manually.
Final Thoughts
Thriving in the highly competitive e-commerce landscape requires making swift, data-backed decisions. Raw order data is only valuable if you can translate it into clear, understandable trends that guide your marketing, pricing, and inventory strategies. As we've explored, relying on manual spreadsheets to parse through thousands of orders is no longer necessary, nor is it efficient.
It is time to stop dreading the data analysis process and start utilizing your transaction history to drive real growth. If you are ready to effortlessly turn your raw e-commerce orders into beautiful, actionable insights without writing a single formula, it is time to experience the future of data analytics. Head over to Powerdrill Bloom today, upload your latest sales data, and watch as your raw numbers are instantly transformed into the ultimate sales trend report.
FAQs
What file types can I upload to the AI?
You can seamlessly upload CSV, Excel, and JSON files that are exported directly from your e-commerce platforms.
Is my store data secure with Bloom?
Yes, Powerdrill Bloom uses strict, enterprise-grade encryption to ensure your raw e-commerce data remains entirely private and secure.
Do I need coding skills to make reports?
Not at all. You simply use everyday natural language to ask the AI for the exact charts you need.
Can I analyze data from multiple platforms?
Yes, you can combine raw order data from Shopify, Amazon, and WooCommerce to create one unified, comprehensive trend report.
How long does the AI analysis take?
The AI processes your raw files and generates comprehensive, visual trend reports in just a matter of seconds.